Explore
 Validate
 Learn
Learn Flow cytometry
Antibody data
- Antibody Data
- Antigen structure
- References [0]
- Comments [0]
- Validations
- Flow cytometry [1]
- Other assay [5]
Submit
Validation data
Reference
Comment
Report error
- Product number
- 64-0038-42 - Provider product page

- Provider
- Invitrogen Antibodies
- Product name
- CD3 Monoclonal Antibody (UCHT1), Super Bright™ 645, eBioscience™
- Antibody type
- Monoclonal
- Antigen
- Other
- Description
- Description: The UCHT1 monoclonal antibody reacts with human CD3e, a 20 kDa subunit of the TCR complex. Along with the other CD3 subunits gamma and delta, the epsilon chain is required for proper assembly, trafficking and surface expression of the TCR complex. CD3 is expressed by thymocytes in a developmentally regulated manner and by all mature T cells. Crosslinking of TCR via immobilized UCHT1 initiates an intracellular biochemical pathway resulting in cellular activation and proliferation. Applications Reported: This UCHT1 antibody has been reported for use in flow cytometric analysis. Applications Tested: This UCHT1 antibody has been pre-diluted and tested by flow cytometric analysis of normal human peripheral blood cells. This may be used at 5 µL (0.5 µg) per test. A test is defined as the amount (µg) of antibody that will stain a cell sample in a final volume of 100 µL. Cell number should be determined empirically but can range from 10^5 to 10^8 cells/test. Super Bright 645 is a tandem dye that can be excited with the violet laser line (405 nm) and emits at 645 nm. We recommend using a 660/20 bandpass filter. Please make sure that your instrument is capable of detecting this fluorochrome. When using two or more Super Bright dye-conjugated antibodies in a staining panel, it is recommended to use Super Bright Complete Staining Buffer (Product # SB-4401) to minimize any non-specific polymer interactions. Please refer to the datasheet for Super Bright Staining Buffer for more information. Light sensitivity: This tandem dye is sensitive to photo-induced oxidation. Please protect this vial and stained samples from light. Fixation: Samples can be stored in IC Fixation Buffer (Product # 00-8222) (100 µL of cell sample + 100 µL of IC Fixation Buffer) or 1-step Fix/Lyse Solution (Product # 00-5333) for up to 3 days in the dark at 4°C with minimal impact on brightness and FRET efficiency/compensation. Some generalizations regarding fluorophore performance after fixation can be made, but clone specific performance should be determined empirically. Excitation: 405 nm; Emission: 645 nm; Laser: Violet Laser Super Bright Polymer Dyes are sold under license from Becton, Dickinson and Company.
- Reactivity
- Human
- Host
- Mouse
- Isotype
- IgG
- Antibody clone number
- UCHT1
- Vial size
- 100 Tests
- Concentration
- 5 µL/Test
- Storage
- 4° C, store in dark, DO NOT FREEZE!
No comments: Submit comment
Supportive validation
- Submitted by
- Invitrogen Antibodies (provider)
- Main image
- Experimental details
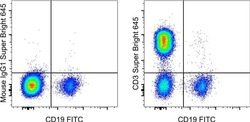
- Normal human peripheral blood cells were stained with CD19 Monoclonal Antibody, FITC (Product # 11-0199-42) and Mouse IgG1 kappa Isotype Control, Super Bright 645 (Product # 64-4714-82) (left) or CD3 Monoclonal Antibody, Super Bright 645 (Product # 64-0038) (right). Cells in the lymphocyte gate were used for analysis.

Supportive validation
- Submitted by
- Invitrogen Antibodies (provider)
- Main image
- Experimental details
- NULL
- Submitted by
- Invitrogen Antibodies (provider)
- Main image
- Experimental details
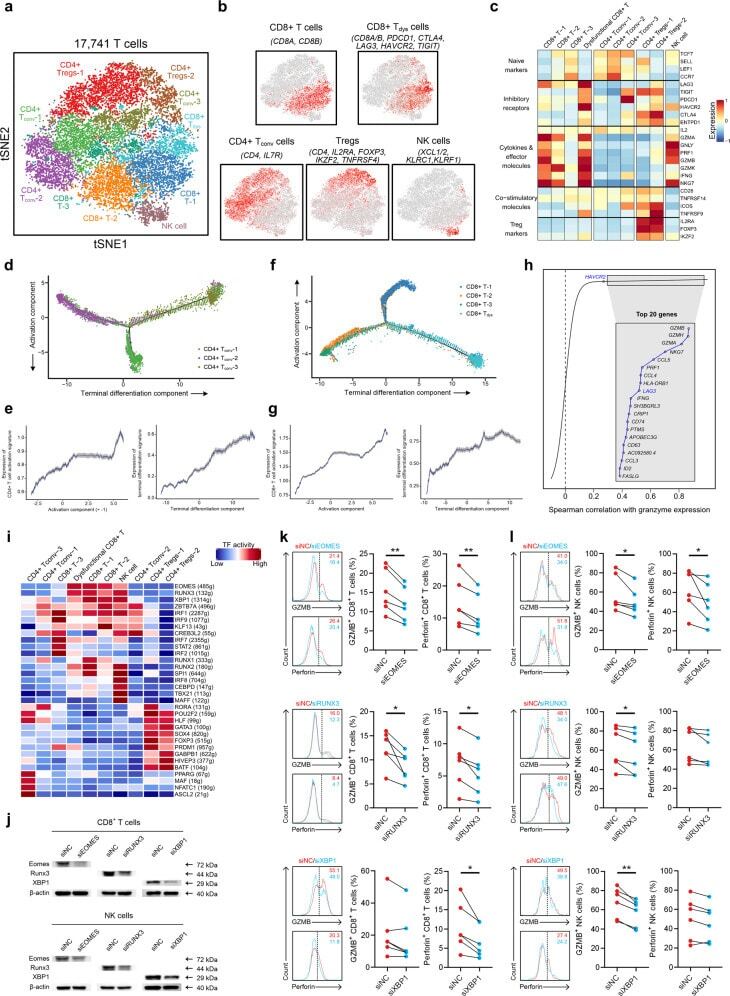
- Fig. 4 T/NK cell clusters in NPC. a t-SNE plot showing 10 clusters of 17,263 T/NK cells (indicated by colors). b t-SNE plot, color coding for the expression of the marker genes (gray to red) for the indicated cell subtypes. c Average expression of selected T cell function-associated genes of naive markers, inhibitory receptors, cytokines and effector molecules, co-stimulatory molecules, and Treg markers in each cell cluster. d Potential developmental trajectory of CD4 + T cells ( n = 5694) inferred by analysis with Monocle 2. Arrows show the increasing directions of certain CD4 + T cell properties annotated with the signatures shown in e . e Traceplots of (left) CD4 + T cell activation signature along activation component and (right) terminal differentiation signature along terminal differentiation component for the CD4 + T cells. Cells are projected along the component, with the blue line indicating the moving average of the expression of signatures (a sliding window of length equal to 5% of the total number of CD4 + T cells was used), and the shaded area displaying SEM. Signatures used are presented in Supplementary information, Table S9 . f Potential developmental trajectory of CD8 + T cells ( n = 6975) inferred by analysis with Monocle 2. Arrows show the increasing directions of certain CD8 + T cell properties annotated with the signatures shown in g . g Traceplots (as in e ) of (left) CD8 + T cell activation signature along activation component and (right) terminal diffe
- Submitted by
- Invitrogen Antibodies (provider)
- Main image
- Experimental details
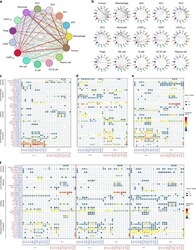
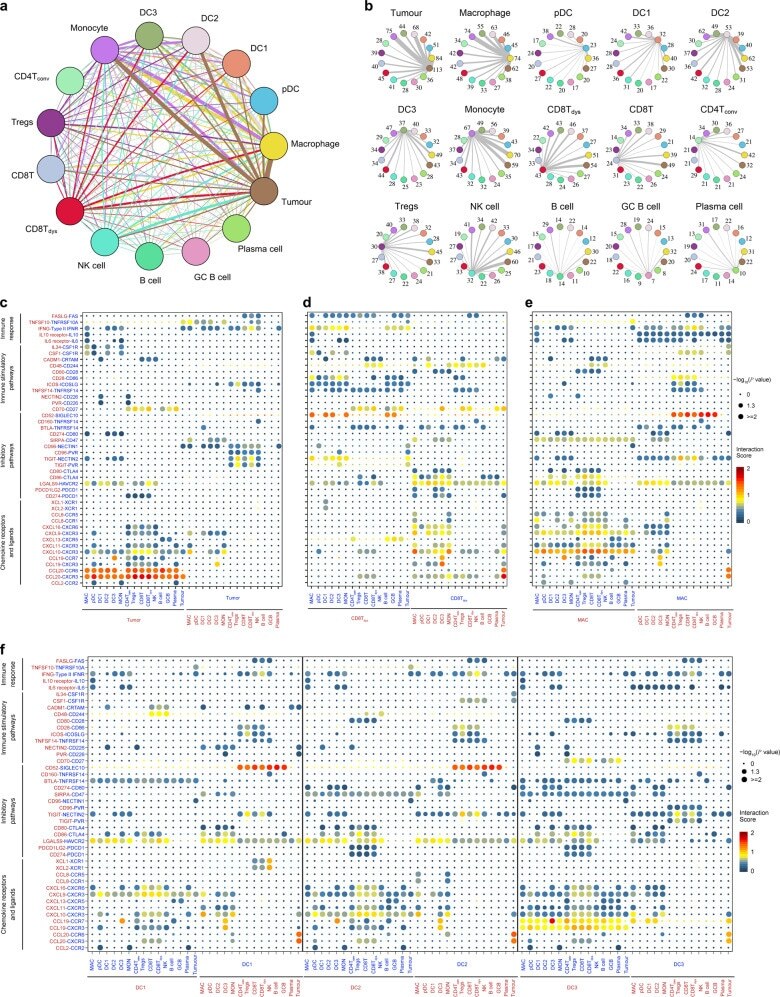
- Fig. 6 The dense network and multiple regulatory immune responses in the TME of NPC. a Capacity for intercellular communication between malignant cells and immune cells. Each line color indicates the ligands expressed by the cell population represented in the same color (labeled). The lines connect to the cell types that express the cognate receptors. The line thickness is proportional to the number of ligands when cognate receptors are present in the recipient cell type. The loops indicate autocrine circuits. The map quantifies potential communication but does not account for the anatomical locations or boundaries of the cell types. b Detailed view of the ligands expressed by each major cell type and the cells expressing the cognate receptors primed to receive the signal. Numbers indicate the quantity of ligand-receptor pairs for each intercellular link. c - f Overview of selected ligand-receptor interactions of tumor cells ( c ), dysfunctional CD8 + T cells ( d ), macrophages ( e ), and the three types of DCs ( f , DC1, DC2, and DC3). P values are indicated by circle size, with the scale to the right (permutation test). The means of the average expression levels of interacting molecule 1 in cluster 1 and interacting molecule 2 in cluster 2 are indicated by color. Assays were carried out at the mRNA level but were used to extrapolate protein interactions. CD4T conv , conventional CD4 + T cell; CD8T, CD8 + T cell; CD8T dys , dysfunctional CD8 + T cell; DC, dendritic cell; GCB
- Submitted by
- Invitrogen Antibodies (provider)
- Main image

- Experimental details
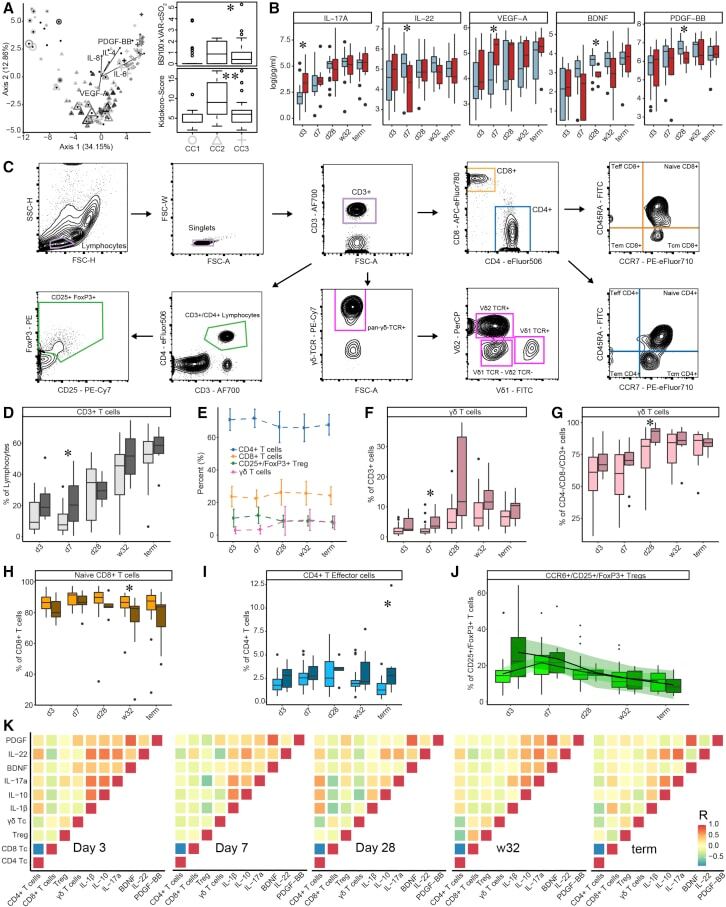
- Figure 2 T cell ontogenesis in extremely premature infants with and without severe brain injury (A) Principal coordinates analysis (PCoA)--biplot of sequestered cytokine and chemokine composition. Silhouette scoring identified 3 main cyto-Clusters (as indicated by different symbols). The shade of the symbols (gray to black) is determined by days post-delivery--the older the infant the darker the symbol. The size of the symbols is determined by the Kidokoro Score as assessed at term-equivalent age via cMRI--the higher the score the larger the symbol. Significantly correlated (p < 0.05) cytokines/chemokines are plotted as arrows. In addition, box plots next to PCoA show the range of combined values for burst suppression and variance of cranial oxygenation (BS/100 x VAR-cSO 2 ), as well as the range of Kidokoro Scores in the respective cyto-clusters (cyto-cluster 1, CC1; cyto-cluster 2, CC2; cyto-cluster 3, CC3). (B) Blood cytokine/chemokine concentrations in infants with (red) and without (blue) severe BI (3 days post-delivery, d3; 7 days post-delivery, d7; 28 days post-delivery, d28; 32 weeks of gestational age, w32; term-equivalent age = term). (C) Representative images illustrating the gating strategy for FACS analysis. Differently colored gates mark gating for respective cell populations. Magenta, untargeted; blue, T helper cells; orange, cytotoxic T cells; green, T regulatory cells; pink, gammadelta T cells. For box plots in (D) and (F-J), darker shade represents data from
- Submitted by
- Invitrogen Antibodies (provider)
- Main image
- Experimental details
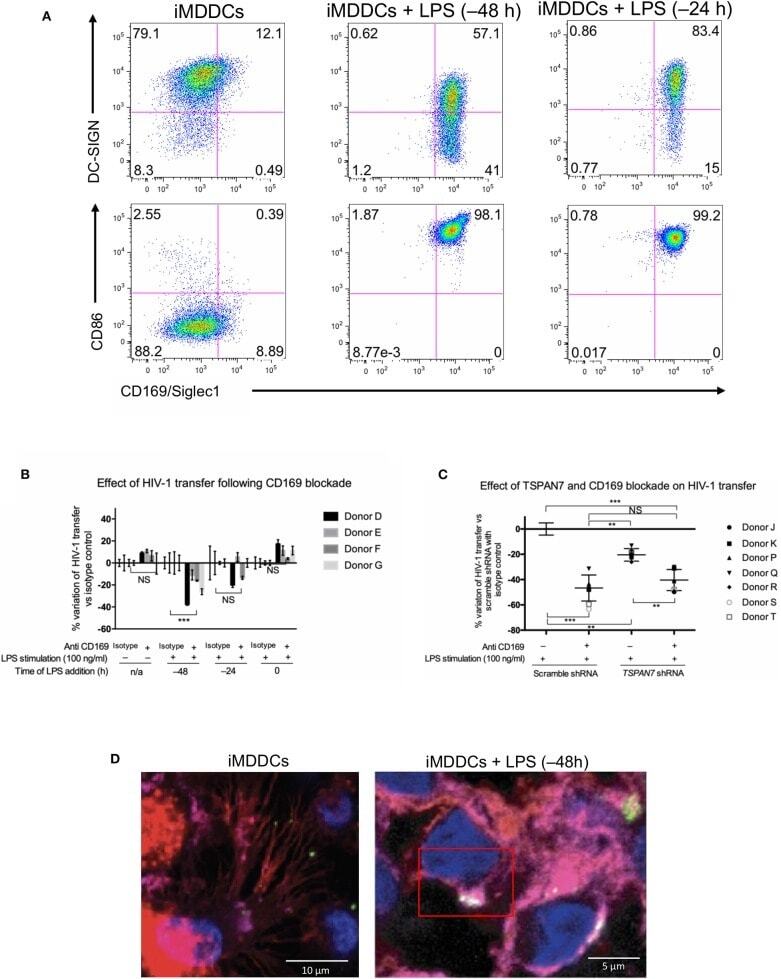
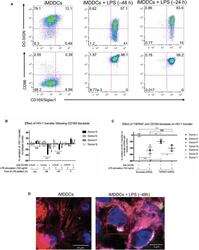
- Figure 5 CD169, as an HIV-1 receptor, mostly impacts transfer from mature MDDCs rather than immature MDDCs. (A) Flow cytometry plots showing CD86, DC-SIGN, and CD169 expression levels on MDDCs (pre-gated on SSC FSC, living cells, CD3 - cells and singlets). Panels show the expression of these proteins in iMDDCs (left panel) and MDDCs with LPS pretreatment at 100 ng/ml for 48 or 24 h before co-culture (middle and right panels, respectively). (B) Percentage of variation of HIV-1 transfer when using iMDDCs or LPS-treated MDDCs (100 ng/ml LPS for different lengths of time) incubated with a blocking antibody against CD169 as compared to an isotype control for each condition. Results are displayed for 4 different blood donors with the mean +- SD of technical triplicates. (C) Percent of variation in HIV-1 transfer to assess the impact of blocking CD169 and TSPAN7 knockdown as compared to scramble shRNA on MDDCs matured with LPS for 48 h treated by an isotype control. Mean +- SD of seven different blood donors in 4 experiments. (B,C) NS, not significant. ** p < 0.01; *** p < 0.001. (D) Confocal microscopy images of iMDDCs (left panel) and mature MDDCs (mMDDCs) right panel, to assess the degree of colocalization between CD169 (magenta) and incoming X4-HIV-1-Gag-iGFP (green). Actin filaments and nuclei were stained with phalloidin (red) and DAPI (blue). Four hundred nanometers of Z-stacks were taken 40 h after the start of the co-culture with CD4 + T cells and X4-HIV-1-Gag-iGFP. The pic