Explore
 Validate
 Learn
Learn Flow cytometry
Antibody data
- Antibody Data
- Antigen structure
- References [0]
- Comments [0]
- Validations
- Flow cytometry [1]
- Other assay [13]
Submit
Validation data
Reference
Comment
Report error
- Product number
- 67-0037-42 - Provider product page

- Provider
- Invitrogen Antibodies
- Product name
- CD3 Monoclonal Antibody (OKT3), Super Bright™ 702, eBioscience™
- Antibody type
- Monoclonal
- Antigen
- Other
- Description
- Description: The OKT3 monoclonal antibody reacts with an epitope on the epsilon-subunit within the human CD3 complex. The OKT3 antibody has been reported to have potent immunosuppressive properties in vivo and has been proven effective in the treatment of renal, heart and liver allograft rejection. The CD3 subunits, gamma, delta, and epsilon chains, are required for proper assembly, trafficking and surface expression of the TCR complex. CD3 is expressed by thymocytes in a developmentally regulated manner and by all mature T cells. Crosslinking of TCR initiates an intracellular biochemical pathway resulting in cellular activation and proliferation. Applications Reported: This OKT3 antibody has been reported for use in flow cytometric analysis. Applications Tested: This OKT3 antibody has been pre-titrated and tested by flow cytometric analysis of normal human peripheral blood cells. This can be used at 5 µL (0.5 µg) per test. A test is defined as the amount (µg) of antibody that will stain a cell sample in a final volume of 100 µL. Cell number should be determined empirically but can range from 10^5 to 10^8 cells/test. Super Bright 702 is a tandem dye that can be excited with the violet laser line (405 nm) and emits at 702 nm. We recommend using a 710/50 bandpass filter. Please make sure that your instrument is capable of detecting this fluorochrome. When using two or more Super Bright dye-conjugated antibodies in a staining panel, it is recommended to use Super Bright Complete Staining Buffer (Product # SB-4401) to minimize any non-specific polymer interactions. Please refer to the datasheet for Super Bright Staining Buffer for more information. Light sensitivity: This tandem dye is sensitive to photo-induced oxidation. Protect this vial and stained samples from light. Fixation: Samples can be stored in IC Fixation Buffer (Product # 00-8222) (100 µL of cell sample + 100 µL of IC Fixation Buffer) or 1-step Fix/Lyse Solution (Product # 00-5333) for up to 3 days in the dark at 4°C with minimal impact on brightness and FRET efficiency/compensation. Some generalizations regarding fluorophore performance after fixation can be made, but clone specific performance should be determined empirically. Excitation: 405 nm; Emission: 702 nm; Laser: Violet Laser Super Bright Polymer Dyes are sold under license from Becton, Dickinson and Company.
- Reactivity
- Human
- Host
- Mouse
- Isotype
- IgG
- Antibody clone number
- OKT3
- Vial size
- 100 Tests
- Concentration
- 5 µL/Test
- Storage
- 4° C, store in dark, DO NOT FREEZE!
No comments: Submit comment
Supportive validation
- Submitted by
- Invitrogen Antibodies (provider)
- Main image

- Experimental details
- Staining of normal human peripheral blood cells with Anti-Human CD19 FITC (Product # 11-0199-42) and Mouse IgG2a K Isotype Control Super Bright 702 (Product # 67-4724-82) (left) or Anti-Human CD3 Super Bright 702 (right). Cells in the lymphocyte gate were used for analysis.

Supportive validation
- Submitted by
- Invitrogen Antibodies (provider)
- Main image
- Experimental details
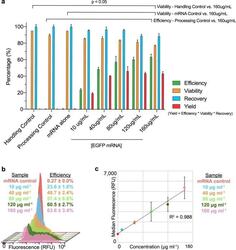
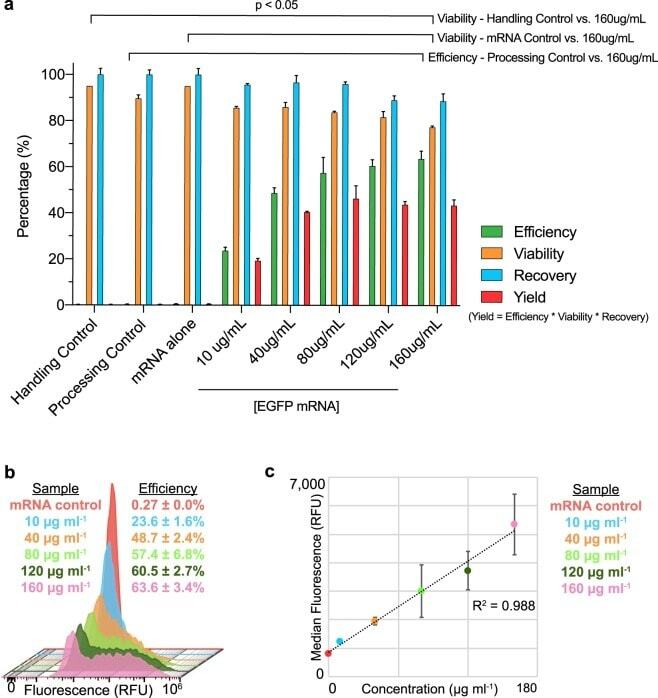
- Figure 3 EGFP mRNA delivered to primary human T lymphocytes via uVS . ( a ) Levels of EGFP protein expression (Efficiency, green), cell viability (Viability, yellow), cell recovery (Recovery, blue), and total yield (Yield, red) with increasing concentration of 996 nt EGFP mRNA (10 to 160 mug mL -1 ) delivered via muVS compared to a handling control (no mRNA, no device processing), mRNA control (160 mug mL -1 EGFP mRNA without device processing), and uVS device processing control (no mRNA) at 19 hours post transfection (n = 3 per condition). ( b ) Histogram overlays of EGFP protein expression levels from live, single CD3+ T cells analyzed via flow cytometry as a function of mRNA concentration at 19 hours post transfection. ( c ) Scatter plot of the median EGFP fluorescent intensity (in relative fluorescence units, RFU) and mRNA concentration at 19 hours post transfection. R-squared value calculated and displayed on graph. Data represent the mean +- SD ( a , b ) or median +- SD ( c ) of triplicate values. P values were calculated between groups by one-way ANOVA and post-hoc Kruskal-Wallis multiple comparisons test ( a ).
- Submitted by
- Invitrogen Antibodies (provider)
- Main image
- Experimental details
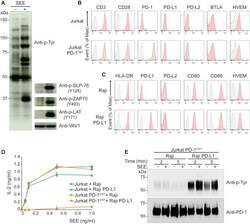
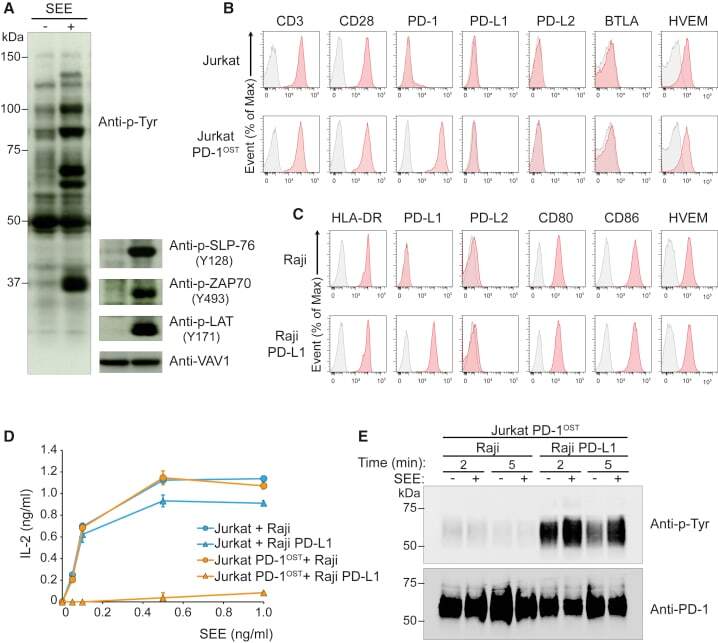
- Figure 3 Outcome of PD-1-PD-L1 Engagement at T Cell-APC Interface (A) Jurkat-PD-1 OST cells were stimulated with Raji cells that have been preincubated in the absence (-) or presence (+) of 200 ng/mL SEE and lysed 2 min after the initiation of cell-cell contact. Immunoblot analysis of equal amounts of lysates from the specified conditions probed with antibody to phosphorylated proteins (Anti-p-Tyr) or with phospho-tyrosine-specific antibodies directed against SLP76 pY128, ZAP70 pY493, LAT pY171 or VAV1 (loading control). Left margin, molecular size in kilodaltons (kDa). Data are representative of three independent experiments. (B) Expression of CD3, CD28, PD-1, PD-L1, PD-L2, BTLA, and HVEM at the surface of Jurkat cells and Jurkat-PD-1 OST cells, analyzed using flow cytometry. (C) Expression of HLA-DR, PD-L1, PD-L2, CD80, CD86, and HVEM at the surface of Raji cells and Raji-PD-L1 cells, analyzed using flow cytometry. In (B) and (C), gray shaded curves correspond to isotype-matched control antibody (negative control), and data are representative of two independent experiments. (D) IL-2 production by Jurkat and Jurkat-PD-1 OST cells stimulated for 24 h with either Raji or Raji-PD-L1 cells in the absence (0) or presence of the specified amounts of SEE. Data are representative of three independent experiments, and mean and SEM are shown. (E) Jurkat-PD-1 OST cells stimulated at 37degC with Raji or Raji-PD-L1 cells preincubated in the absence (-) or presence (+) of 200 ng/mL SEE an
- Submitted by
- Invitrogen Antibodies (provider)
- Main image
- Experimental details
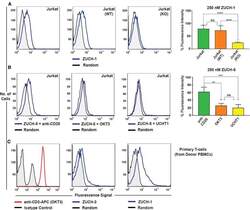
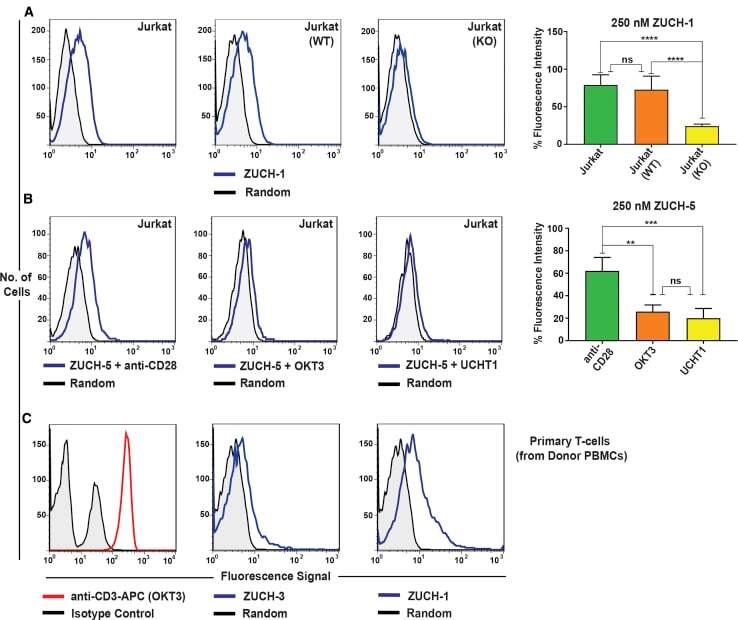
- Figure 6 Characterization of Aptamer Specificity against TCR-CD3epsilon (A) Flow-cytometric analyses of binding of the highest affinity aptamer, ZUCH-1, against Jurkat.E6 cells used in SELEX (left), against wild-type Jurkat cells used for generating CRISPR knockout cell lines (middle), against CRISPR double-knockout Jurkat cells (right), and the overall conclusion from six independent specificity analyses (far right). Aptamer ZUCH-1 does not bind to knockout cells, thereby demonstrating epitope specificity (ordinary one-way ANOVA, using Tukey''s multiple comparisons test performed on GraphPad Prism to obtain statistical significance: ****p
- Submitted by
- Invitrogen Antibodies (provider)
- Main image

- Experimental details
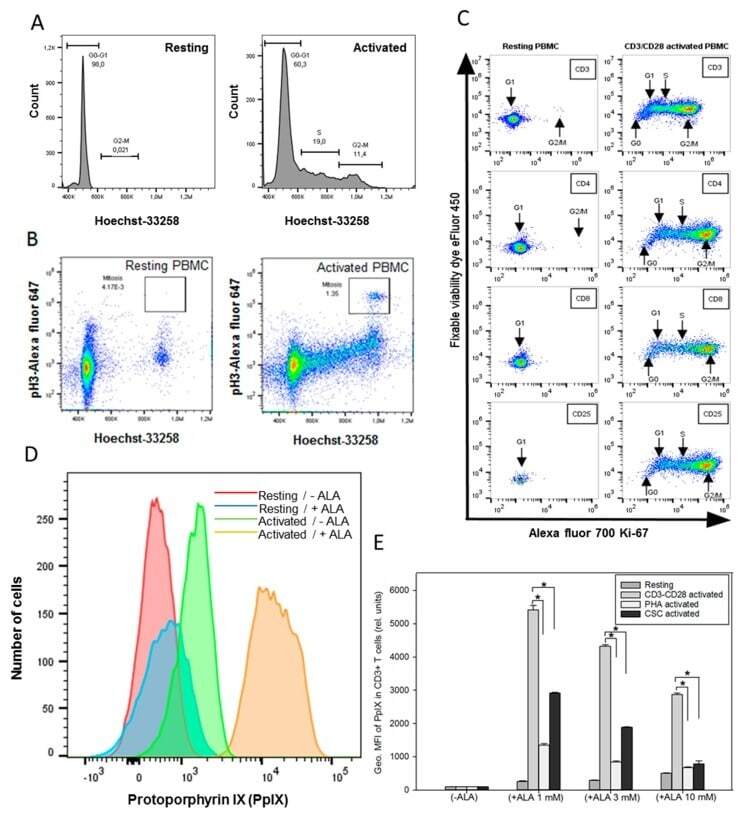
- Figure 1 ( A and B ) Cell cycle and mitosis measurements. PBMCs from healthy donor were activated in vitro with anti-CD3/CD28 antibodies for three days. Resting and activated cells were fixed in methanol and stored at -20 degC until use. Cells were stained with rabbit anti-phospho-Histone H3 followed by Alexa fluor 647 donkey anti-rabbit IgG and Hoechst 33258 dye before the measurements of cell cycle and mitosis by flow cytometry. ( C ) Resting and activated cells were divided into two groups and stained for CD4/CD25/Ki-67 or CD3/CD8/Ki-67 + fixable viability dye. ( D ) ALA-induced PpIX in resting and activated CD3 + T cells. Histograms of PpIX fluorescence in resting cells and anti-CD3/CD28 activated cells with (24 h of ALA incubation) and without ALA were compared; ( E ) effects of T cell activation protocols on ALA-induced PpIX production. Healthy donor PBMCs were activated in vitro with anti-CD3/CD28 for three days or overnight with phytohemagglutinin (PHA) or cell stimulation cocktail (CSC), and then incubated with ALA for 24 h before the measurement of the PpIX content in CD3 + T cells by flow cytometry. The geometric mean fluorescence (Geo. MFI) intensity of PpIX was used to compare various groups. * p < 0.05.
- Submitted by
- Invitrogen Antibodies (provider)
- Main image
- Experimental details
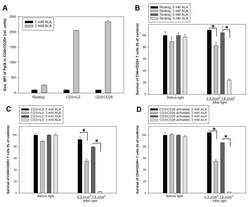
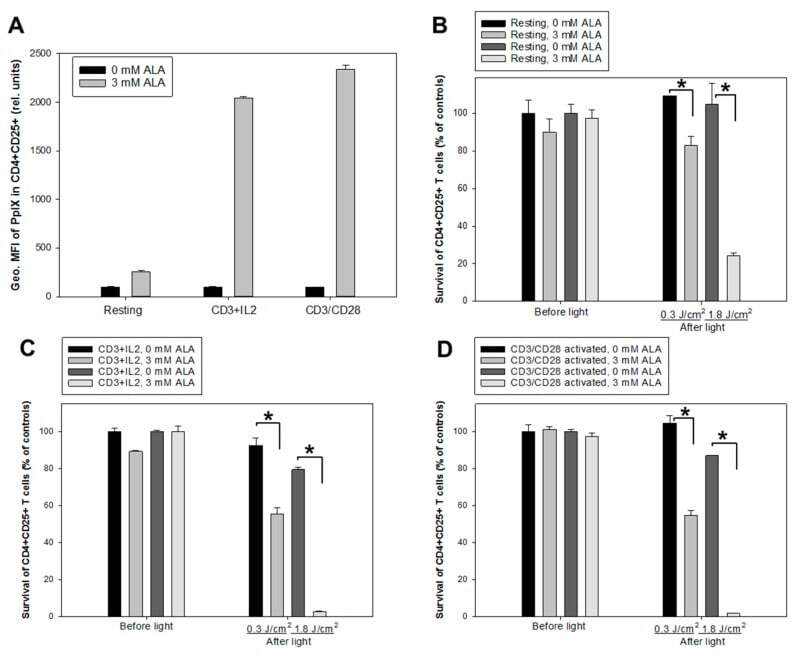
- Figure 5 ALA-induced PpIX production and PDT of CD4 + CD25 + T cells. Healthy donor PBMCs were either activated in vitro with anti-CD3/IL-2 or anti-CD3/CD28 or kept non-activated (resting) for three days. ( A ) geometric mean fluorescence intensity (Geo. MFI) of PpIX in CD4 + CD25 + cells incubated with 3 mM ALA for 1 h at 37 degC after anti-CD3/IL-2 or anti-CD3/CD28 activation; ( B , C and D ) resting and activated cells were incubated with 3 mM ALA for 1 h and then exposed to the in-house built LED blue light as indicated. The survivals of CD4 + CD25 + T cells were measured before light or 20 h after light exposure with flow cytometry as described in Figure 3 ; ( B ) for resting cells; while ( C and D ) for activated cells with anti-CD3/IL-2 and anti-CD3/CD28, respectively. * p < 0.05.
- Submitted by
- Invitrogen Antibodies (provider)
- Main image
- Experimental details
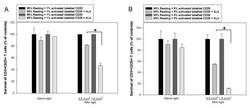
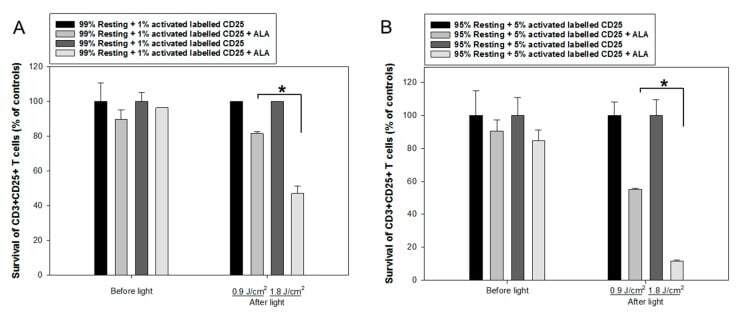
- Figure 7 ALA-PDT of mixed populations of resting and activated cells. Healthy donor PBMCs were activated in vitro with anti-CD3/CD28 antibodies for three days. The activated T cells were then labeled with anti-human CD25-FITC antibody. The resting and CD25-FITC labeled activated T cells were mixed in certain ratios as indicated. The mixed cells were incubated with 3 mM ALA for 1 h at 37 degC and then irradiated with the LED blue light at 0.9 J/cm 2 or 1.8 J/cm 2 . The cell survivals were measured 2 h after light irradiation with flow cytometry as described in Figure 3 . The control samples without light are also included. ( A ) Mixture of 1% CD25-FITC labelled activated T cells with 99% resting PBMCs. ( B ) Mixture of 5% CD25-FITC labelled activated T cells with 95% resting PBMCs. * p < 0.05.
- Submitted by
- Invitrogen Antibodies (provider)
- Main image
- Experimental details
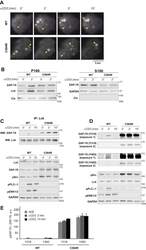
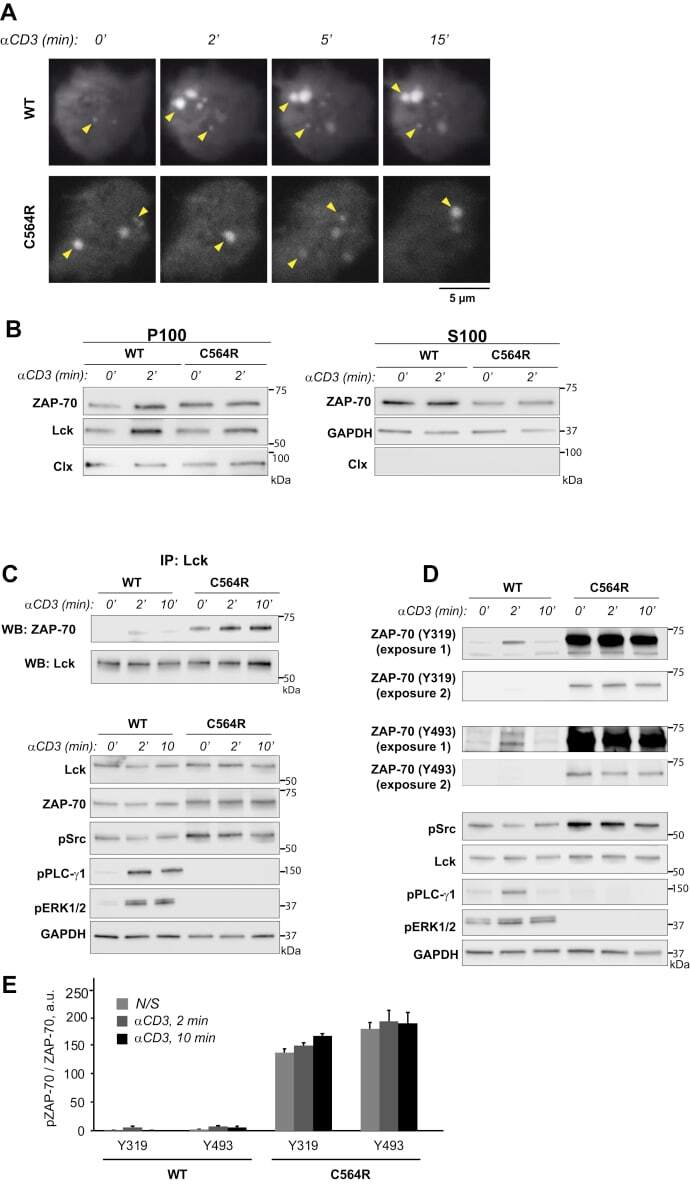
- Figure 3 Acylation-deficient ZAP-70 exhibits increased phosphorylation at Y319 and Y493. A , TIRF imaging of P116 (ZAP-70 -/-) Jurkat T cells transiently transfected with mCherry-tagged WT or acylation-deficient C564R ZAP70. Both WT ZAP-70 and C564R ZAP-70 showed similar localization patterns by forming puncta at the surface of the resting or stimulated cells. Shown are representative cells from three independent experiments. B , WT and C564R ZAP-70 were analyzed for membrane association by subcellular fractionation. GAPDH and calnexin were used as loading controls for cytosolic (S100) and membrane (P100) fractions, respectively. C , Coimmunoprecipitation of Lck and ZAP-70. P116 Jurkat T cells stably expressing WT or C564R ZAP-70 were stimulated with anti-CD3 antibody for the indicated time points. Lck was immunoprecipitated from the lysates, and the presence of ZAP-70 was assessed in eluates. D , Western blot analysis of ZAP-70 phosphorylation at Y319 and Y493. P116 Jurkat T cells stably expressing WT ZAP-70 or C564R ZAP-70 were stimulated with anti-CD3 antibody for the indicated time points, and phosphorylation of ZAP-70 was analyzed by immunoblotting. E , Quantified data showing phosphorylation of WT or C564R ZAP-70. Data shown are representative of three independent biological repeats and represented as mean +- SEM, normalized to total ZAP-70.
- Submitted by
- Invitrogen Antibodies (provider)
- Main image
- Experimental details
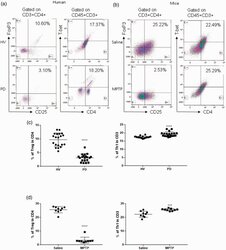
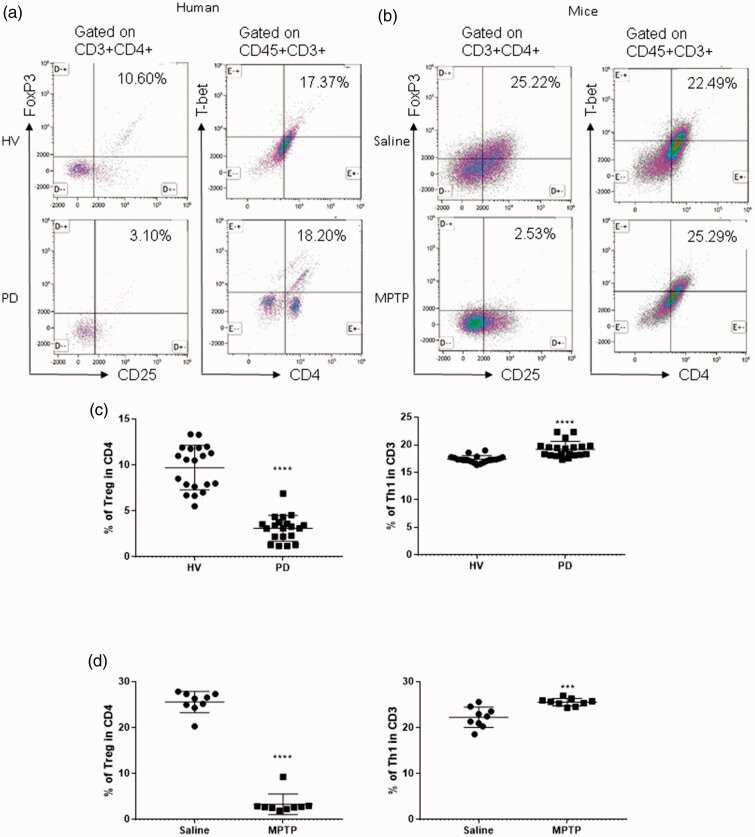
- Figure 1. Patients with Parkinson's disease (PD) and mice with experimental PD exhibit decreased regulatory T (Treg) and increased T helper 1 (Th1) cell numbers in the blood. Treg cells were defined as CD3+CD4+CD25+FoxP3+ cells, whereas Th1 cells were identified as CD3+CD4+T-bet+ cells. (a) Representative plots of Treg and Th1 cells in patients with PD and healthy volunteers (HVs). (b) Representative plots of Treg and Th1 cells in control mice (Saline) and 1-methyl-4-phenyl-1,2,3,6-tetrahydropyridine (MPTP)-treated mice. (c) Patients with PD exhibited lower Treg cell levels and greater Th1 cell levels in the blood than HVs. n = 20. ****, p < 0.0001 by a two-tailed Student's t tests. (d) MPTP-induced experimental PD mice had fewer Treg and more Th1 cells in the circulation than saline-treated mice. n = 9/group in each experiment performed in triplicate. ***, p < 0.001; ****, p < 0.0001, according to Student's t test.
- Submitted by
- Invitrogen Antibodies (provider)
- Main image
- Experimental details
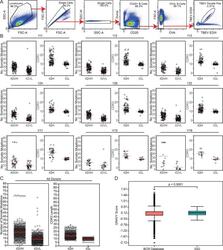
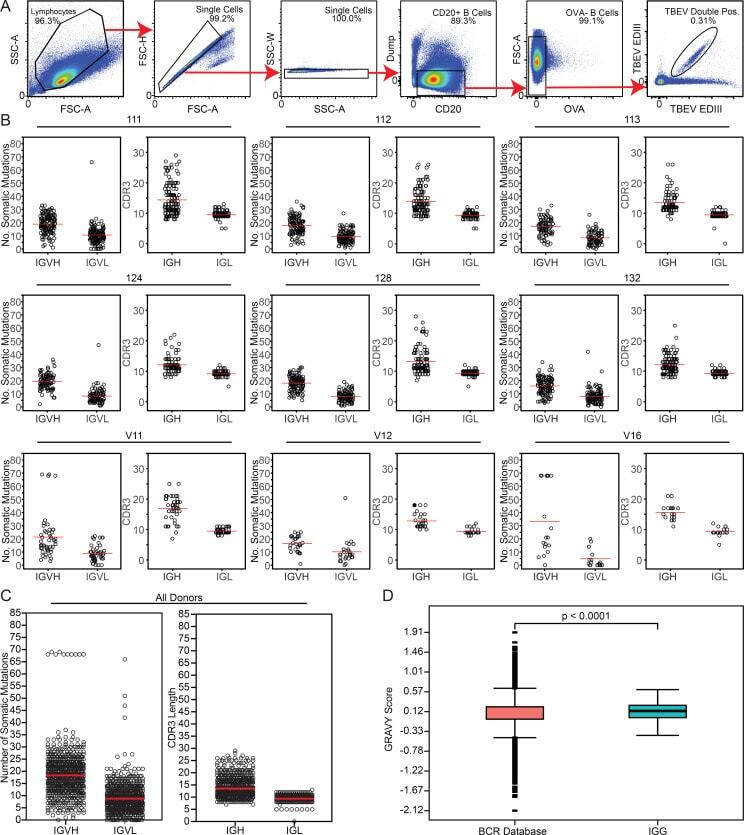
- Figure S2. Sorting strategy and antibody sequence analysis. (A) Sorting strategy. Forward and side scatter (FSC and SSC, respectively) were used to gate on single lymphocytes. Dump channel included CD3, CD8, CD14, CD16, and a viability dye. CD20 + B cells that failed to bind OVA (OVA - ) but did bind to the TBEV EDIII bait coupled with both PE and AF647 fluorophores were purified. (B) For each donor, the number of V gene somatic nucleotide mutations is shown on the left and the amino acid length of the CDR3 is shown on the right. (C) As in B, but for all donors combined. For B and C, horizontal red lines indicate the mean. (D) Distribution of hydrophobicity GRAVY scores at the IGH CDR3 of antibodies from all donors combined and compared with human repertoire (). P < 0.0001 was determined using the Wilcoxon nonparametric test. Related to Fig. 2 , Table S2 , and Table S3 .
- Submitted by
- Invitrogen Antibodies (provider)
- Main image
- Experimental details
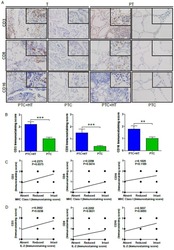
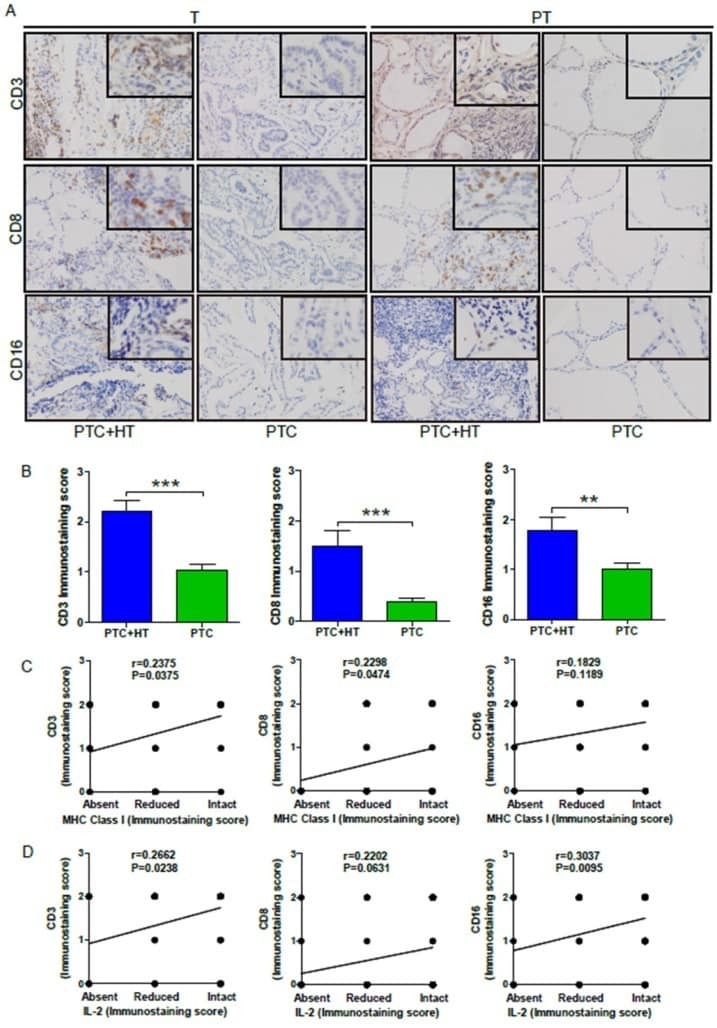
- Figure 3 UP-regulated CD3, CD8 and CD16 expression in PTC+HT tissues. A , IHC analysis of CD3, CD8, and CD16 expression in 53 PTC+HT, 91 PTC tumor (T) and their adjacent para-non-tumor tissue (PT). B , Immunostaining scores ofCD3, CD8, and CD16 expression in tumor tissues. C , The correlation between the immunostaining scores of HLA class I molecule and CD3, CD8 and CD16 expression. D , The correlation between the immunostaining scores of IL-2 and CD3, CD8 and CD16 expression. Data are representative images (magnification x 200 with a 400 inserter) or expressed as the mean +- SD of each group. * P
- Submitted by
- Invitrogen Antibodies (provider)
- Main image
- Experimental details
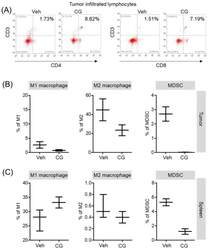
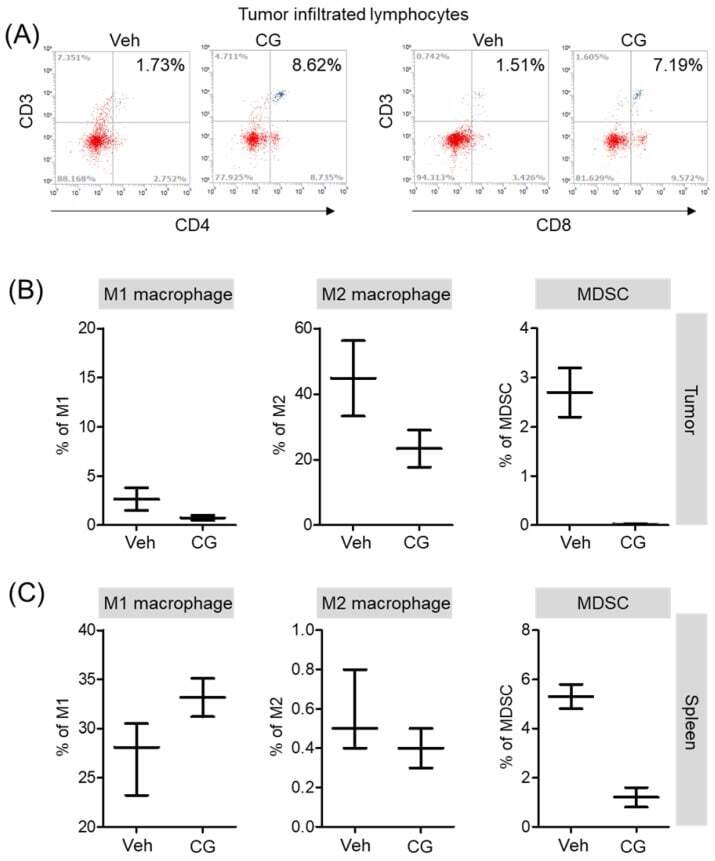
- Figure 6 The proportion of MDSCs and M1/M2 macrophage were changed by CG-745 treatment in Hepa1-6 syngeneic mouse model: (A-C) Hepa1-6 inoculated C57BL/6 mice were treated with vehicle or 15 mg/kg/day of CG (CG-745) by intraperitoneally for 5 days/week for 3 weeks. Tumor (A, B) and spleen (C) were harvested from each individual mouse. Cells were stained with fluorescence-conjugated antibodies specific to CD3, CD4, CD8, CD25 and Foxp3, and subjected to flow cytometry analysis. The graph shows means with error bars. Error bars represent standard deviations for 3 samples in each group. Results are representative of three separate experiments (A). p < 0.05.
- Submitted by
- Invitrogen Antibodies (provider)
- Main image
- Experimental details
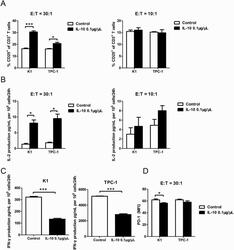
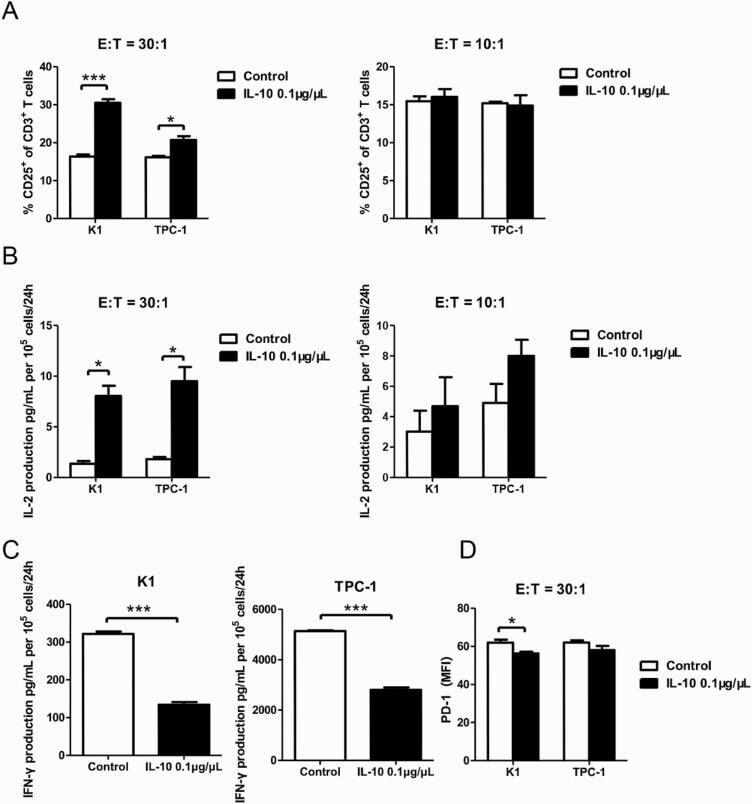
- Figure 4. IL-10 promotes T-cell activation in cocultures of CD3 + CD8 + CD25 + T cells and PTC cell lines. ( A ) Flow cytometry results of the CD25 + fraction of CD3 + T cells in coculture systems containing activated CD3 + CD8 + CD25 + T lymphocytes (effector cells, E) and pretreated PTC cells (K-1 and TPC-1 treated with 0.1 mug/muL of IL-10 for 24 hours; target cells, T) at various E:T ratios (30:1 and 10:1) (* P < 0.05, *** P < 0.001). ( B ) IL-2 production in coculture systems (details described above) measured by ELISA (* P < 0.05). ( C ) IFN-gamma production in coculture systems of CD3 + CD8 + CD25 + T lymphocytes and IL-10-stimulated PTC cells (K-1 and TPC-1) at a 30:1 ratio (*** P < 0.001). ( D ) Mean fluorescence intensity (MFI) of PD-1 expression in coculture systems of activated CD3 + CD8 + CD25 + T lymphocytes and IL-10 pretreated PTC cells at a 30:1 ratio (* P < 0.05). All tests were conducted in triplicate. ELISA, enzyme-linked immunosorbent assay; H, hours; IFN, interferon; IL, interleukin; PD-1, programmed death-1; PTC, papillary thyroid cancer.
- Submitted by
- Invitrogen Antibodies (provider)
- Main image
- Experimental details
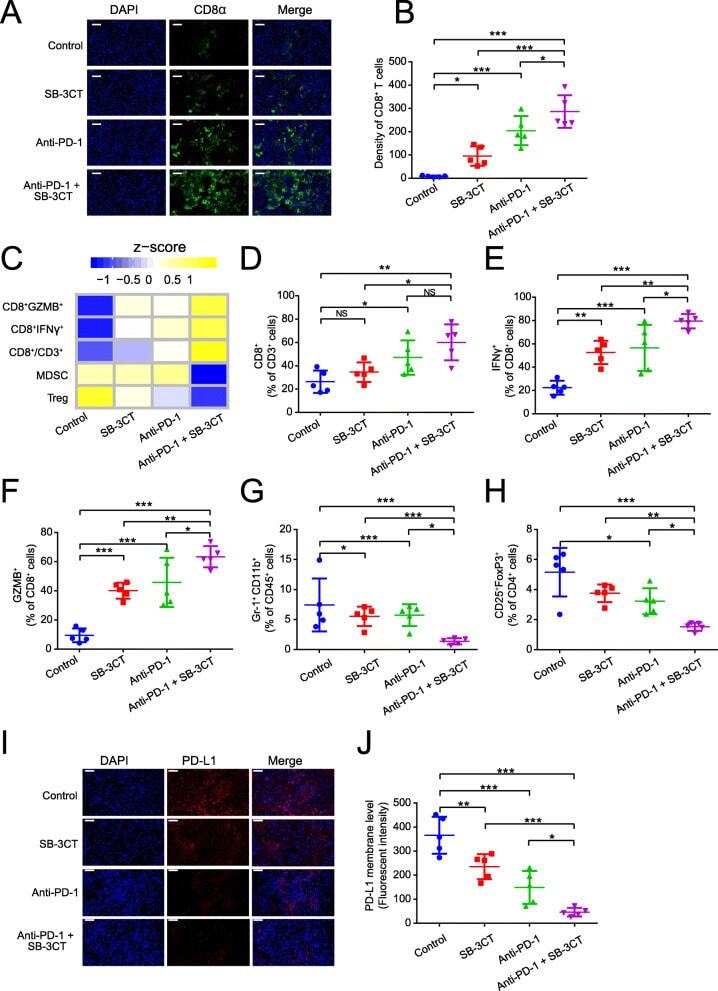
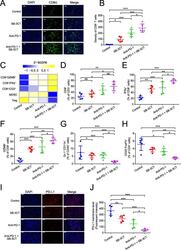
- Fig. 3 Immune features in tumors for B16F10 xenograft mouse model with SB-3CT treatment. a Fluorescence expression and b quantification of CD8 + T cells. c Heatmap of Z -score normalized percentage of immune cell populations ( d - h ) in TILs for B16F10 tumor-bearing mice treated with anti-PD-1 and SB-3CT in combination or alone. d - h In the implanted B16F10 tumors from mice treated with or without SB-3CT and PD-1 blockade, fluorescence-activated cell sorting (FACS) was used to measure d CD8 + in CD3 + T cells, e CD8 + IFNgamma + in CD8 + T cells, f CD8 + GZMB + in CD8 + T cells, g Gr-1 + CD11b + MDSCs in CD45 + cells, and h CD25 + FOXP3 + Treg in CD4 + cells. i Fluorescence expression and j quantification of PD-L1 in B16F10 tumor-bearing wild-type C57/BL6 mice treated with isotype, SB-3CT, anti-PD-1, or combination strategy. Sample size is 5 in each cohort. Scale bars, 50 mum. Results are mean +- s.d. ns, p > 0.05,* p < 0.05, ** p < 0.01, and *** p < 0.001, as determined by one-way ANOVA and Dunnett''s multiple comparison test