 Explore
 Validate
 Learn
Learn Flow cytometry
Antibody data
- Antibody Data
- Antigen structure
- References [19]
- Comments [0]
- Validations
- Flow cytometry [2]
- Other assay [16]
Submit
Validation data
Reference
Comment
Report error
- Product number
- 12-8813-42 - Provider product page

- Provider
- Invitrogen Antibodies
- Product name
- SSEA1 Monoclonal Antibody (eBioMC-480 (MC-480)), PE, eBioscience™
- Antibody type
- Monoclonal
- Antigen
- Other
- Description
- Description: The eBioMC-480 (MC-480) antibody reacts with the stage-specific embryonic antigen-1 (SSEA-1), a carbohydrate epitope expressed upon the surface of early mouse embryos, murine embryonal carcinoma cells (EC), murine embryonic stem cells (ES) and murine and human germ cells (EG). No immunoreactivity is evident with undifferentiated human EC and ES cells. Differentiation of human EC results in an increase in SSEA-1 expression, while in the mouse expression is diminished. Expression of the carbohydrate moiety is also found on mature human granulocytes (on CD15) and some monocytes. SSEA-1 is associated with cell adhesion, migration and differentiation. Applications Reported: This eBioMC-480 (MC-480) antibody has been reported for use in flow cytometric analysis. Applications Tested: This eBioMC-480 (MC-480) antibody has been pre-titrated and tested by flow cytometric analysis of the F9 cell line. This can be used at 5 µL (0.125 µg) per test. A test is defined as the amount (µg) of antibody that will stain a cell sample in a final volume of 100 µL. Cell number should be determined empirically but can range from 10^5 to 10^8 cells/test. Excitation: 488-561 nm; Emission: 578 nm; Laser: Blue Laser, Green Laser, Yellow-Green Laser. Filtration: 0.2 µm post-manufacturing filtered.
- Reactivity
- Human, Mouse
- Host
- Mouse
- Conjugate
- Yellow dye
- Isotype
- IgM
- Antibody clone number
- eBioMC-480 (MC-480)
- Vial size
- 100 Tests
- Concentration
- 5 μL/Test
- Storage
- 4°C, store in dark, DO NOT FREEZE!
Submitted references High-throughput screening in postimplantation haploid epiblast stem cells reveals Hs3st3b1 as a modulator for reprogramming.
ECE2 regulates neurogenesis and neuronal migration during human cortical development.
Induced pluripotent stem cells reprogrammed from primary dendritic cells provide an abundant source of immunostimulatory dendritic cells for use in immunotherapy.
STAT3 Inhibition Combined with CpG Immunostimulation Activates Antitumor Immunity to Eradicate Genetically Distinct Castration-Resistant Prostate Cancers.
Comparative glycoproteomics of stem cells identifies new players in ricin toxicity.
A vital sugar code for ricin toxicity.
Noncanonical function of DGCR8 controls mESC exit from pluripotency.
Drug-Mediated Shortening of Action Potentials in LQTS2 Human Induced Pluripotent Stem Cell-Derived Cardiomyocytes.
NANOG alone induces germ cells in primed epiblast in vitro by activation of enhancers.
Generation of embryonic stem cells from mouse adipose-tissue derived cells via somatic cell nuclear transfer.
Generation, expansion, and differentiation of cardiovascular progenitor cells from human pluripotent stem cells.
Coexpression analysis of CD133 and CD44 identifies proneural and mesenchymal subtypes of glioblastoma multiforme.
Parent stem cells can serve as niches for their daughter cells.
Dax1 and Nanog act in parallel to stabilize mouse embryonic stem cells and induced pluripotency.
Distinct and combinatorial functions of Jmjd2b/Kdm4b and Jmjd2c/Kdm4c in mouse embryonic stem cell identity.
Cell reprogramming requires silencing of a core subset of polycomb targets.
ΔNp63 regulates select routes of reprogramming via multiple mechanisms.
Embryonic stem cells require Wnt proteins to prevent differentiation to epiblast stem cells.
Three-dimensional cartography of hematopoietic clusters in the vasculature of whole mouse embryos.
Gao Q, Zhang W, Zhao Y, Tian Y, Wang Y, Zhang J, Geng M, Xu M, Yao C, Wang H, Li L, Liu Y, Shuai L
Stem cells translational medicine 2021 May;10(5):743-755
Stem cells translational medicine 2021 May;10(5):743-755
ECE2 regulates neurogenesis and neuronal migration during human cortical development.
Buchsbaum IY, Kielkowski P, Giorgio G, O'Neill AC, Di Giaimo R, Kyrousi C, Khattak S, Sieber SA, Robertson SP, Cappello S
EMBO reports 2020 May 6;21(5):e48204
EMBO reports 2020 May 6;21(5):e48204
Induced pluripotent stem cells reprogrammed from primary dendritic cells provide an abundant source of immunostimulatory dendritic cells for use in immunotherapy.
Horton C, Davies TJ, Lahiri P, Sachamitr P, Fairchild PJ
Stem cells (Dayton, Ohio) 2020 Jan;38(1):67-79
Stem cells (Dayton, Ohio) 2020 Jan;38(1):67-79
STAT3 Inhibition Combined with CpG Immunostimulation Activates Antitumor Immunity to Eradicate Genetically Distinct Castration-Resistant Prostate Cancers.
Moreira D, Adamus T, Zhao X, Su YL, Zhang Z, White SV, Swiderski P, Lu X, DePinho RA, Pal SK, Kortylewski M
Clinical cancer research : an official journal of the American Association for Cancer Research 2018 Dec 1;24(23):5948-5962
Clinical cancer research : an official journal of the American Association for Cancer Research 2018 Dec 1;24(23):5948-5962
Comparative glycoproteomics of stem cells identifies new players in ricin toxicity.
Stadlmann J, Taubenschmid J, Wenzel D, Gattinger A, Dürnberger G, Dusberger F, Elling U, Mach L, Mechtler K, Penninger JM
Nature 2017 Sep 28;549(7673):538-542
Nature 2017 Sep 28;549(7673):538-542
A vital sugar code for ricin toxicity.
Taubenschmid J, Stadlmann J, Jost M, Klokk TI, Rillahan CD, Leibbrandt A, Mechtler K, Paulson JC, Jude J, Zuber J, Sandvig K, Elling U, Marquardt T, Thiel C, Koerner C, Penninger JM
Cell research 2017 Nov;27(11):1351-1364
Cell research 2017 Nov;27(11):1351-1364
Noncanonical function of DGCR8 controls mESC exit from pluripotency.
Cirera-Salinas D, Yu J, Bodak M, Ngondo RP, Herbert KM, Ciaudo C
The Journal of cell biology 2017 Feb;216(2):355-366
The Journal of cell biology 2017 Feb;216(2):355-366
Drug-Mediated Shortening of Action Potentials in LQTS2 Human Induced Pluripotent Stem Cell-Derived Cardiomyocytes.
Duncan G, Firth K, George V, Hoang MD, Staniforth A, Smith G, Denning C
Stem cells and development 2017 Dec 1;26(23):1695-1705
Stem cells and development 2017 Dec 1;26(23):1695-1705
NANOG alone induces germ cells in primed epiblast in vitro by activation of enhancers.
Murakami K, Günesdogan U, Zylicz JJ, Tang WWC, Sengupta R, Kobayashi T, Kim S, Butler R, Dietmann S, Surani MA
Nature 2016 Jan 21;529(7586):403-407
Nature 2016 Jan 21;529(7586):403-407
Generation of embryonic stem cells from mouse adipose-tissue derived cells via somatic cell nuclear transfer.
Qin Y, Qin J, Zhou C, Li J, Gao WQ
Cell cycle (Georgetown, Tex.) 2015;14(8):1282-90
Cell cycle (Georgetown, Tex.) 2015;14(8):1282-90
Generation, expansion, and differentiation of cardiovascular progenitor cells from human pluripotent stem cells.
Cao N, Liang H, Yang HT
Methods in molecular biology (Clifton, N.J.) 2015;1212:113-25
Methods in molecular biology (Clifton, N.J.) 2015;1212:113-25
Coexpression analysis of CD133 and CD44 identifies proneural and mesenchymal subtypes of glioblastoma multiforme.
Brown DV, Daniel PM, D'Abaco GM, Gogos A, Ng W, Morokoff AP, Mantamadiotis T
Oncotarget 2015 Mar 20;6(8):6267-80
Oncotarget 2015 Mar 20;6(8):6267-80
Parent stem cells can serve as niches for their daughter cells.
Pardo-Saganta A, Tata PR, Law BM, Saez B, Chow RD, Prabhu M, Gridley T, Rajagopal J
Nature 2015 Jul 30;523(7562):597-601
Nature 2015 Jul 30;523(7562):597-601
Dax1 and Nanog act in parallel to stabilize mouse embryonic stem cells and induced pluripotency.
Zhang J, Liu G, Ruan Y, Wang J, Zhao K, Wan Y, Liu B, Zheng H, Peng T, Wu W, He P, Hu FQ, Jian R
Nature communications 2014 Oct 6;5:5042
Nature communications 2014 Oct 6;5:5042
Distinct and combinatorial functions of Jmjd2b/Kdm4b and Jmjd2c/Kdm4c in mouse embryonic stem cell identity.
Das PP, Shao Z, Beyaz S, Apostolou E, Pinello L, De Los Angeles A, O'Brien K, Atsma JM, Fujiwara Y, Nguyen M, Ljuboja D, Guo G, Woo A, Yuan GC, Onder T, Daley G, Hochedlinger K, Kim J, Orkin SH
Molecular cell 2014 Jan 9;53(1):32-48
Molecular cell 2014 Jan 9;53(1):32-48
Cell reprogramming requires silencing of a core subset of polycomb targets.
Fragola G, Germain PL, Laise P, Cuomo A, Blasimme A, Gross F, Signaroldi E, Bucci G, Sommer C, Pruneri G, Mazzarol G, Bonaldi T, Mostoslavsky G, Casola S, Testa G
PLoS genetics 2013;9(2):e1003292
PLoS genetics 2013;9(2):e1003292
ΔNp63 regulates select routes of reprogramming via multiple mechanisms.
Alexandrova EM, Petrenko O, Nemajerova A, Romano RA, Sinha S, Moll UM
Cell death and differentiation 2013 Dec;20(12):1698-708
Cell death and differentiation 2013 Dec;20(12):1698-708
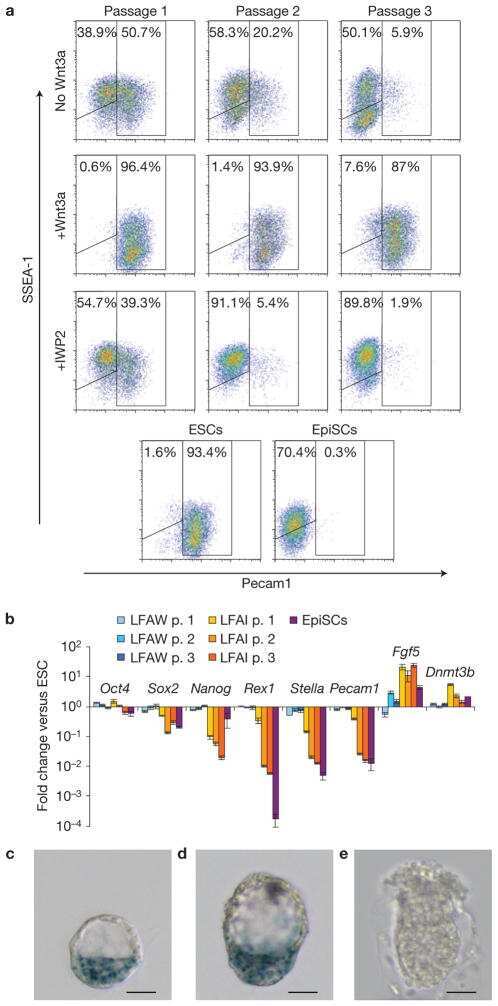
Embryonic stem cells require Wnt proteins to prevent differentiation to epiblast stem cells.
ten Berge D, Kurek D, Blauwkamp T, Koole W, Maas A, Eroglu E, Siu RK, Nusse R
Nature cell biology 2011 Aug 14;13(9):1070-5
Nature cell biology 2011 Aug 14;13(9):1070-5
Three-dimensional cartography of hematopoietic clusters in the vasculature of whole mouse embryos.
Yokomizo T, Dzierzak E
Development (Cambridge, England) 2010 Nov;137(21):3651-61
Development (Cambridge, England) 2010 Nov;137(21):3651-61
No comments: Submit comment
Supportive validation
- Submitted by
- Invitrogen Antibodies (provider)
- Main image

- Experimental details
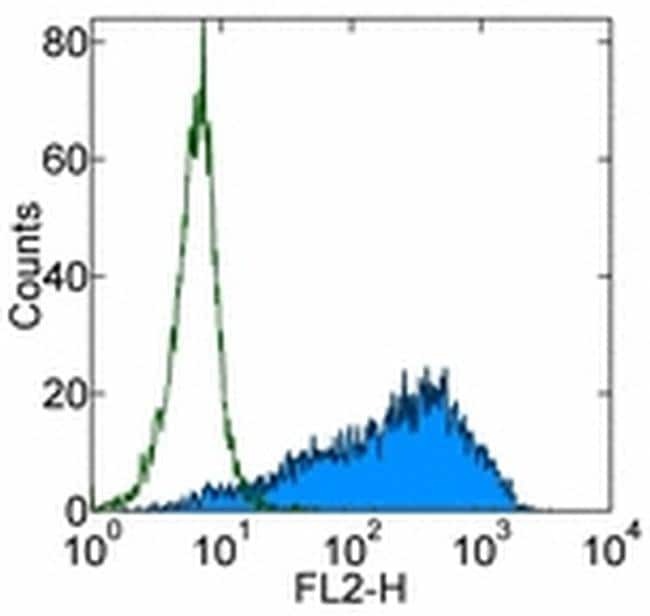
- Staining of the F9 cell line with Mouse IgM Isotype Control PE (Product # 12-4752) (open histogram) or Anti-Human/Mouse SSEA-1 PE (filled histogram). Total viable cells were used for analysis.
- Submitted by
- Invitrogen Antibodies (provider)
- Main image
- Experimental details
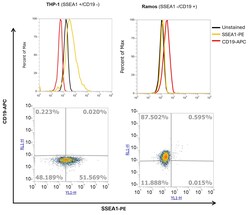
- THP-1 and Ramos cells were fixed and permeabilized using the Intracellular Fixation & Permeabilization Buffer Set (Product # 88-8824-000) and then stained with SSEA1 Monoclonal Antibody (eBioMC-480 (MC-480), PE, eBioscience™ (Product # 12-8813-42) at a concentration of 0.25 µg (yellow histogram) and CD19 Monoclonal Antibody (HIB19), APC, eBioscience™ (Product # 17-0199-42) (red histogram) at a concentration of 1 µg or left unstained (black histogram). CD15 and CD19 were mutually exclusively present on THP-1 and Ramos cells respectively. Viable cells, as determined by Fixable Viability Dye eFluor™ 450 (Product # 65-0863-14) were gated for analysis. The flow cytometry data was acquired using Attune™ NxT Flow Cytometer (Product # A29004).

Supportive validation
- Submitted by
- Invitrogen Antibodies (provider)
- Main image
- Experimental details
- NULL
- Conjugate
- Yellow dye

- Submitted by
- Invitrogen Antibodies (provider)
- Main image
- Experimental details
- NULL
- Conjugate
- Yellow dye

- Submitted by
- Invitrogen Antibodies (provider)
- Main image
- Experimental details
- NULL
- Conjugate
- Yellow dye
- Submitted by
- Invitrogen Antibodies (provider)
- Main image
- Experimental details
- NULL
- Conjugate
- Yellow dye

- Submitted by
- Invitrogen Antibodies (provider)
- Main image
- Experimental details
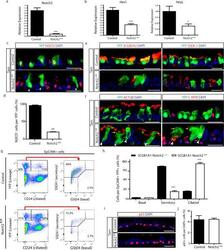
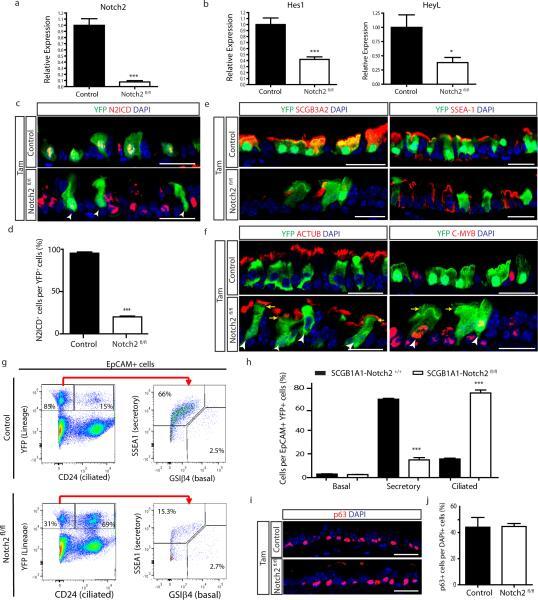
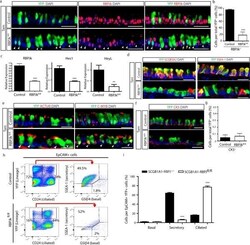
- Extended Data Figure 7 Efficient deletion of Notch2 in secretory progenitor cells and its effect on cell type distribution a, Relative mRNA expression of Notch2 in YFP + cells from Tam-treated SCGB1A1-Notch2 +/+ control mice and Tam-treated SCGB1A1-Notch2 fl/fl experimental mice assessed by qRT-PCR (n=3 mice). b, Relative mRNA expression of the Notch target genes ( Hes1 , HeyL ) in YFP + cells from control mice and Tam-treated SCGB1A1-Notch2 fl/fl experimental mice (n=3 mice). Relative expression is normalized to baseline transcript levels in lineage labeled YFP + control cells. c, Immunostaining for lineage label YFP (green) in combination with N2ICD (red) on control mice (Tam-treated SCGB1A1-Notch2 +/+ ) and experimental airways (Tam-treated SCGB1A1-Notch2 fl/fl ). White arrowheads point to lineage labeled cells that had lost Notch2 and therefore do not show N2ICD expression. d, Quantification of the percentage of N2ICD + cells per total YFP + cells in Tam-treated SCGB1A1-Notch2 fl/fl mice compared to control (n=7 mice). e, Immunostaining for YFP lineage label (green) and the secretory progenitor cell markers SCGB3A2 (left panels) and SSEA-1 (right panels) (red) in control (top panels) and experimental (bottom panels) mice. f, Immunostaining for YFP lineage label (green) and the ciliated cell markers ACTUB (left panels) and C-MYB (right panels) (red) in control (top panels) and experimental (bottom panels) mice. White arrowheads point to lineage labeled secretory cells that
- Conjugate
- Yellow dye
- Submitted by
- Invitrogen Antibodies (provider)
- Main image

- Experimental details
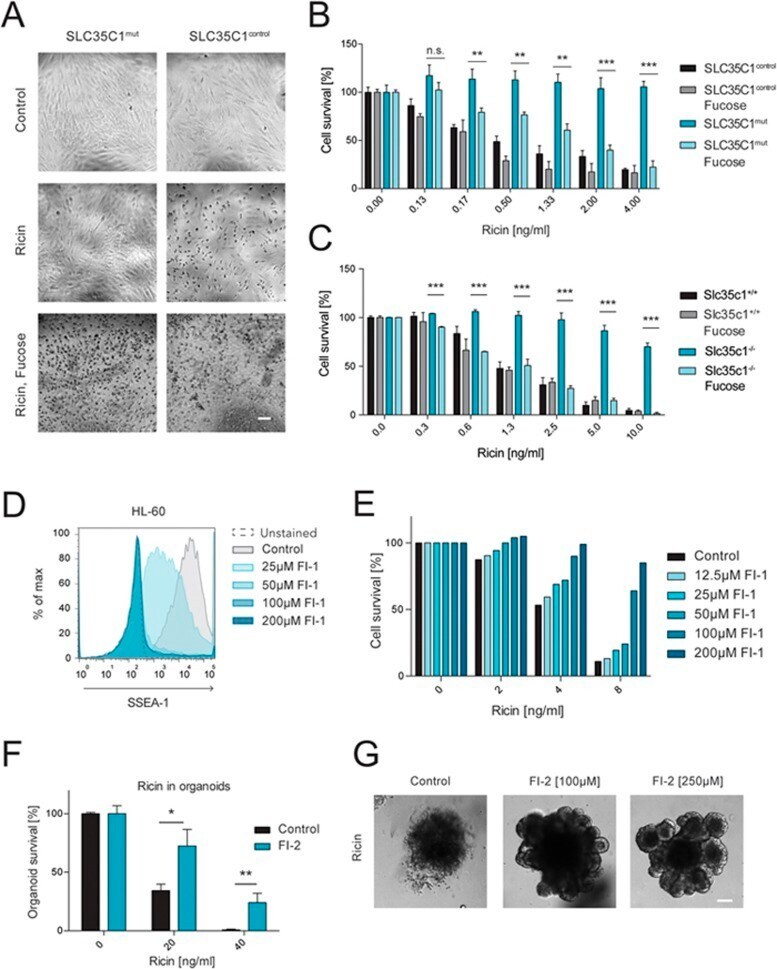
- Figure 3 Loss or inhibition of fucosylation confers ricin resistance. (A) Control ( Slc35c1 control ) as well as mutant ( Slc35c1 mut ) HDFs were treated with ricin (4 ng/ml) and L-fucose (10 mM) for 2 days. Their morphology and structural integrity were monitored by light microscopy. Scale bar, 50 mum. (B) Cell viability of Slc35c1 mut and Slc35c1 control HDFs, supplemented with L-fucose (10 mM) for 24 h and treated with different doses of ricin for 48 h, was determined using Alamar Blue. Data are shown as mean +- SD of triplicate cultures. (C) Toxicity of ricin (after 48-h treatment) in Slc35c1 +/+ and Slc35 -/- MEFs cultured in the presence or absence of fucose (10 mM), was determined by Alamar Blue assay. Data are shown as mean +- SD of triplicate cultures. (D) Human HL-60 cells were treated with the indicated concentrations of the fucosylation inhibitor 2F-peracetyl fucose (FI-1) for 3 days, stained for SSEA-1 (CD15) and analyzed via flow cytometry. Normal SSEA-1 expression in HL-60 cells (control) as well as isotype-matched control cells (unstained) are shown. (E) HL-60 cells were pretreated with different concentrations of FI-1 and then exposed to different doses of ricin. Survival rates were assessed by Alamar Blue. Representative data of three independent experiments are shown. (F) The number of intact, surviving intestinal organoids was determined and the overall survival with and without the fucosylation inhibitor 2-deoxy-2-fluorofucose (FI-2, 250 muM) was assessed
- Conjugate
- Yellow dye
- Submitted by
- Invitrogen Antibodies (provider)
- Main image
- Experimental details
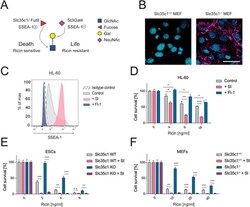
- Figure 5 A vital sugar code for ricin toxicity. (A) Proposed sugar code for ricin toxicity. alpha1,3-fucose residues of Lewis X structures (SSEA-1 (+) ) impair alpha2,3-sialylation of terminal galactoses (i.e., sialyl Lewis X formation, SSEA-1 (-) ), leading to enhanced exposure of terminal galactoses and ricin binding. Absence of fucosylation allows more efficient sialylation of terminal galactoses and thus is assumed to inhibit ricin binding. GlcNAc (N-acetylglucosamine), Gal (Galactose), NeuNAc (N-Acetylneuraminic acid, one type of sialic acid). (B) Slc35c1 mutant and WT MEFs were stained for alpha2,3-sialic acid using MALII and counterstained with DAPI to image nuclei. Scale bar, 50 mum. (C) HL-60 cells were treated with the fucosylation inhibitor 2F-peracetyl fucose (FI-1, 100 muM) or the sialylation inhibitor 3F ax -peracetyl Neu5Ac (SI, 250 muM) for 3 days. The amount of the fucose containing, un-sialylated epitope SSEA-1 (CD15) was determined via flow cytometry. SSEA-1 expression of vehicle-treated cells (control) as well as an isotype-matched control (isotype control) is shown. (D) HL-60 cells were pretreated with inhibitors of fucosylation (FI-1, 100 muM) or sialylation (SI, 250 muM) and exposed to different amounts of ricin thereafter. The survival of the cells was determined using Alamar Blue. Data are representative of three independent experiments. (E , F) Slc35c1 wild type (WT) and mutant (KO) mESCs (E) and MEFs (F) were treated with SI (250 muM) and their sens
- Conjugate
- Yellow dye

- Submitted by
- Invitrogen Antibodies (provider)
- Main image

- Experimental details
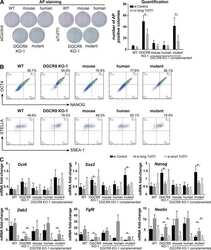
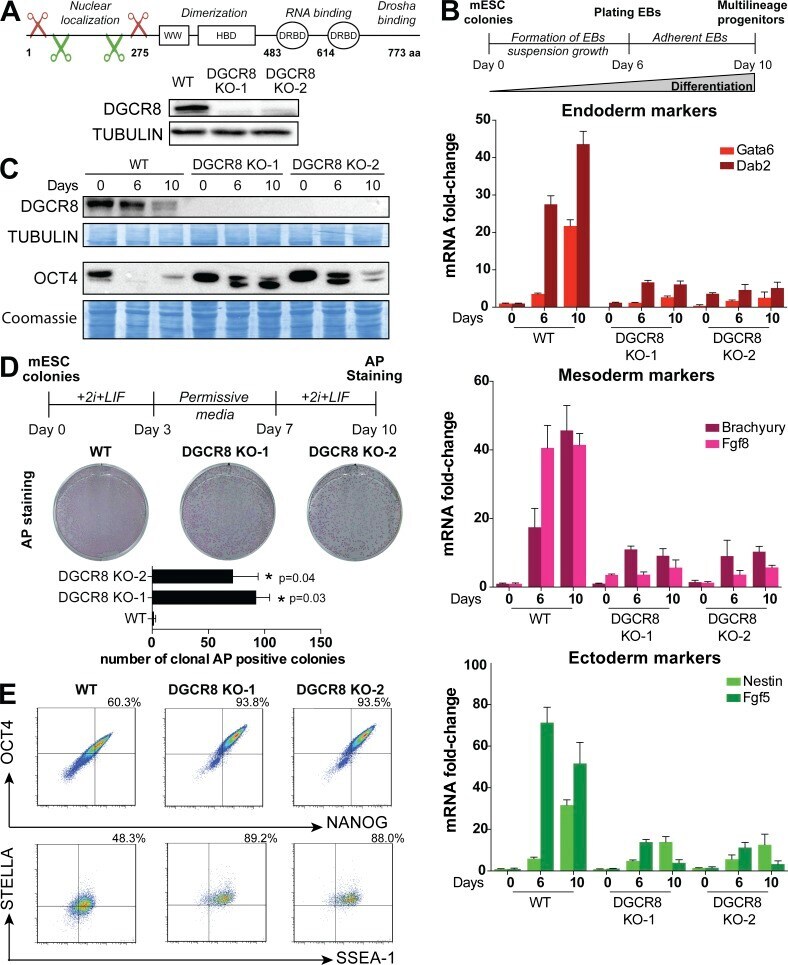
- Figure 1. Differentiation and commitment defects of CRISPR-Cas9-generated Dgcr8 _KO mESCs. (A) Dgcr8 mouse gene CRISPR-Cas9 schematic design. WW corresponds to the Rsp5 domain of the DGCR8 protein, HBD stands for histone binding domain, and DRBD stands for double-stranded RNA binding domain. Immunoblot analysis of DGCR8 in WT and Dgcr8_ KO mESCs. (B) Illustration of the embryoid body (EB) differentiation assay. Quantitative RT-PCR analysis of the differentiation markers (endoderm: Gata6 and Dab2; mesoderm: Brachyury and Fgf8; ectoderm: Nestin and Fgf5) in WT and Dgcr8 _KO mESCs during EB differentiation. The data are shown as the fold change compared with WT cells at day 0 after normalization to the Rrm2 housekeeping gene. Error bars are the mean +- SEM and are representative of three or more experiments. (C) Immunoblot analysis of DGCR8 and the pluripotent marker OCT4 after EB differentiation in WT and Dgcr8_ KO mESCs. Membranes were stained with Coomassie to ensure equal loading. (D) Schematic representation of exit from pluripotency assay. Clonal AP staining of cells after exit from pluripotency assay. AP staining was performed in triplicate, and a representative example is shown. Error bars are the mean +- SEM and are representative of three independent experiments. *, P < 0.05; Student's t test. (E) Flow cytometry analysis of OCT4/NANOG and STELLA/SSEA-1 in WT and Dgcr8 _KO mESCs. Representative plots of three or more experiments are shown.
- Conjugate
- Yellow dye
- Submitted by
- Invitrogen Antibodies (provider)
- Main image
- Experimental details
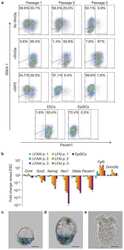
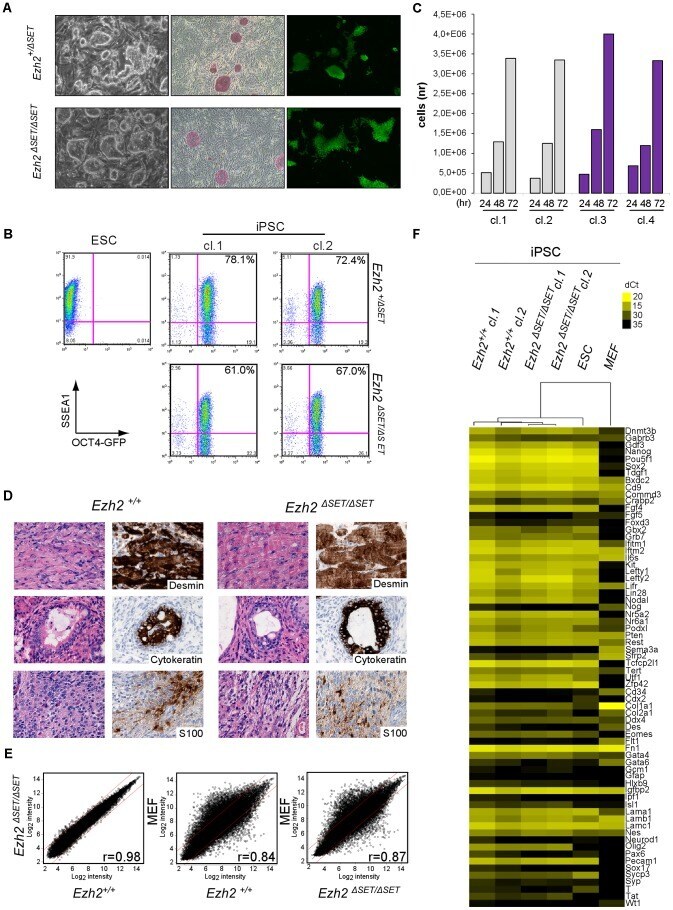
- Figure 2 Characterization of pluripotency in iPSC clones reprogrammed upon Ezh2 inactivation. A. Images of phase contrast (left), alkaline phosphatase staining (middle) and Oct4 -driven GFP fluorescence (right) of representative control ( Ezh2 +/DeltaSET , upper row) and mutant ( Ezh2 DeltaSET/DeltaSET , lower row) iPSC colonies. B. Flow cytometric analysis of SSEA-1 and endogenous OCT4 (OCT4-GFP) levels in representative control ( Ezh2 +/DeltaSET , upper row) and mutant ( Ezh2 DeltaSET/DeltaSET , lower row) iPSC clones (cl.1 and cl.2). Embryonic stem cells (ESC) were used as positive control for SSEA1 expression (upper left). C. Growth curve of representative control ( Ezh +/+ , grey) and mutant ( Ezh2 DeltaSET/DeltaSET , purple) iPSC clones cultured in 2i/LIF medium for the indicated hours. Column height represents cell number. D. Hematoxylin & eosin staining and immunohistochemical analysis of representative sections of teratomas generated from either Ezh2 control ( Ezh2 +/+ ) or mutant ( Ezh2 DeltaSET/DeltaSET ) iPSC cells of two representative clones. Stainings for mesoderm (upper row), endoderm (middle row) and ectoderm (lower row) markers are displayed. Data displayed in A, B, C and D are representative of at least four independent experiments, using two iPSC clones per genotype. E. Scatter plots showing global gene expression correlation analyses between Ezh2 +/+ and Ezh2 DeltaSET/DeltaSET iPSC (left panel), Ezh2 +/+ iPSCs and MEF (central panel) and Ezh2 DeltaSET/Del
- Conjugate
- Yellow dye
- Submitted by
- Invitrogen Antibodies (provider)
- Main image
- Experimental details
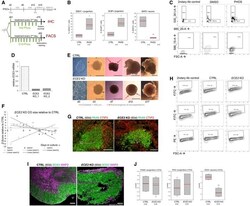
- Figure EV3 ECE 2 inhibition and KO cause change in cell fate in CO s Scheme depicting the timeline of chronic PHOS treatment in COs prior to IHC or FACS analysis (hES, NIM, NDM-/+A: media for CO generation, see Materials and Methods ). FACS analysis of PHOS-treated COs shows an increase in neural progenitors and a decrease in neurons. Data shown as z -scores ( n = samples of three pooled COs each; box plots: mean = red line, median = black line, box represents 25 th and 75 th percentiles, whiskers extend to 10 th and 90 th percentiles, all outliers are shown; * P < 0.05 ; **P < 0.01 in one-way ANOVA and Tukey''s pairwise multiple comparison). FACS plots illustrating gating strategies for SSEA-, BLBP- and MAP2-gated cells in CTRL- and PHOS-treated COs. Gates were established using secondary antibody only as isotype control. qPCR confirms the absence of ECE2 mRNA in two clones of ECE2 KO iPSCs (data shown as mean +- SEM from triplicates). Brightfield (BF) images of ECE2 KO and isogenic control iPSCs and of COs generated from them. Size measurement ECE2 KO vs. CTRL COs revealed no consistent difference (data shown as z -scores; n = 4 batches of COs with at least 10 COs each per time point, area measured from 2D BF images in Fiji 82 ). Example images of IHC for PAX6 + dorsal neural progenitors (green) and CTIP2 + deep layer neurons (red) in CTRL and ECE2 KO COs. FACS plots illustrating the gating strategies for PAX6-, PH3- and MAP2-gated cells in 60-day-old CTRL and ECE2 KO COs.
- Conjugate
- Yellow dye

- Submitted by
- Invitrogen Antibodies (provider)
- Main image

- Experimental details
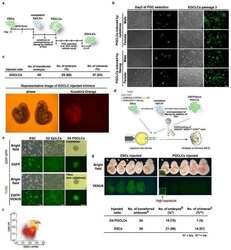
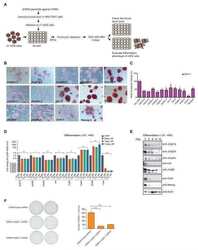
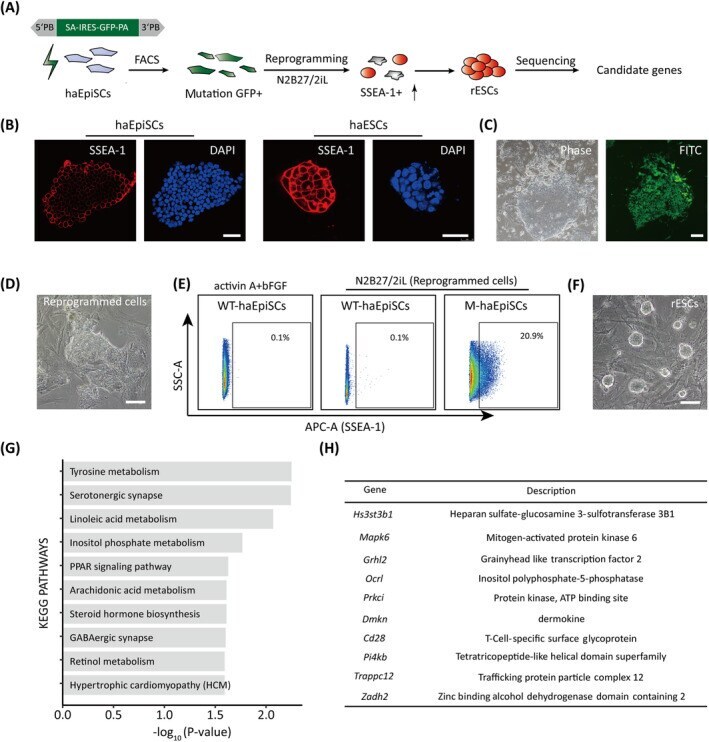
- FIGURE 4 Forward genetic screening for reprogramming in haEpiSCs. A, Schematic view of the genetic screen in haEpiSCs by PB-based gene trap vectors. B, Immunofluorescence of SSEA-1 of haEpiSCs and haESCs. DNA was stained with DAPI. Scale bar = 50 mum. C, Bright-field and FITC images of haEpiSCs after transfection. Scale bar = 100 mum. D, Morphology of reprogrammed cells in N2B27/2iL medium. Scale bar = 100 mum. E, Percentage of SSEA-1 positive cells in mutant haEpiSCs (M-haEpiSCs) and WT-haEpiSCs cultured in N2B27/2iL medium. WT-haEpiSCs cultured in activin A + bFGF medium were used as a negative control. F, Morphology of rESCs derived from mutant haEpiSCs. Scale bar = 100 mum. G, KEGG analysis of the top 100 genes with the most frequent insertions. H, List of the top 10 genes with the most insertion sites
- Conjugate
- Yellow dye
- Submitted by
- Invitrogen Antibodies (provider)
- Main image
- Experimental details
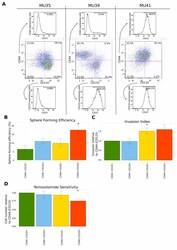
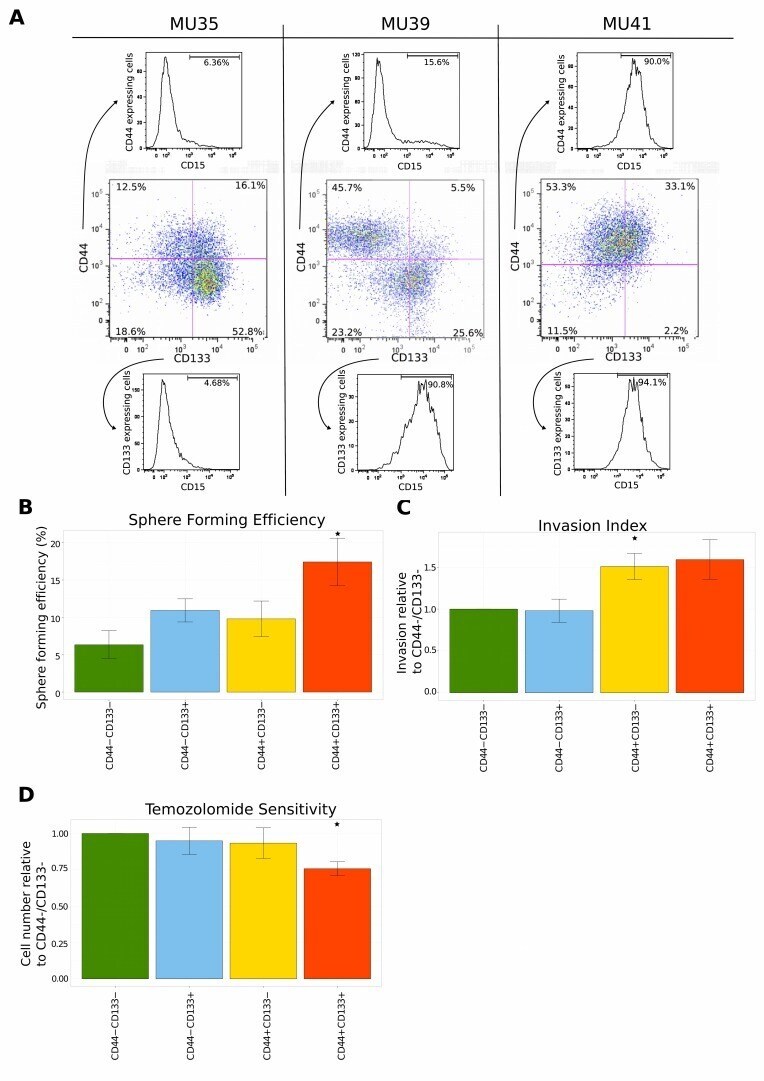
- Figure 4 Functional validation of the coexpression module and pathway analysis (A) FACS analysis of the expression of surface protein markers using a panel of GSPCs. Cells were labeled with CD15, CD44 and CD133 antibodies. Expression of CD44 and CD133 is represented in the center panel. The expression of CD15 is shown separately for CD44+ cells (top) and CD133+ cells (bottom). (B) Repopulation ability is highest for CD44/CD133 double positive GSPCs. Limiting dilutions of cells ranging from 50 to 1 cell per well were sorted into plates and scored for sphere formation after 7 days. Sphere forming efficiency was estimated by ELDA. Error bars represent sem of three independent GSPC lines. (C) CD44 expressing GSPCs are a more invasive subpopulation. The surface area of the sorted GSPCs was quantified 7 days after the administration of extracellular matrix. Mean invasion is represented relative to the CD44-/CD133- subpopulation. Error bars represent sem of five independent GSPC lines. (D) Temozolomide sensitivity of sorted GSPCs was measured 7 days after sorting. 50muM of temozolomide was applied daily. Mean temozolomide sensitivity is presented relative to the CD44-/CD133- subpopulation. Error bars represent sem of five independent GSPC lines.
- Conjugate
- Yellow dye
- Submitted by
- Invitrogen Antibodies (provider)
- Main image
- Experimental details
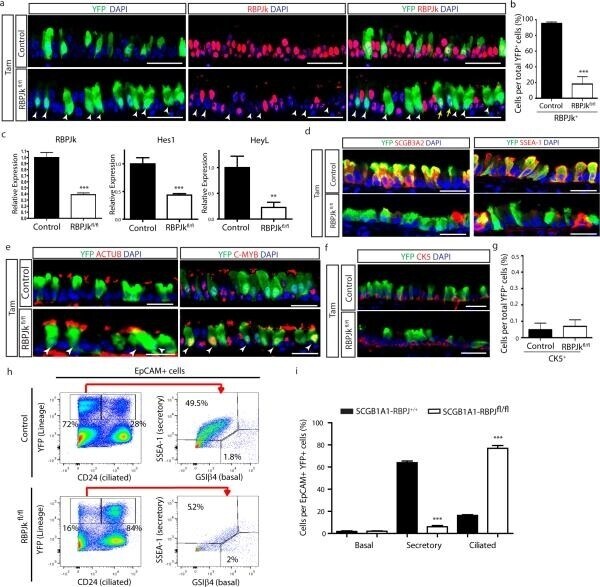
- Extended Data Figure 5 Downregulation of Notch signaling transduction following RBPJk deletion in secretory progenitor cells induces their conversion into ciliated cells a, Immunostaining for lineage labeled YFP + cells (green) in combination with RBPJk (red) in Tam-treated SCGB1A1-RBPJk fl/+ control mice (upper panels) and Tam-treated SCGB1A1-RBPJk fl/fl mice (lower panels). White arrowheads point to lineage labeled RBPJk - cells. The yellow arrows point to lineage labeled cells that have not undergone recombination. b, Quantification of the percentage of RBPJk + cells per total YFP + cells at experimental day 15 following tamoxifen administration to SCGB1A1-RBPJk fl/+ control (black bar) and SCGB1A1-RBPJk fl/fl mice (white bar) (n=6 mice). c, Relative mRNA expression of Notch signaling component genes (RBPJk, Hes1, HeyL) analyzed by qRT-PCR in sorted YFP + cells from Tam-treated SCGB1A1-RBPJk +/+ control mice (black bars) (n=3 mice) and Tam-treated SCGB1A1-RBPJk fl/fl mice (white bars) (n=4 mice). Relative expression is normalized to baseline transcript levels in YFP + control cells. d, Immunostaining for YFP lineage label (green) and the secretory progenitor cell markers SCGB3A2 (left panels) and SSEA-1 (right panels) (red) in Tam-treated SCGB1A1-RBPJk fl/+ mice (control) (top panels) and SCGB1A1-RBPJk fl/fl mice (bottom panels). e, Immunostaining for YFP lineage label (green) and the ciliated cell markers ACTUB (left panels) and C-MYB (right panels) (red) in Tam-treated S
- Conjugate
- Yellow dye
- Submitted by
- Invitrogen Antibodies (provider)
- Main image
- Experimental details
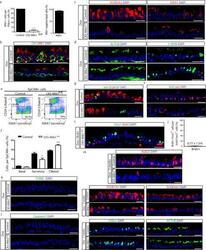
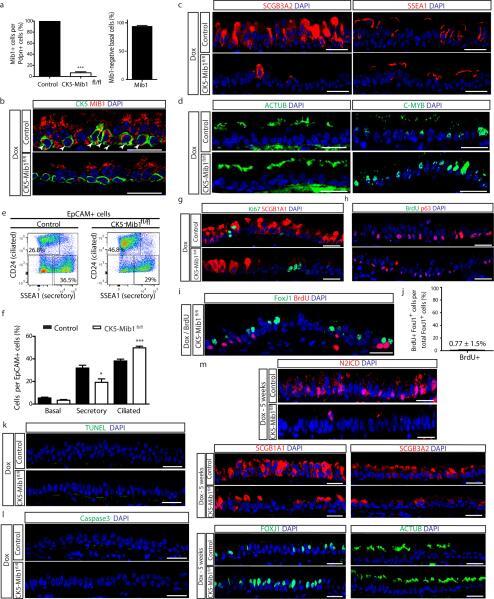
- Extended Data Figure 9 Loss of Notch ligands in basal stem cells promotes secretory cell differentiation into ciliated cells without affecting proliferation or apoptosis a, Quantification of the percentage of basal PDPN + cells that express Mib1 (left graph) on either Dox-treated CK5-Mib1 +/+ control mice or Dox-treated CK5-Mib1 fl/fl mice (n=4 mice). Right graph, percentage of basal cells in which Mib1 was deleted in Dox-treated CK5-Mib1 fl/fl mice (n=4 mice). b, Immunostaining for Mib1 (red) and the basal cell marker CK5 (green). White arrowheads point to Mib1 + basal cells. c, Immunostaining for the secretory cell markers SCGB3A2 (left panels) and SSEA-1 (right panels) (red) in control (top panels) and experimental (bottom panels) mice. d, Immunostaining for the ciliated cell markers ACTUB (left panels) and C-MYB (right panels) (green) in control (top panels) and experimental (bottom panels) mice. e, Flow cytometry analysis of EpCAM + CD24 + ciliated cells and EpCAM + SSEA-1 + secretory cells from control and experimental mice. f, Percentage of epithelial (EpCAM + ) basal, secretory and ciliated cells on both groups by flow cytometry (n=3 mice). g, Immunostaining for Ki67 (green) and the secretory cell marker SCGB1A1 (red) on control (top panel) or Dox-treated CK5-Mib1 fl/fl mice (bottom panel). h, Immunostaining for BrdU (green) in combination with the basal cell transcription factor p63 (red) on both groups. i, Immunostaining for FOXJ1 (green) and BrdU (red) on Dox-treat
- Conjugate
- Yellow dye
- Submitted by
- Invitrogen Antibodies (provider)
- Main image
- Experimental details
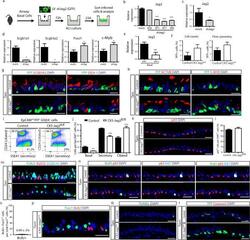
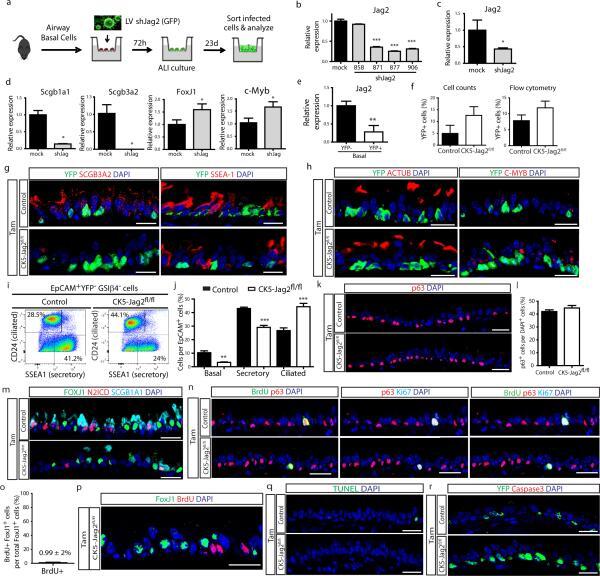
- Extended Data Figure 10 Disruption ofDisruption of Jag2 in basal stem/progenitor cells causes the differentiation of secretory progenitor cells into ciliated cells without affecting proliferation or apoptosis a, Schematic representation of Jag2 inhibition using lentiviruses (LV) carrying shRNAs. Infected GFP + cells were cultured in an air-liquid interface (ALI) culture system for 23d, when they were harvested, sorted and analyzed. b, Relative mRNA expression of Jag2 in tracheal epithelial cells infected with mock vector (control) or with vectors carrying 4 different shRNAs targeting Jag2 72h after infection. c, Relative mRNA expression of Jag2 in tracheal epithelial basal cells infected with mock vector (control) or with lentivirus targeting Jag2 (shJag2 877) after 23d in ALI. d, Relative mRNA expression of the secretory genes ( Scgb1a1 and Scgb3a2 ) and the ciliated cell genes ( FoxJ1 and c-Myb ) in mock (black bars) and shJag2 877 (grey bars) infected cells 23d after ALI initiation. Relative expression is normalized to baseline transcript levels in mock infected cells. e, Relative mRNA expression of Jag2 on sorted recombined (YFP + ) basal cells and unrecombined YFP - basal cells from Tam-treated CK5-Jag2 fl/fl mice (n=3 mice). Relative expression is normalized to baseline transcript levels in YFP - cells. f, Percentage of YFP + cells per total DAPI + cells (efficiency of recombination) on either Tam-treated CK5-Jag2 +/+ control (black bars) or Tam-treated CK5-Jag2 fl/fl (
- Conjugate
- Yellow dye
- Submitted by
- Invitrogen Antibodies (provider)
- Main image
- Experimental details
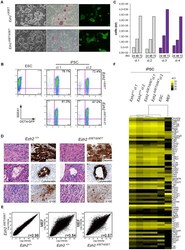
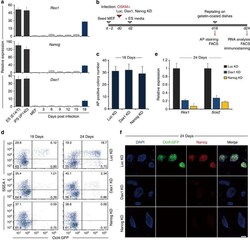
- Figure 8 Dax1 and Nanog are both required for full reprogramming to induce pluripotency. ( a ) qRT-PCR analysis of the endogenous Rex1 , Nanog and Dax1 mRNA expressions during the course of reprogramming. All data are normalized to Gapdh and shown relative to the mean of MEFs (set at 1.0). Data are means+-s.d.; n =3. ( b ) Scheme and strategy for functional studies of Dax1 and Nanog in reprogramming. ( c ) Oct4-GFP MEFs were infected with the TetO-4F2A encoding Oct4, Sox2, Klf4 and c-Myc (OSKM) and M2rtTA lentiviruses in combination with luciferase shRNA (Luc KD), Dax1 shRNA (Dax1 KD) or Nanog shRNA (Nanog KD) lentivirus. The number of AP + colonies was counted 18 days after induction. Data are means+-s.d.; n =3. ( d ) Flow cytometric analysis of Oct4-GFP reporter activity and SSEA-1 expression in the respective lentiviral-infected Oct4-GFP MEF-derived cells 18 and 24 days after induction. Numbers in quadrants indicate the percentage of each population. ( e ) qRT-PCR analysis of the endogenous Sox2 and Rex1 mRNA expression in the respective lentiviral-infected Oct4-GFP MEF-derived cells 24 days after induction. All data are normalized to Gapdh and shown relative to the mean of OSKM+Luc KD cells (set at 1.0). Data are means+-s.d.; n =3. ( f ) Immunofluorescence analysis of Oct4-GFP (green) and Nanog (red) in the indicated lentiviral-infected Oct4-GFP MEF-derived cells 24 days after induction. Cells were counterstained with DAPI (blue). Scale bar, 50 mum. d
- Conjugate
- Yellow dye
