Explore
 Validate
 Learn
Learn Flow cytometry
Antibody data
- Antibody Data
- Antigen structure
- References [10]
- Comments [0]
- Validations
- Flow cytometry [1]
- Other assay [13]
Submit
Validation data
Reference
Comment
Report error
- Product number
- 69-0209-41 - Provider product page

- Provider
- Invitrogen Antibodies
- Product name
- CD20 Monoclonal Antibody (2H7), eFluor™ 506, eBioscience™
- Antibody type
- Monoclonal
- Antigen
- Other
- Description
- Description: The 2H7 monoclonal antibody reacts with human CD20, a 33-36 kDa transmembrane protein. CD20 is expressed by developing B cells as well as mature B cells but not plasma cells. CD20 has been detected at low levels on a small subset of mature T cells. It is suggested that CD20 plays a role in B-cell activation. Applications Reported: This 2H7 antibody has been reported for use in flow cytometric analysis. Applications Tested: This 2H7 antibody has been pre-titrated and tested by flow cytometric analysis of normal human peripheral blood cells. This can be used at 5 µL (0.5 µg) per test. A test is defined as the amount (µg) of antibody that will stain a cell sample in a final volume of 100 µL. Cell number should be determined empirically but can range from 10^5 to 10^8 cells/test. eFluor® 506 can be excited with the violet laser line (405 nm) and emits at 506 nm. We recommend using a 510/20 band pass filter, or equivalent. Please make sure that your instrument is capable of detecting this fluorochrome. Excitation: 405 nm; Emission: 506 nm; Laser: Violet Laser. Filtration: 0.2 µm post-manufacturing filtered.
- Reactivity
- Human
- Host
- Mouse
- Isotype
- IgG
- Antibody clone number
- 2H7
- Vial size
- 25 Tests
- Concentration
- 5 µL/Test
- Storage
- 4° C, store in dark, DO NOT FREEZE!
Submitted references TRPA1 triggers hyperalgesia and inflammation after tooth bleaching.
IL-33 Alarmin and Its Active Proinflammatory Fragments Are Released in Small Intestine in Celiac Disease.
Genetic modification of primary human B cells to model high-grade lymphoma.
Relative safety of various spermatogenic stem cell purification methods for application in spermatogenic stem cell transplantation.
Evidence for persistence of the SHIV reservoir early after MHC haploidentical hematopoietic stem cell transplantation.
Tumor-associated B-cells induce tumor heterogeneity and therapy resistance.
Sexual Differences in Cell Loss during the Post-Hatch Development of Song Control Nuclei in the Bengalese Finch.
Phase I study of a bispecific ligand-directed toxin targeting CD22 and CD19 (DT2219) for refractory B-cell malignancies.
Transcriptional profiling of mRNAs and microRNAs in human bone marrow precursor B cells identifies subset- and age-specific variations.
An efficient low cost method for gene transfer to T lymphocytes.
Chen C, Huang X, Zhu W, Ding C, Huang P, Li R
Scientific reports 2021 Aug 31;11(1):17418
Scientific reports 2021 Aug 31;11(1):17418
IL-33 Alarmin and Its Active Proinflammatory Fragments Are Released in Small Intestine in Celiac Disease.
Perez F, Ruera CN, Miculan E, Carasi P, Dubois-Camacho K, Garbi L, Guzman L, Hermoso MA, Chirdo FG
Frontiers in immunology 2020;11:581445
Frontiers in immunology 2020;11:581445
Genetic modification of primary human B cells to model high-grade lymphoma.
Caeser R, Di Re M, Krupka JA, Gao J, Lara-Chica M, Dias JML, Cooke SL, Fenner R, Usheva Z, Runge HFP, Beer PA, Eldaly H, Pak HK, Park CS, Vassiliou GS, Huntly BJP, Mupo A, Bashford-Rogers RJM, Hodson DJ
Nature communications 2019 Oct 4;10(1):4543
Nature communications 2019 Oct 4;10(1):4543
Relative safety of various spermatogenic stem cell purification methods for application in spermatogenic stem cell transplantation.
Tian J, Ma K, Pei CB, Zhang SH, Li X, Zhou Y, Yan B, Wang HY, Ma LH
Stem cell research & therapy 2019 Dec 16;10(1):382
Stem cell research & therapy 2019 Dec 16;10(1):382
Evidence for persistence of the SHIV reservoir early after MHC haploidentical hematopoietic stem cell transplantation.
Colonna L, Peterson CW, Schell JB, Carlson JM, Tkachev V, Brown M, Yu A, Reddy S, Obenza WM, Nelson V, Polacino PS, Mack H, Hu SL, Zeleski K, Hoffman M, Olvera J, Furlan SN, Zheng H, Taraseviciute A, Hunt DJ, Betz K, Lane JF, Vogel K, Hotchkiss CE, Moats C, Baldessari A, Murnane RD, English C, Astley CA, Wangari S, Agricola B, Ahrens J, Iwayama N, May A, Stensland L, Huang MW, Jerome KR, Kiem HP, Kean LS
Nature communications 2018 Oct 25;9(1):4438
Nature communications 2018 Oct 25;9(1):4438
Tumor-associated B-cells induce tumor heterogeneity and therapy resistance.
Somasundaram R, Zhang G, Fukunaga-Kalabis M, Perego M, Krepler C, Xu X, Wagner C, Hristova D, Zhang J, Tian T, Wei Z, Liu Q, Garg K, Griss J, Hards R, Maurer M, Hafner C, Mayerhöfer M, Karanikas G, Jalili A, Bauer-Pohl V, Weihsengruber F, Rappersberger K, Koller J, Lang R, Hudgens C, Chen G, Tetzlaff M, Wu L, Frederick DT, Scolyer RA, Long GV, Damle M, Ellingsworth C, Grinman L, Choi H, Gavin BJ, Dunagin M, Raj A, Scholler N, Gross L, Beqiri M, Bennett K, Watson I, Schaider H, Davies MA, Wargo J, Czerniecki BJ, Schuchter L, Herlyn D, Flaherty K, Herlyn M, Wagner SN
Nature communications 2017 Sep 19;8(1):607
Nature communications 2017 Sep 19;8(1):607
Sexual Differences in Cell Loss during the Post-Hatch Development of Song Control Nuclei in the Bengalese Finch.
Chen X, Li J, Zeng L, Zhang X, Lu X, Zuo M, Zhang X, Zeng S
PloS one 2015;10(5):e0125802
PloS one 2015;10(5):e0125802
Phase I study of a bispecific ligand-directed toxin targeting CD22 and CD19 (DT2219) for refractory B-cell malignancies.
Bachanova V, Frankel AE, Cao Q, Lewis D, Grzywacz B, Verneris MR, Ustun C, Lazaryan A, McClune B, Warlick ED, Kantarjian H, Weisdorf DJ, Miller JS, Vallera DA
Clinical cancer research : an official journal of the American Association for Cancer Research 2015 Mar 15;21(6):1267-72
Clinical cancer research : an official journal of the American Association for Cancer Research 2015 Mar 15;21(6):1267-72
Transcriptional profiling of mRNAs and microRNAs in human bone marrow precursor B cells identifies subset- and age-specific variations.
Jensen K, Brusletto BS, Aass HC, Olstad OK, Kierulf P, Gautvik KM
PloS one 2013;8(7):e70721
PloS one 2013;8(7):e70721
An efficient low cost method for gene transfer to T lymphocytes.
Chicaybam L, Sodre AL, Curzio BA, Bonamino MH
PloS one 2013;8(3):e60298
PloS one 2013;8(3):e60298
No comments: Submit comment
Supportive validation
- Submitted by
- Invitrogen Antibodies (provider)
- Main image

- Experimental details
- Staining of normal human peripheral blood cells with Anti-Human CD3 APC (Product # 17-0036-42) and Anti-Human CD20 eFluor® 506. Cells in the lymphocyte gate were used for analysis.

Supportive validation
- Submitted by
- Invitrogen Antibodies (provider)
- Main image
- Experimental details
- NULL

- Submitted by
- Invitrogen Antibodies (provider)
- Main image
- Experimental details
- NULL
- Submitted by
- Invitrogen Antibodies (provider)
- Main image
- Experimental details
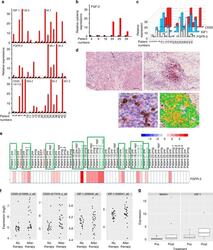
- Fig. 7 Increased expression of IGF-1, FGFR-3, its ligand FGF-2 and CD20 in tumor tissue obtained on treatment with BRAF and MEK inhibitors. a , b Tumor tissue from melanoma patients ( n = 20) after kinase inhibitor therapies ( red bars ) show increased transcript levels of IGF-1, FGFR-3, CD20, and FGF-2 b when compared with same patients' pre-treatment tumor tissues ( black bars ). mRNA transcripts were determined by real time qPCR (as described in Fig. 1 legend) with levels indicated as RQ values normalized to an endogenous control (GAPDH) and relative to pre-treatment cDNA samples. c Transcript levels of IGF-1, FGFR-3, and CD20 of melanoma patients' cDNA samples on treatment showed a correlation with each other (IGF-1 and FGFR-3 (Spearman's r = 0.6936; p = 0.0376); IGF-1 and CD20 (Spearman's r = 0.5074; p = 0.0020)). d Increased presence of CD20 + B cells co-stained with IGF-1 in tumor sections obtained from patients undergoing treatment with kinase inhibitors. Representative immunostaining of a patient's tumor section pre- ( left top panel ) and on-therapy ( bottom left panel ) with BRAFi/MEKi showing co-staining of IGF-1 ( red ) and CD20 ( dark brown ). Magnified view of the co-staining is shown on top right panel and multi-spectral analysis confirming the co-localization of IGF-1 and CD20+ B cells is shown in bottom right panel ( yellow ). Scale bars : 100 mum. e Increased RNA expression of FGFR-3 in 8/21 progression biopsies ( green frame ) obta

- Submitted by
- Invitrogen Antibodies (provider)
- Main image

- Experimental details
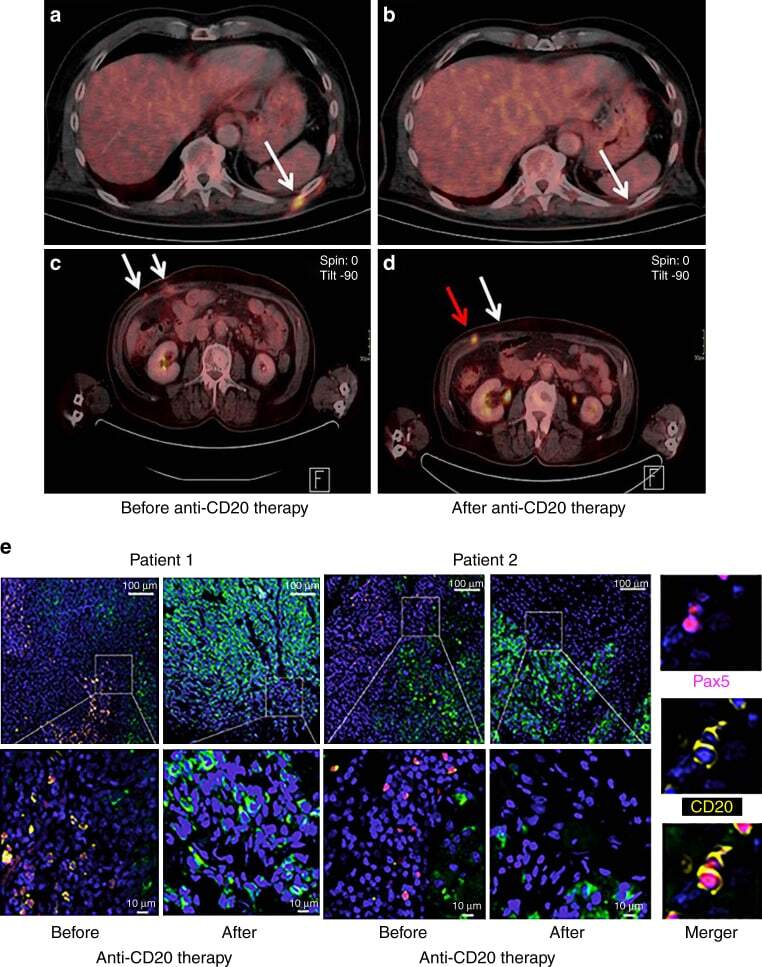
- Fig. 8 Clinical activity of CD20 immunotargeting in metastatic melanoma patients. PET-CT scans from two different patients obtained pre- vs. post-anti-CD20 antibody therapy. a , b Note complete disappearance of a metabolically active metastatic site ( white arrow ); c , d mixed response with almost complete disappearance of one metabolically active metastatic site ( white arrow in d ) and simultaneous increase in size and metabolic activity of the other ( red arrow in d ). e Representative combined PAX5 (nuclear; purple )/CD20 (membrane; yellow ) immunofluoresence staining of patient-matched melanoma samples before and after therapy with anti-CD20 antibody (overviews ( top rows ; scale bars : 100 mum) and corresponding close ups ( bottom rows ; scale bars : 10 mum)). Note depletion of TAB cells in post-therapy tumors. CSPG staining of melanoma cells ( green ) and nuclear DAPI staining ( blue ). Right panel : double positive PAX5 (nuclear)/CD20 (membrane) immunofluoresent TAB cells
- Submitted by
- Invitrogen Antibodies (provider)
- Main image
- Experimental details
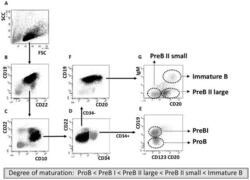
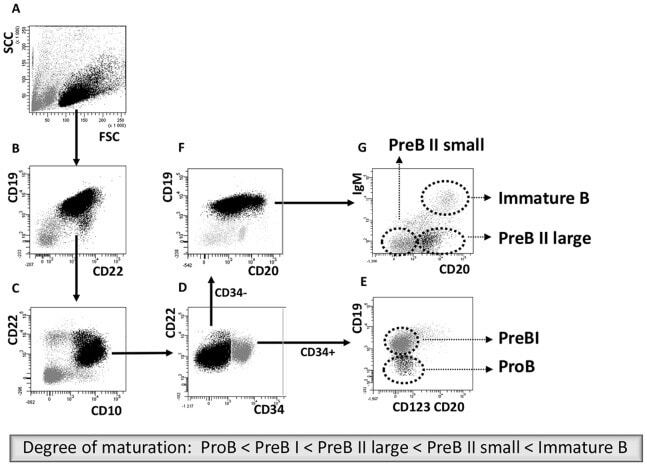
- Figure 1 Cell sorting of precursor B cells subsets from CD10 positively selected cells. Immunomagnetic selection and subsequent FACS were used to isolate the five populations from pediatric and adult human BM. Shown are the FACS dot plots with sorting gates to obtain CD34 + CD19 - ProB cells, CD34 + CD19 + PreBI cells, CD34 - CD19 + CD20 dim PreBII large cells, CD34 - CD19 + CD20 - PreBII small cells, and CD34 - CD19 + CD20 high IgM + Immature B cells.
- Submitted by
- Invitrogen Antibodies (provider)
- Main image

- Experimental details
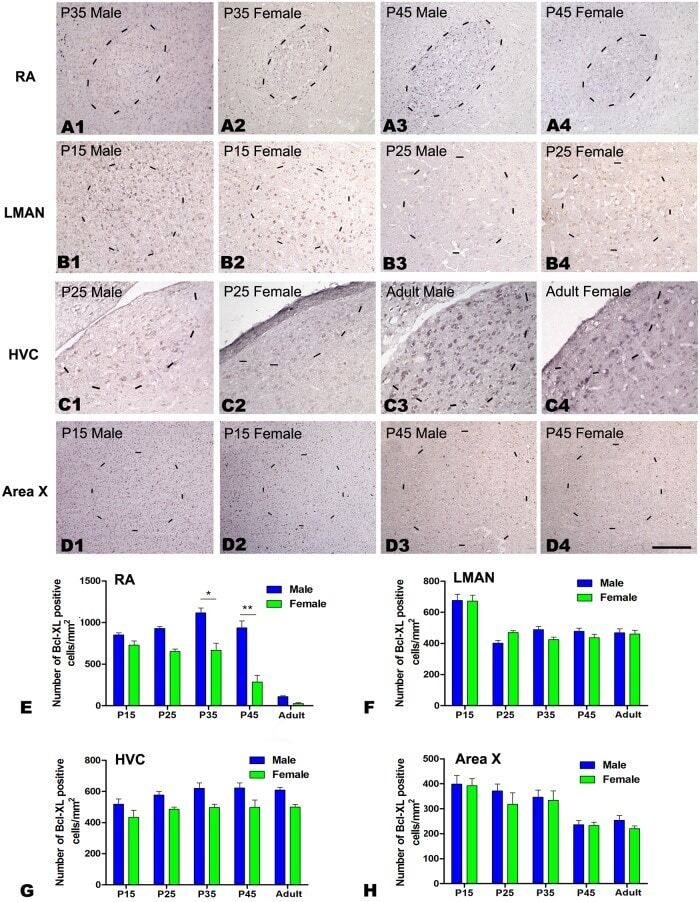
- Fig 5 Immunohistochemistry for Bcl-xL in the RA, LMAN, HVC and Area X of the Bengalese finch (visualized by nickel intensified DAB). A1-D4: Labeled cells in the RA at post-hatching day (P) 35 (A1, A2) and P45 (A3-A4), in the LMAN at P15 (B1, B2) and P45 (B3, B4), in the HVC at P45 (C1, C2) and in the adult (C3, C4), and in Area X at P15 (D1, D2) and P45 (D3, D4). E-H: Comparison of the densities of Bcl-xL-positive cells in the RA (E), LMAN (F), HVC (G) and Area X (H) between males and females. The borders of the song nuclei (dashed lines) were determined with the help of another set of Nissl-stained sections. The Nissl-defined border of the female Area X was difficult to clearly identify, and the dashed lines in D2 and D4 indicate the approximate region corresponding to the male Area X. Dorsal is up and caudal is right. Scale bar = 200 mum in A1-C4 and 300 mum in D1-D4. The data are expressed as the mean +- SEM. * P < 0.05, ** P < 0.01.
- Submitted by
- Invitrogen Antibodies (provider)
- Main image
- Experimental details
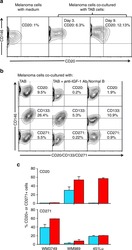
- Fig. 4 IGF-1-dependent induction of cancer stem cell markers CD20, CD133, and CD271 (NGFR) on melanoma cells. a Melanoma cells (WM3749) co-cultured with TAB cells (days 3 and 9) show high expression of CD20 ( middle and right panels ) compared with the control culture ( left panel ) as determined by FACS analysis. Melanoma cells were co-stained with anti-CD146 (MCAM, PE-conjugated) and anti-CD20 (FITC-conjugated) antibodies to distinguish them from B cells, which are CD146-negative;percentages indicate co-expression of both markers on the malignant cells. b Melanoma cells (WM3749) co-cultured with TAB cells (day 6) show high expression of CD20, CD133 and CD271 ( left panel ) compared with minimal or low expression of those markers when tumor cells are co-cultured with NB cells ( right panel ). Co-culture of melanoma cells with TAB cells did not modulate the expression of CD144 (vascular-endothelial cadherin marker) that are normally expressed by aggressive melanomas (data not shown). Induction of CD20, CD133, and CD271 was blocked when anti-IGF-1 neutralizing antibody (10 mug/ml) was used in the co-culture ( middle panel ). Anti-IL-1, anti-PDGF or anti-VEGF antibodies had no effect on CD marker expression (data not shown). Percentages indicate co-expression of CD20, CD133, or CD271on CD146 + melanoma cells. Results are representative of two independent experiments. c Melanoma cells(WM3749, WM989 and 451Lu) cultured in the presence of recombinant IGF-1 (25 ng/ml) for 5 days sh

- Submitted by
- Invitrogen Antibodies (provider)
- Main image
- Experimental details
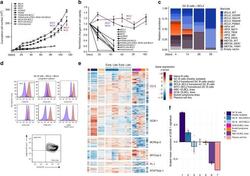
- Fig. 2 Long-term expansion of human germinal center B cells ex vivo. a Primary human GC B cells were transduced with the indicated oncogenes and oncogene combinations and cultured separately for up to 120 days. Graph shows calculated theoretical absolute cell numbers (+-s.e.m., n = 3). Viable cells were assessed by trypan blue exclusion. Source data are provided as a Source Data file. b Primary human GC B cells were transduced with different oncogenes and oncogene combinations and monitored by flow cytometry. Graph shows the change in cell viability assessed by scatter characteristic by flow cytometry ( +- s.e.m., n = 3). Source data are provided as a Source Data file. c Primary human GC B cells were transduced with BCL2 in combination with other transcription factors in a pooled, competitive culture. Graph shows relative abundance of transcription factors or their mutant versions over four different timepoints ( n = 3). d Primary human GC B cells were transduced with the oncogenic cocktail BCL2 and BCL6 and cultured to day 73. Representative flow cytometry analysis ( n = 3) for the expression of the GC B cell markers CD38, CD20, CD19, CD80, CD22, CD95, CXCR4, and CD86. Red histograms show GC B cells compared to primary human naive B cells (blue). e Heat map of gene expression of freshly isolated GC B cells ( n = 3), transduced GC B cells ( BCL2-BCL6, BCL2-MYC ) cultured ex vivo for 5 or 73 days ( n = 3), plasma cell line ( n = 1), naive B cells ( n = 1), and lymphoma cell li

- Submitted by
- Invitrogen Antibodies (provider)
- Main image
- Experimental details
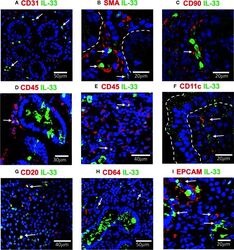
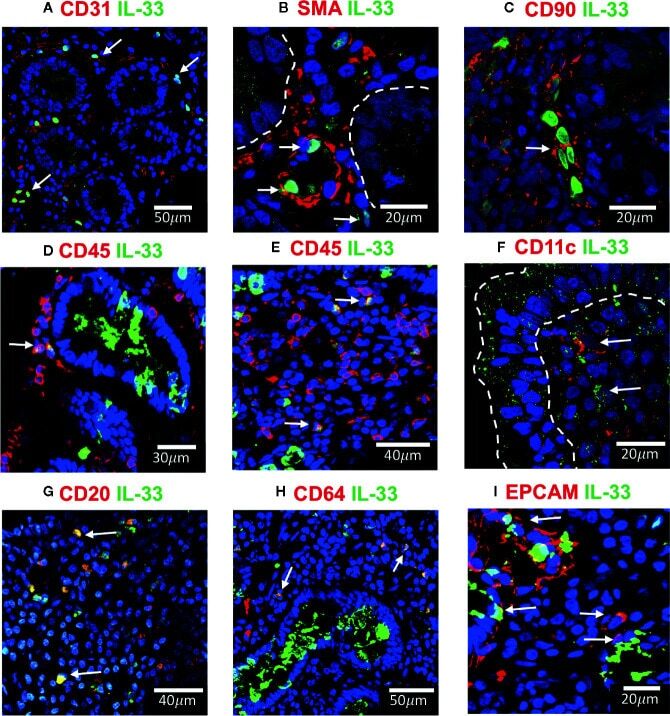
- Figure 4 IL-33 + cells in Duodenal Mucosae of active celiac patients. Representative images of immunofluorescence analysis of duodenal sections of active CD patients. IL-33 (green), nuclei (blue). Other markers in red. In some images the epithelial compartment was delimited with white dashed lines. (A). CD31 + endothelial cells expressing IL-33 (white arrows). (B) Smooth muscle actin in red and white lines delineated intestinal crypts. The white arrows point to SMA + IL-33 + cells which are located around vascular structures and crypts. (C) Some of the IL-33 + CD90 + cells are pointed by a white arrow. (D, E) CD45+IL-33+ cells in lamina propria , but not in epithelial compartment. (F) A few IL-33 + CD11c + where close to the epithelium of ACD patients. (G) Some of the CD20 + IL-33 + cells are pointed with white arrows. (H) Some of the lamina propria double positive IL-33 + CD64 + are pointed with white arrows. (I) EPCAM + IL-33 + cells are pointed with white arrows. The images were taken with 20X and 63X objectives from the SP5 Leica Microscope and objectives 20X, 40X and 60X from the Apotome Zeiss microscope.
- Submitted by
- Invitrogen Antibodies (provider)
- Main image
- Experimental details
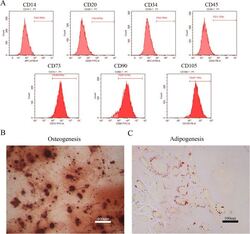
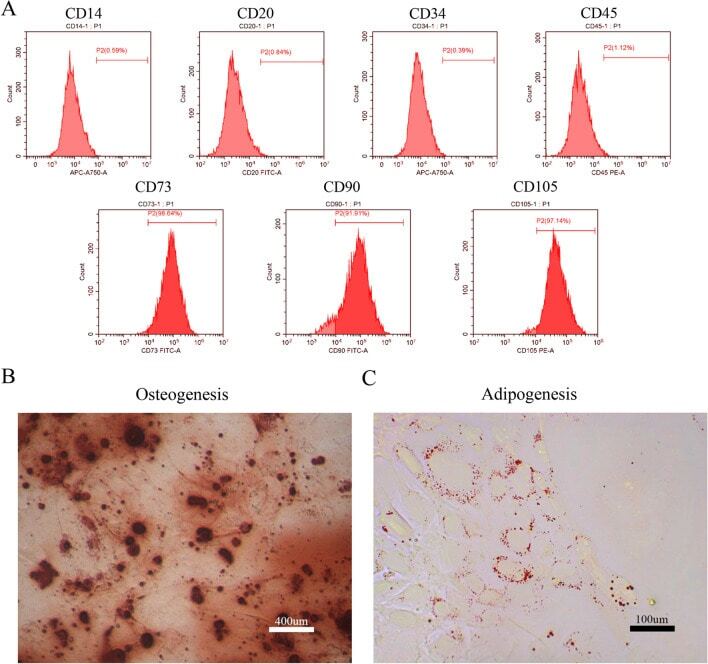
- Figure 1 Identification of dental pulp stem cells (DPSCs). Human DPSCs were positive for the cell surface antigens CD73, CD90, and CD105, as well as negative for CD14, CD20, CD34, and CD45 demonstrated by flow cytometry ( A ). DPSCs were cultured under osteogenic ( B , 14 days) or adipogenic ( C , 21 days) conditions, and showed mineralized nodules and lipid clusters as revealed by alizarin red and oil red staining, respectively. Scale bar = 400 ( B ) or 100 ( C ) mum.
- Submitted by
- Invitrogen Antibodies (provider)
- Main image
- Experimental details
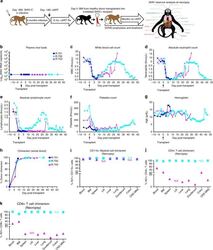
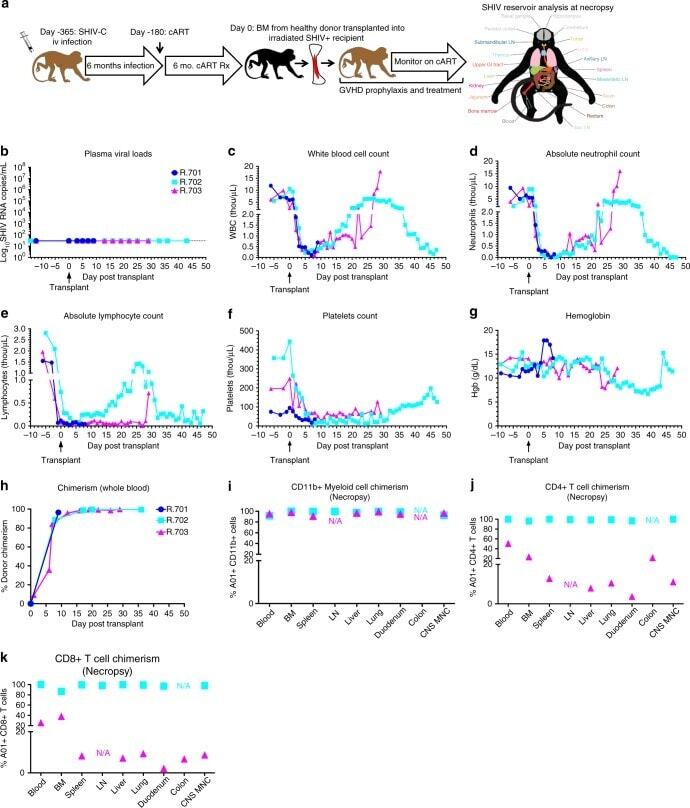
- Fig. 3 Allogeneic HCT in SHIV-C Infected, cART-treated RM. a Schematic of SHIV-C infection and allogeneic bone marrow transplantation strategy in SHIV-C infected, cART-treated RM. b Plasma Viral Loads (PVL) were measured longitudinally following transplant as specified in Fig. 1a . c White blood count (WBC) (x10 3 /uL). d Absolute Neutrophil Count (ANC) (x10 3 /uL). e Absolute Lymphocyte Count (ALC) (x10 3 /uL). f Platelet Count (PLT) (x10 3 /uL). g Hemoglobin (Hgb) concentration (g/dL). h Percent whole blood donor chimerism, measured by microsatellite analysis. i Percent donor myeloid (CD11b + CD3-) chimerism, measured flow cytometrically. j Percent donor CD4 + T cell (CD3+ CD4+ CD8- CD20- CD11b- lymphocytes) chimerism, measured flow cytometrically. k Percent donor CD8 + T cell (CD3+ CD8+ CD4- CD20- CD11b- lymphocytes) chimerism, measured by flow cytometry
- Submitted by
- Invitrogen Antibodies (provider)
- Main image
- Experimental details
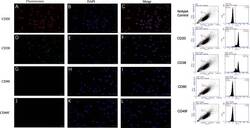
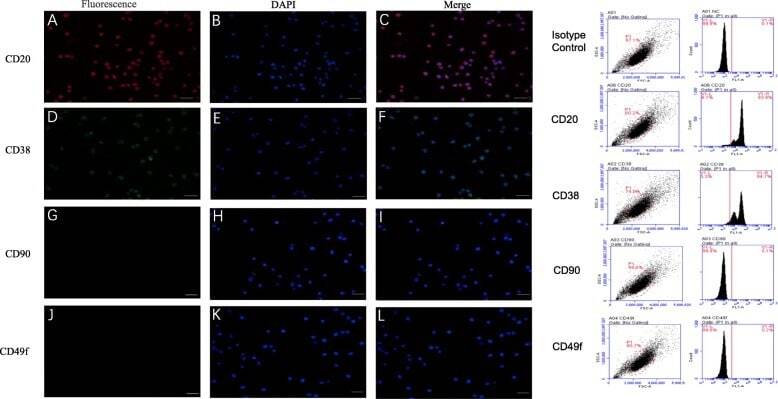
- Fig. 1 Marker verification and validation of independent markers in BALL cells by immunofluorescence and flow cytometry. The expression of CD20 ( a - c ) and CD38 ( d - f ), were positive on BALL cell membranes. CD90f ( g - i ) and CD49f ( j , k ) were not expressed in BALL cells. DAPI indicates the cell nucleus. This finding was confirmed via the conducted flow cytometry analysis. Scale bar = 100 mum
- Submitted by
- Invitrogen Antibodies (provider)
- Main image
- Experimental details
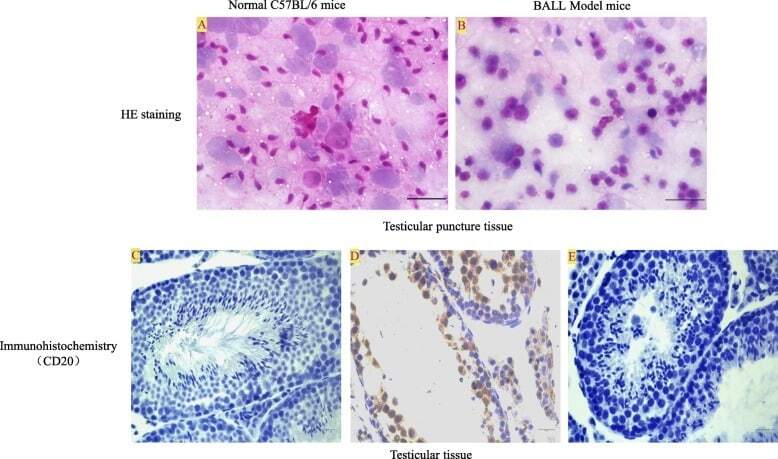
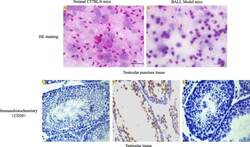
- Fig. 5 Detection of testicular leukemia model mice. HE staining: a In normal C57BL/6 mice, a large number of spermatogenic cells and sperm cells could be seen in testis tissue. b In the model group, after 10 4 cells were injected to establish the model for 3 weeks, spermatogenic cells and sperm cells in the testis tissue decreased with the infiltration of BALL cells. Immunohistochemistry: c In normal C57BL/6 mice, the expression of CD20 protein in testicular tissue was negative. d In the model group, a large number of CD20-positive BALL cells infiltrated into the seminiferous tubule, spermatogenic cells and sperm cells in the testis tissue decreased. e Negative control. Scale bar = 100 mum