Explore
 Validate
 Learn
Learn Western blot
 Immunocytochemistry
Antibody data
- Antibody Data
- Antigen structure
- References [5]
- Comments [0]
- Validations
- Immunocytochemistry [2]
- Immunohistochemistry [3]
- Other assay [10]
Submit
Validation data
Reference
Comment
Report error
- Product number
- 50-0202-82 - Provider product page

- Provider
- Invitrogen Antibodies
- Product name
- CD20 Monoclonal Antibody (L26), eFluor™ 660, eBioscience™
- Antibody type
- Monoclonal
- Antigen
- Other
- Description
- Description: The monoclonal antibody L26 recognizes human CD20, a two transmembrane spanning protein found on precursor and mature B lymphocytes. Expression is lost upon differentiation to plasma cells. The levels of CD20 are critical in evaluating malignant B lymphocytes including Non-Hodgkin's Lymphoma, and Acute B cell, Chronic Lymphocytic and Hairy-Cell Leukemias. CD20 plays a role in B cell differentiation and activation. The structure of the protein shows a small extracellular loop with the carboxy and amino termini in the cytoplasmic compartment. The L26 antibody recognizes an epitope in the cytoplasmic domain and therefore requires permeabilization of the tissue for staining applications. Unlike many anti-CD20 antibodies that recognize the extracellular domain, the epitope recognized by L26 will not be blocked by therapeutic antibodies to CD20, like Rituximab. Applications Reported: This L26 antibody has been reported for use in immunohistochemical staining of formalin-fixed paraffin embedded tissue sections. Applications Tested: This L26 antibody has been tested by immunohistochemistry on formalin-fixed paraffin embedded human tonsils using IHC Antigen Retrieval Solution - Low pH (Product # 00-4955-58). eFluor® 660 is a replacement for Alexa Fluor® 647. eFluor® 660 emits at 659 nm and is excited with the red laser (633 nm). Please make sure that your instrument is capable of detecting this fluorochome. This can be used at less than or equal to 20 µg/mL. It is recommended that the antibody be carefully titrated for optimal performance in the assay of interest. Excitation: 633-647 nm; Emission: 668 nm; Laser: Red Laser. Filtration: 0.2 µm post-manufacturing filtered.
- Reactivity
- Human
- Host
- Mouse
- Isotype
- IgG
- Antibody clone number
- L26
- Vial size
- 100 μg
- Concentration
- 0.2 mg/mL
- Storage
- 4°C, store in dark, DO NOT FREEZE!
Submitted references In Situ Characterization of Human Lymphoid Tissue Immune Cells by Multispectral Confocal Imaging and Quantitative Image Analysis; Implications for HIV Reservoir Characterization.
Highly multiplexed immunofluorescence images and single-cell data of immune markers in tonsil and lung cancer.
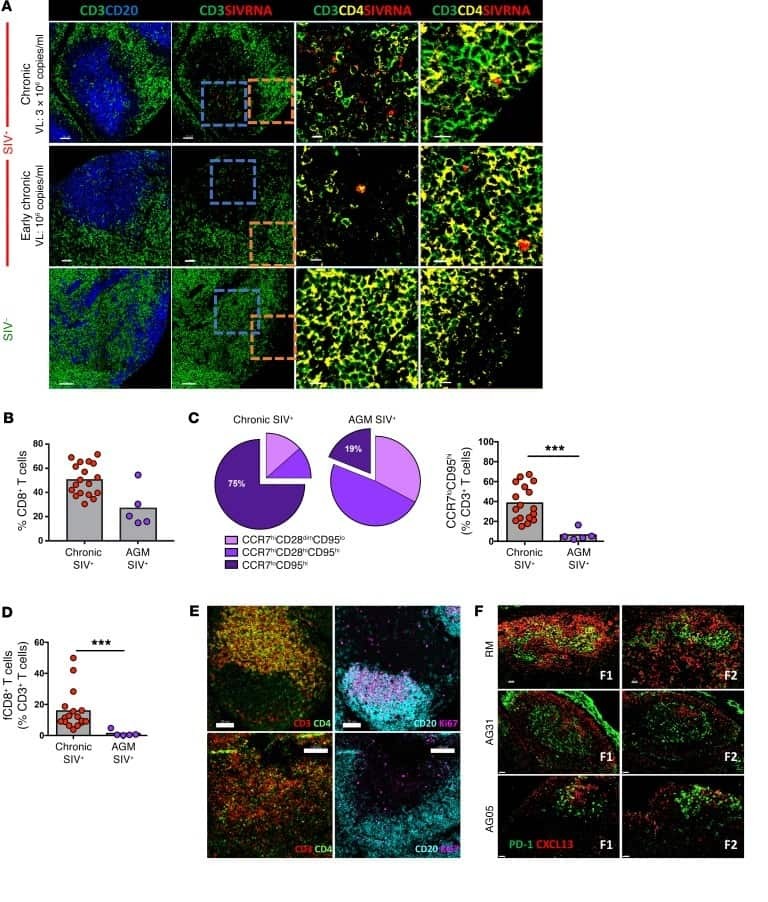
Accumulation of follicular CD8+ T cells in pathogenic SIV infection.
Functional disparities among BCL-2 members in tonsillar and leukemic B-cell subsets assessed by BH3-mimetic profiling.
Heterogeneous fibroblasts underlie age-dependent tertiary lymphoid tissues in the kidney.
Moysi E, Del Rio Estrada PM, Torres-Ruiz F, Reyes-Terán G, Koup RA, Petrovas C
Frontiers in immunology 2021;12:683396
Frontiers in immunology 2021;12:683396
Highly multiplexed immunofluorescence images and single-cell data of immune markers in tonsil and lung cancer.
Rashid R, Gaglia G, Chen YA, Lin JR, Du Z, Maliga Z, Schapiro D, Yapp C, Muhlich J, Sokolov A, Sorger P, Santagata S
Scientific data 2019 Dec 17;6(1):323
Scientific data 2019 Dec 17;6(1):323
Accumulation of follicular CD8+ T cells in pathogenic SIV infection.
Ferrando-Martinez S, Moysi E, Pegu A, Andrews S, Nganou Makamdop K, Ambrozak D, McDermott AB, Palesch D, Paiardini M, Pavlakis GN, Brenchley JM, Douek D, Mascola JR, Petrovas C, Koup RA
The Journal of clinical investigation 2018 May 1;128(5):2089-2103
The Journal of clinical investigation 2018 May 1;128(5):2089-2103
Functional disparities among BCL-2 members in tonsillar and leukemic B-cell subsets assessed by BH3-mimetic profiling.
Peperzak V, Slinger E, Ter Burg J, Eldering E
Cell death and differentiation 2017 Jan;24(1):111-119
Cell death and differentiation 2017 Jan;24(1):111-119
Heterogeneous fibroblasts underlie age-dependent tertiary lymphoid tissues in the kidney.
Sato Y, Mii A, Hamazaki Y, Fujita H, Nakata H, Masuda K, Nishiyama S, Shibuya S, Haga H, Ogawa O, Shimizu A, Narumiya S, Kaisho T, Arita M, Yanagisawa M, Miyasaka M, Sharma K, Minato N, Kawamoto H, Yanagita M
JCI insight 2016 Jul 21;1(11):e87680
JCI insight 2016 Jul 21;1(11):e87680
No comments: Submit comment
Supportive validation
- Submitted by
- Invitrogen Antibodies (provider)
- Main image

- Experimental details
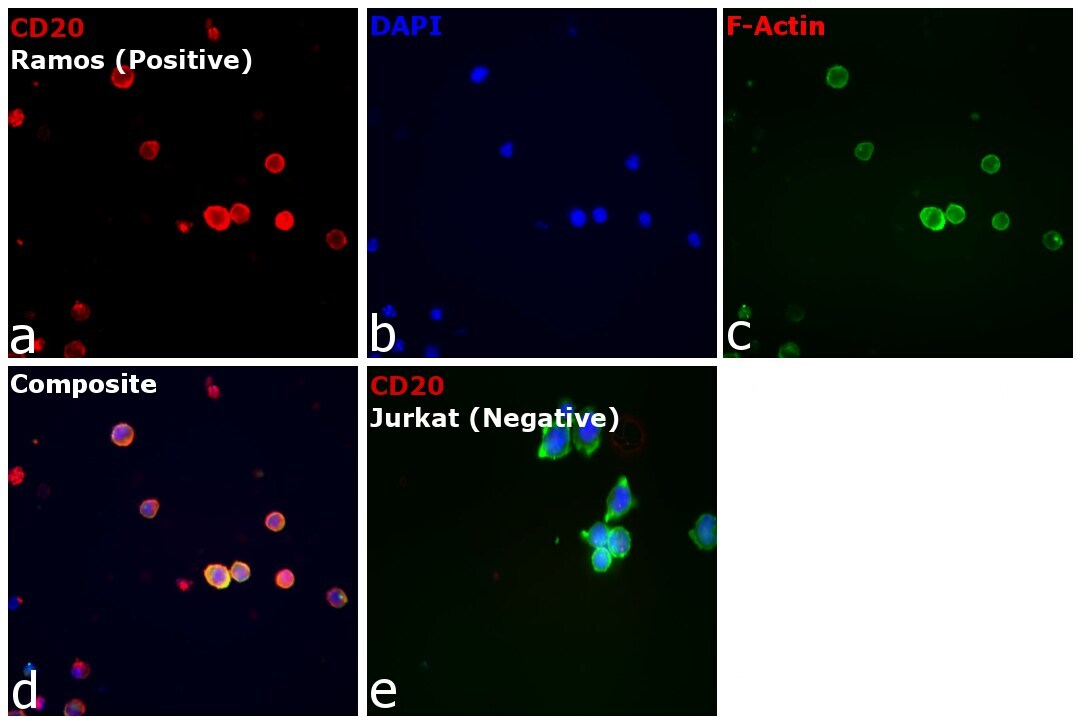
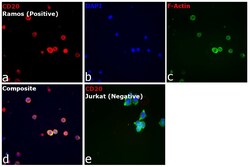
- Immunofluorescence analysis of CD20 was performed using Ramos cells. The cells were fixed with 4% paraformaldehyde for 10 minutes, permeabilized with 0.1% Triton™ X-100 for 15 minutes, and blocked with 2% BSA for 1 hour at room temperature. The cells were labeled with CD20 Monoclonal Antibody (L26), eFluor™ 660, eBioscience™ (Product # 50-0202-82) at 5 µg/mL in 0.1% BSA, incubated at 4 degree celsius overnight (Panel a: Red). Nuclei (Panel b: Blue) were stained with Hoechst 33342 (Product # H1399). F-actin (Panel c: Green) was stained with Alexa Fluor™ 488 Phalloidin (Product # A12379, 1:500 dilution). Panel d represents the merged image showing cell membrane localization. Panel e represents MCF7 cells with no expression of CD20. The images were captured at 40X magnification.
- Submitted by
- Invitrogen Antibodies (provider)
- Main image
- Experimental details
- Immunofluorescence analysis of CD20 was performed using Ramos cells. The cells were fixed with 4% paraformaldehyde for 10 minutes, permeabilized with 0.1% Triton™ X-100 for 15 minutes, and blocked with 2% BSA for 1 hour at room temperature. The cells were labeled with CD20 Monoclonal Antibody (L26), eFluor™ 660, eBioscience™ (Product # 50-0202-82) at 5 µg/mL in 0.1% BSA, incubated at 4 degree celsius overnight (Panel a: Red). Nuclei (Panel b: Blue) were stained with Hoechst 33342 (Product # H1399). F-actin (Panel c: Green) was stained with Alexa Fluor™ 488 Phalloidin (Product # A12379, 1:500 dilution). Panel d represents the merged image showing cell membrane localization. Panel e represents MCF7 cells with no expression of CD20. The images were captured at 40X magnification.

Supportive validation
- Submitted by
- Invitrogen Antibodies (provider)
- Main image

- Experimental details
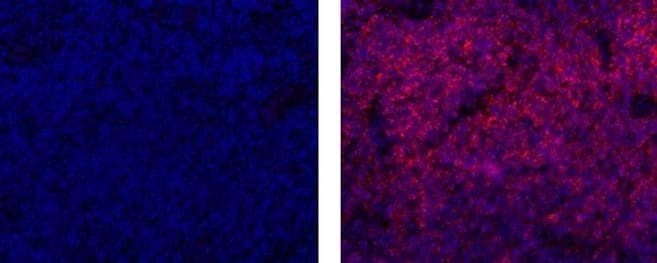
- Immunohistochemistry on formalin-fixed paraffin embedded human tonsil, using 20 µg/mL of Mouse IgG2a K Isotype Control eFluor® 660 (left) or 20 µg/mL Anti-Human CD20 eFluor® 660 (right). Nuclei are stained with DAPI.
- Submitted by
- Invitrogen Antibodies (provider)
- Main image
- Experimental details
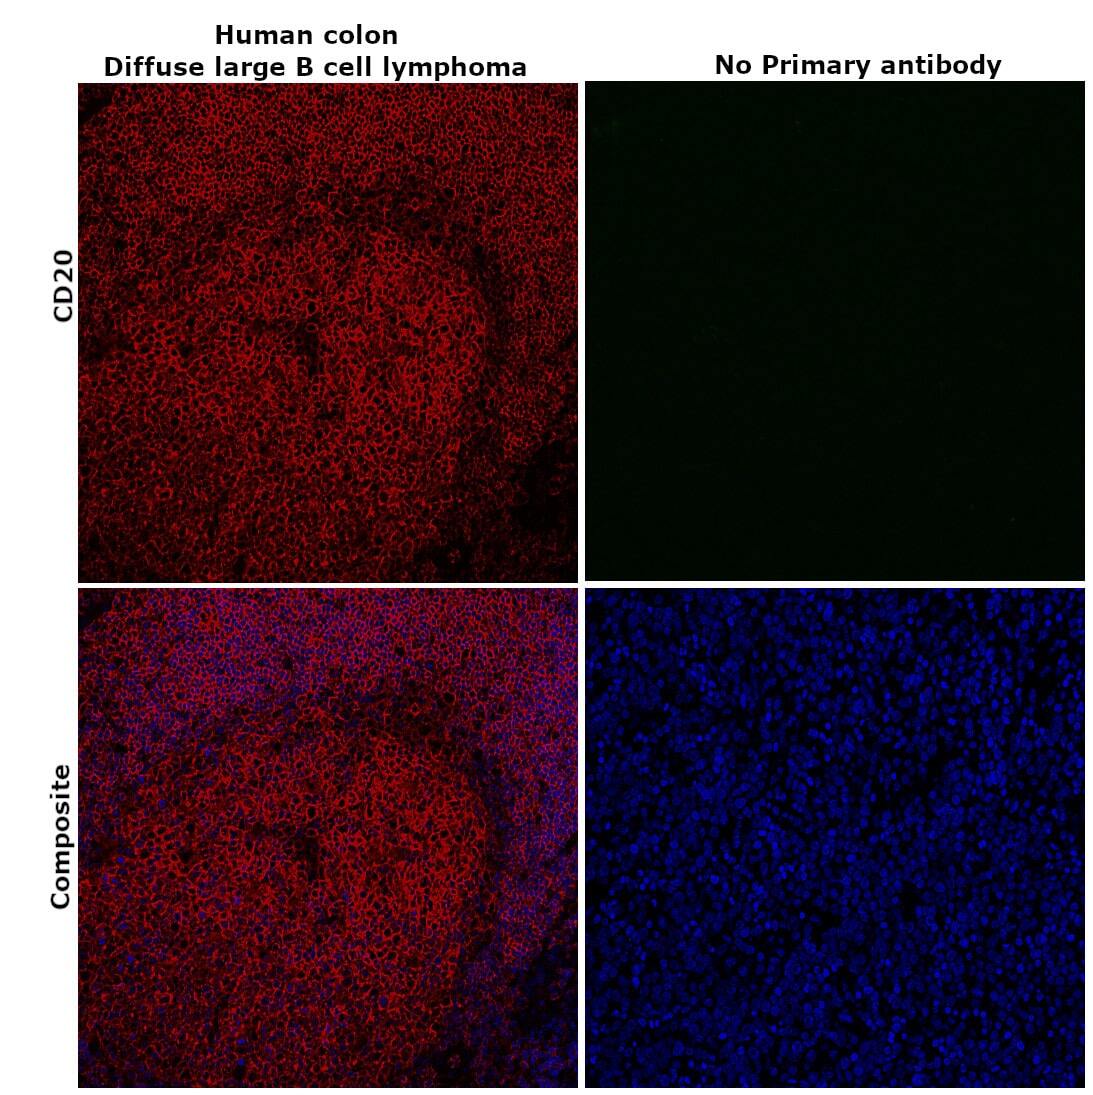
- Immunohistochemical analysis of CD20 was performed using formalin-fixed paraffin-embedded human colon (diffuse large B cell lymphoma) tissue sections. To expose the target protein, heat-induced epitope retrieval was performed on de-paraffinized sections using eBioscience™ IHC Antigen Retrieval Solution - High pH (10X) (Product # 00-4956-58) diluted to 1X solution in water in a decloaking chamber at 110 degree Celsius for 15 minutes. Following antigen retrieval, the sections were blocked with 2% normal goat serum in 1X PBS for 45 minutes at room temperature and then probed with or without CD20 Monoclonal Antibody (L26), eFluor™ 660, eBioscience™ (Product # 50-0202-82) at 2 µg/mL dilution in 0.1% normal goat serum overnight at 4 degree Celsius in a humidified chamber. ReadyProbes™ Tissue Autofluorescence Quenching Kit (Product # R37630) was used to quench autofluorescence from the tissues. Nuclei were stained with DAPI (Product # D1306) and the sections were mounted using ProLong™ Glass Antifade Mountant (Product # P36984). The images were captured on EVOS™ M7000 Imaging System (Product # AMF7000) at 20X magnification and externally deconvoluted.
- Submitted by
- Invitrogen Antibodies (provider)
- Main image
- Experimental details
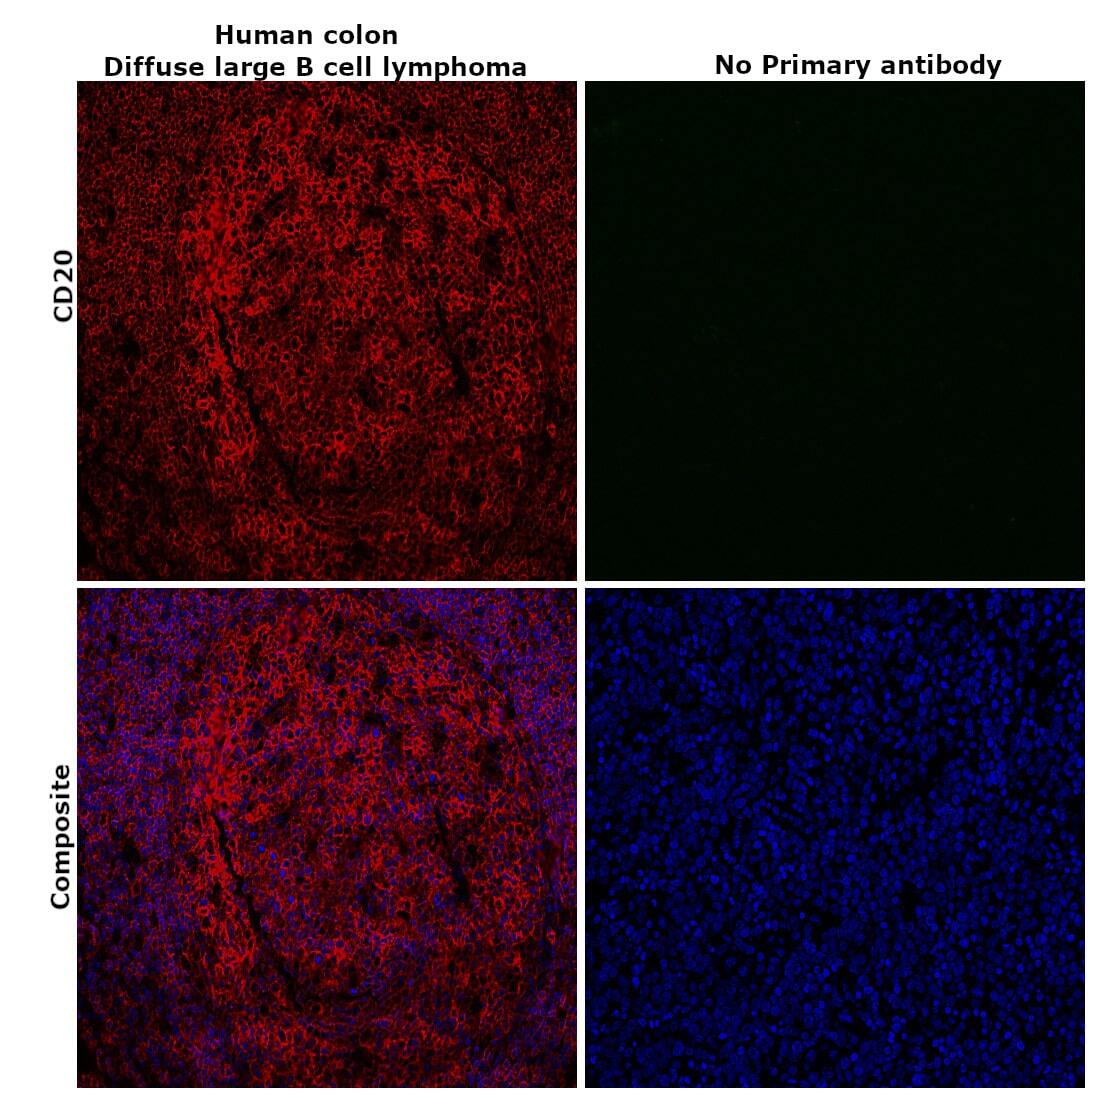
- Immunohistochemical analysis of CD20 was performed using formalin-fixed paraffin-embedded human colon (diffuse large B cell lymphoma) tissue sections. To expose the target protein, heat-induced epitope retrieval was performed on de-paraffinized sections using eBioscience™ IHC Antigen Retrieval Solution - Low pH (10X) (Product # 00-4955-58) diluted to 1X solution in water in a decloaking chamber at 110 degree Celsius for 15 minutes. Following antigen retrieval, the sections were blocked with 2% normal goat serum in 1X PBS for 45 minutes at room temperature and then probed with or without CD20 Monoclonal Antibody (L26), eFluor™ 660, eBioscience™ (Product # 50-0202-82) at 2 µg/mL dilution in 0.1% normal goat serum overnight at 4 degree Celsius in a humidified chamber. ReadyProbes™ Tissue Autofluorescence Quenching Kit (Product # R37630) was used to quench autofluorescence from the tissues. Nuclei were stained with DAPI (Product # D1306) and the sections were mounted using ProLong™ Glass Antifade Mountant (Product # P36984). The images were captured on EVOS™ M7000 Imaging System (Product # AMF7000) at 20X magnification and externally deconvoluted.
Supportive validation
- Submitted by
- Invitrogen Antibodies (provider)
- Main image
- Experimental details
- NULL

- Submitted by
- Invitrogen Antibodies (provider)
- Main image
- Experimental details
- NULL

- Submitted by
- Invitrogen Antibodies (provider)
- Main image
- Experimental details
- NULL
- Submitted by
- Invitrogen Antibodies (provider)
- Main image
- Experimental details
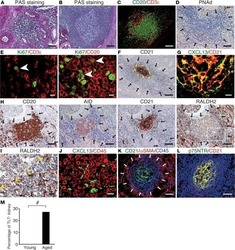
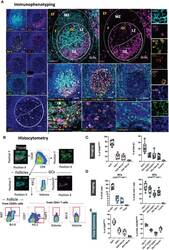
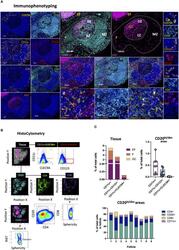
- Figure 1 Development of a multispectral panel for the characterization of GC reactivity. (A) Representative example of Ki67 (magenta), CD20 (cyan), PD-1 (red), Bcl-6 (yellow), CD57 (orange), CD4 (green) and FoxP3 (pink) staining patterns in a tonsillar tissue section (left and right panels) and concomitant B-cell follicle and GC boundary delineations (Extrafollicular CD20lo and Follicular CD20hi/dim; Mantle Zone; MZ: CD20dimKi67lo, Light Zone; LZ: CD20hiKi67lo and Dark Zone; DZ: CD20dim Ki67hi) (middle panel). Circles in lower middle panels denote single FoxP3 events. (B) Histocytometry immunophenotyping gating strategy used for the sequential identification of B cells (CD20+Bcl-6+/- Ki67+/-), Tfh (CD4+PD-1hiBcl-6+/- CD57+/-), and Tfr (CD4+FoxP3+) in tonsillar tissue after nuclear staining based cell segmentation on Imaris and FlowJo analysis. F and EF and GC areas were defined based on the respective staining signals for CD20, Ki67 and CD4 and manually gated on FlowJo to extract frequencies for specific tissue localities. (C) Box plots showing the representative frequencies of B cell and CD4+ T-cell populations (Tfh, Treg) in B-cell follicles (CD20 hi/dim areas) as defined by the expression of Ki67/Bcl-6, PD-1/CD57/Bcl-6 and FoxP3 in tonsillar tissue after application of the GC reactivity pipeline. Each box plot circle represents an individual follicle. Colors represent different phenotypic groups. (D) Box plots showing the relative frequencies of B-cells, CD4 T cells, Tfh a
- Submitted by
- Invitrogen Antibodies (provider)
- Main image
- Experimental details
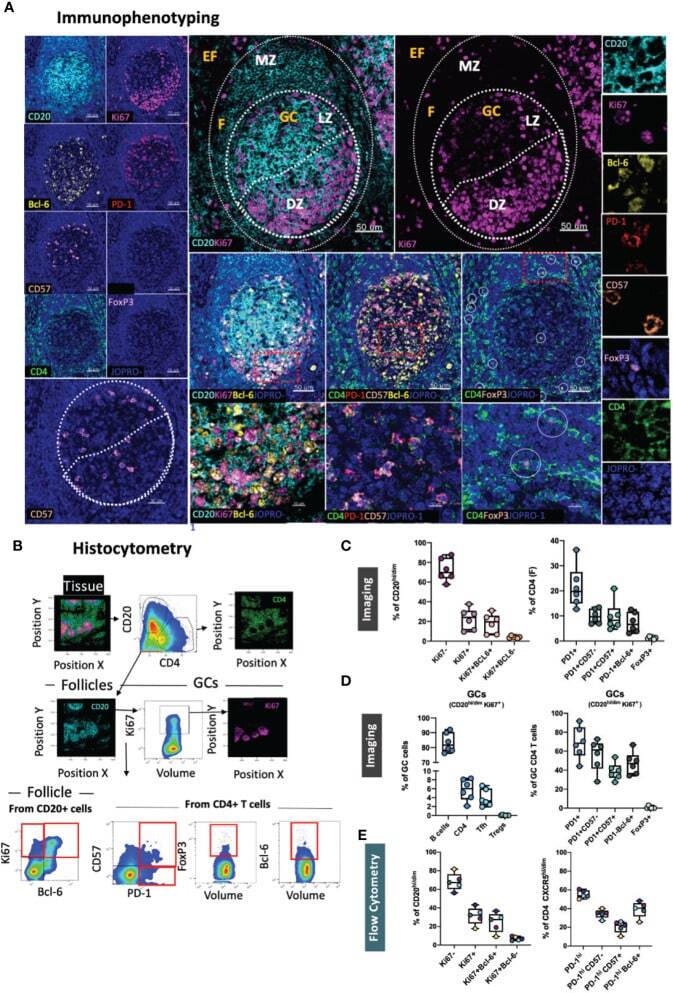
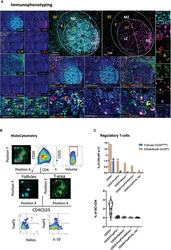
- Figure 2 Development of a multispectral panel for the assessment of tissue-specific T-cell regulation. (A) Representative example of antibody staining patterns for Helios (pink), CD20 (cyan), CD25 (red), IL-10 (yellow), Ki67 (magenta), CD4 (green) and FoxP3 (purple) in a tonsillar tissue section (left and right panels) and distribution of each marker with respect to the MZ, LZ and DZ (middle panels). Circles (pink/purple) in lower middle panels denote individual Helios (pink) and FoxP3 (purple) events. (B) Immunophenotyping gating strategy used for the identification of Tregs and Tfrs in lymphoid tissues of interest based on the expression and coexpression of the transcription factors FoxP3, Helios, the protein marker CD25 and IL10 in histocytometry. (C) Bar graphs (upper row) and violin plots (lower row) showing the frequencies of Tregs and Tfrs in follicular and extrafollicular areas and frequencies of Tfr subsets in a tonsillar tissue section. Circles in violin plots represent individual follicles whereas colors represent different phenotypic subgroups. Images were acquired at 40x (NA 1.3) with 1% magnification. Scale bars are 50um, 10um (zoomed in details) and 5um (Helios and FoxP3 staining patterns) respectively.
- Submitted by
- Invitrogen Antibodies (provider)
- Main image

- Experimental details
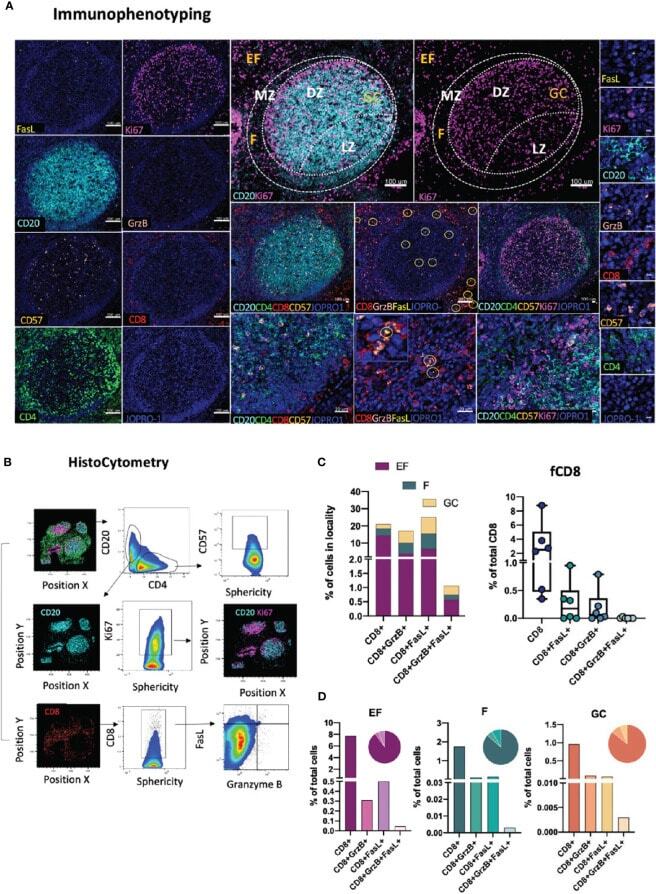
- Figure 4 Development of a multispectral panel for the topological examination of CD8 T cells. (A) Representative example of antibody staining patterns for FasL (yellow), Ki67 (magenta), CD20 (cyan), Granzyme B (pink), CD57 (orange), CD4 (green) and the nuclear marker JOPRO-1 (blue) and distribution of each protein marker with respect to the MZ, LZ and DZ (middle panels). Yellow circles in lower middle panels denote individual FasL events. (B) Gating strategy used for the immunophenotyping of various CD8 T cell populations (CD8 hi ; CD8 hi GrzB+, CD8 hi FasL+ and CD8 hi GrzB+ FasL+) in in GC (CD20 dim Ki67 hi ), F (CD20 hi/dim )and EF (CD20 lo ) areas. (C) Box plots and bar graphs showing the relative frequencies of four distinct CD8 T cell populations in EF, F and GC; the frequencies of follicular CD8 hi ; CD8 hi GrzB+, CD8 hi FasL+ and CD8 hi GrzB+ FasL+ in six distinct follicles and (D) proportion of each CD8+ cell subset within each locality (EF, F and GC) as a percentage of total cells. Each circle represents a follicle and each color stands for a distinct subpopulation. Images were acquired at 40x (NA 1.3) with 1% magnification. Scale bars are 100um for all panels displaying an entire follicle), 20um in the middle panel close ups and 5um in the right panel single staining close ups.
- Submitted by
- Invitrogen Antibodies (provider)
- Main image
- Experimental details
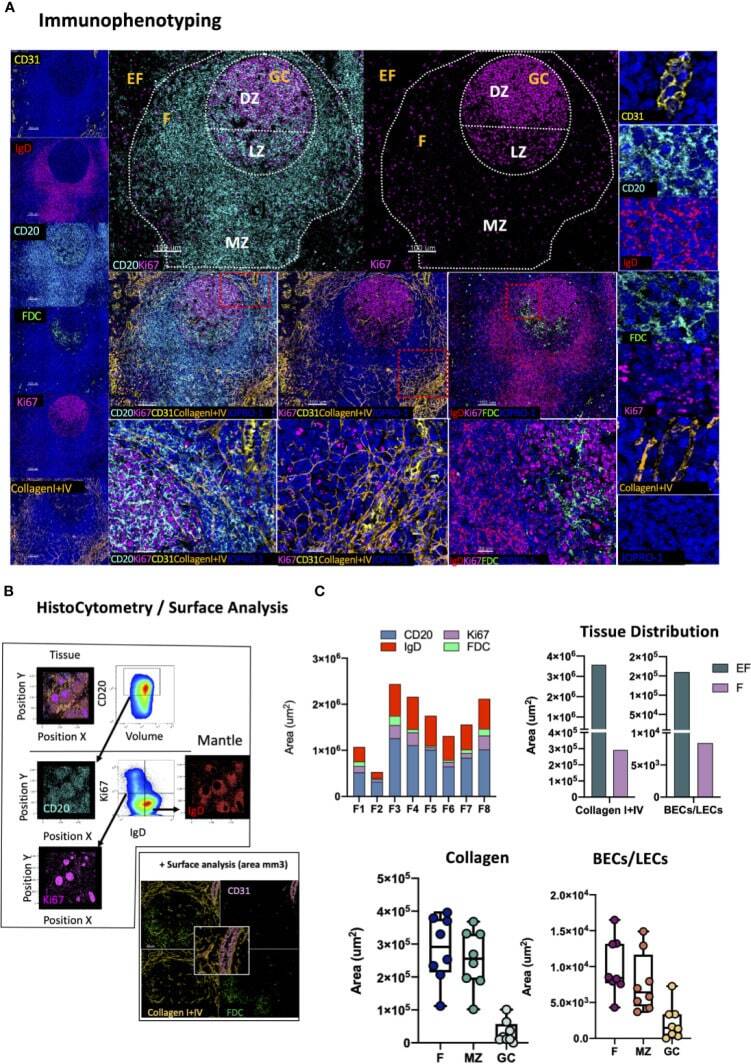
- Figure 6 Development of a multispectral panel for the evaluation of GC microarchitecture. (A) Representative images showing staining for CD31 (yellow), IgD (red), CD20 (cyan), FDC (green), KI67 (magenta) and Collagen I+IV (orange) in a tonsillar tissue section and individual protein marker distributions with respect to the MZ, LZ and DZ of a B-cell follicle (middle panels). Red dotted square enclosures in lower middle panels denote the areas that are presented magnified in the lower middle panels. (B) Gating strategy used for the sequential positional immunophenotyping of naive B-cells (IgD hi ) in F (CD20 hi/dim ) areas using histocytometry. (C) Box plots showing the areas (um3) occupied by each individual microarchitectural component namely B-cell follicle; CD20 hi/dim; mantle zone: IgD hi , GC (CD20 dim Ki67 hi ) and FDC network (FDC hi ) in eight distinct B cell follicles as measured by surface analysis in the program Imaris as well as the relative areas occupied by Collagen (Collagen I+IVhi) and vascular and lymphatic endothelium (CD31 hi CollagenI+IV hi ) in EF areas, F areas and GCs. Images were acquired at 40x (NA 1.3) with 1% magnification. Scale bars are 100um for all panels displaying an entire follicle), 20um in the middle panel close ups and 5um in the right panel single staining close ups. BEC, Blood Endothelial Cell; LEC, Lymphatic Endothelial Cell.
- Submitted by
- Invitrogen Antibodies (provider)
- Main image
- Experimental details
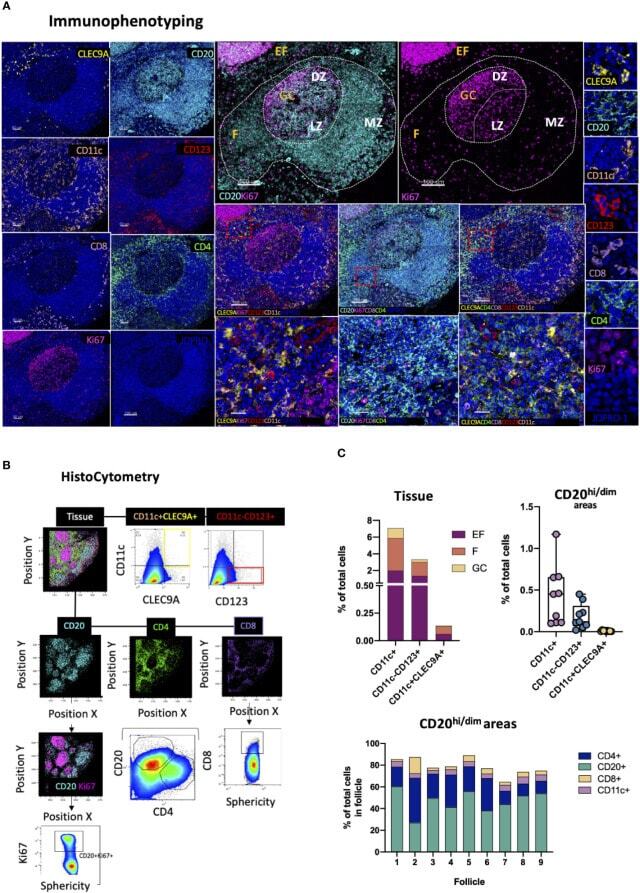
- Figure 7 Development of a multispectral panel for the topological examination of DCs. (A) Representative images showing staining for CLEC9A (yellow), CD20 (cyan), CD11c (orange), CD123 (red), CD8 (pink), CD4 (green), Ki67 (magenta) and JOPRO-1 (blue) in a tonsillar tissue section and the distribution of each protein marker with respect to the MZ, LZ and DZ (middle panels). Red dotted square enclosures in lower middle panels denote the areas that are presented magnified in the lower middle panels. (B) Gating strategy used for the sequential positional immunophenotyping of CD4, CD8, CD20, CD11c+, CD11c+CLEC9A+CD123- and CD11c-CD123+CLEC9A- in GC (CD20 dim Ki67 hi ), F (CD20 hi/dim ) and EF (CD20 lo ) areas using histocytometry. (C) Box graphs and box plots showing the relative frequencies of CD11c+, CD11c+CLEC9A+CD123- and CD11c-CD123+CLEC9A- immune cells in tonsillar tissue as well as in CD20 hi/dim areas (upper panels) and relative frequencies of CD20, CD4, CD8 and CD11c+ immune cells in nine individual follicles. Images were acquired at 40x (NA 1.3) with 1% magnification. Scale bars are 100um for all panels displaying an entire follicle), 20um in the middle panel close ups and 5um in the right panel single staining close ups.
- Submitted by
- Invitrogen Antibodies (provider)
- Main image
- Experimental details
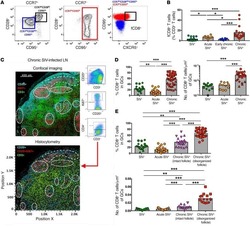
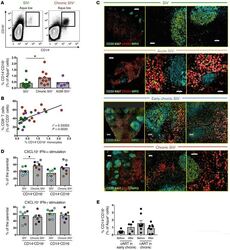
- Figure 6 Accumulation of functional monocytes in proximity to follicular areas during SIV infection. ( A ) Representative flow cytometric plots showing the gating scheme for identification of monocyte subsets and pooled data showing the relative frequency of CD14 hi CD16 hi monocytes in LNs from noninfected RMs ( n = 11), chronically infected RMs ( n = 11), and chronically infected AGMs ( n = 5). * P < 0.05, by Mann-Whitney U test. ( B ) Linear regression analysis showing the association between the frequency of LN CD14 hi CD16 hi monocytes and LN total CD8 + T cells. ( C ) Representative confocal images showing the distribution of monocytes (CD163 hi , in red) and granulocytes (MPO hi , in green) in LN tissues from noninfected and acutely and chronically SIV-infected RMs. Two zoomed areas close to the B cell follicle (defined by CD20 and Ki67 expression) from each animal are also shown. Scale bars: 400mum (top two), 200 mum (third row), and 300 mum (lower); enlarged 50 mum; 40 mum (second row, right). Original magnification, x20. ( D ) Pooled data showing CXCL10 production by CD14 hi CD16 hi and CD14 hi CD16 lo monocytes (flow cytometric intracellular staining analysis) after short in vitro stimulation with either IFN-alpha or IFN-gamma. Cells from noninfected ( n = 8) and chronically SIV-infected ( n = 8) RMs were analyzed. * P < 0.05, by Mann-Whitney U test. ( E ) Relative frequency of LN CD14 hi CD16 hi monocytes before and after cART from RMs tr
- Submitted by
- Invitrogen Antibodies (provider)
- Main image
- Experimental details
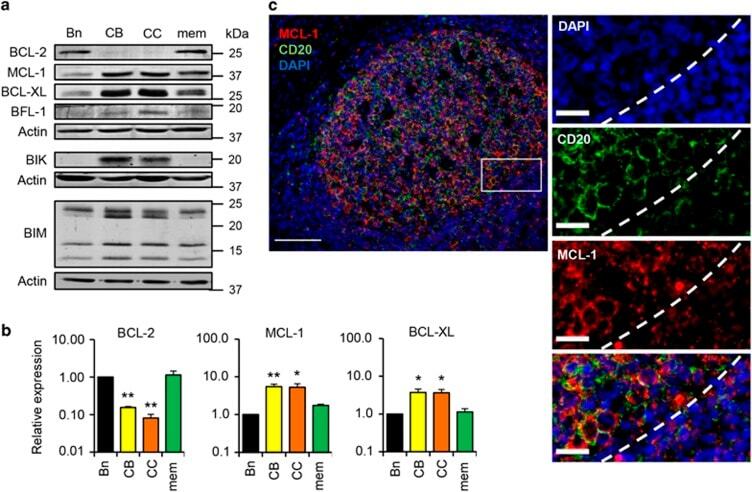
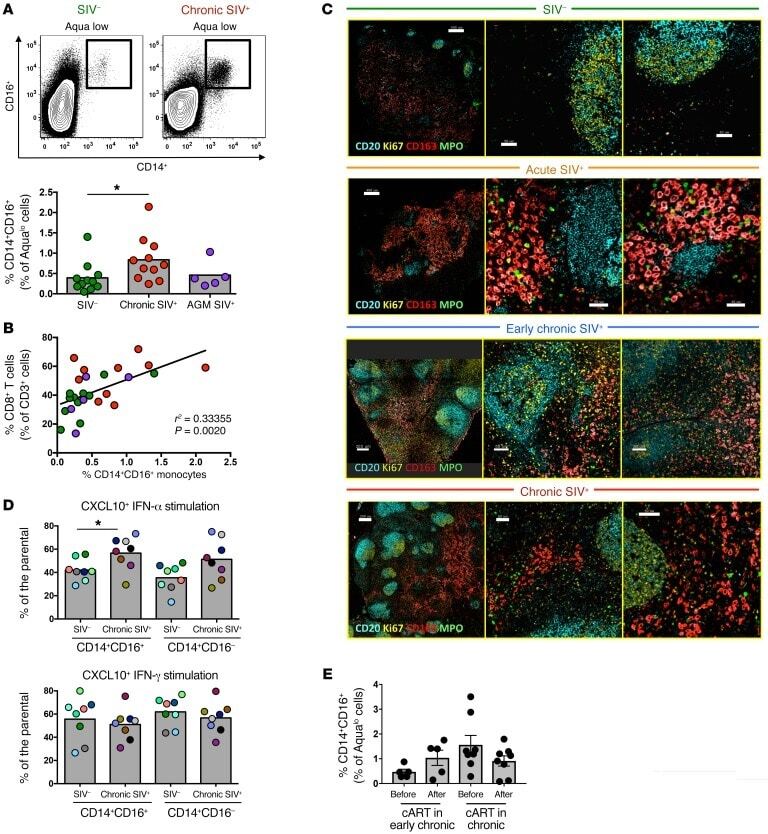
- Figure 2 Differential protein expression of BCL-2 family members in primary human B cells. ( a ) Western blot analysis for indicated BCL-2 family members in tonsil B cells, fluorescence-activated cell sorting (FACS)-purified as shown in Figure 1a . Data is representative of two (BFL-1, BIK and BIM) to four (BCL-2, MCL-1 and BCL-XL) independent experiments. ( b ) Quantified western blots shown in a corrected for expression of Actin and relative to naive B cells. BFL-1 expression could not be quantified due to the low expression level. Data are average values of three to four different experiments with S.E.M. ( c ) Fluorescence microscopy image of a tonsil section showing MCL-1 protein staining in a CD20 + GC in the tonsil. Scale bar, 100 mu m in overview image (left panel) and 20 mu m in selection (right panel). Images are representative of three individual experiments. Statistics were calculated in relation to Bn cells. * P 0.05, ** P 0.01