Explore
 Validate
 Learn
Learn Western blot
 Flow cytometry
Antibody data
- Antibody Data
- Antigen structure
- References [45]
- Comments [0]
- Validations
- Flow cytometry [2]
- Other assay [56]
Submit
Validation data
Reference
Comment
Report error
- Product number
- 14-0349-37 - Provider product page

- Provider
- Invitrogen Antibodies
- Product name
- CD34 Monoclonal Antibody (4H11), eBioscience™
- Antibody type
- Monoclonal
- Antigen
- Other
- Description
- Description: The 4H11 monoclonal antibody reacts with human CD34, also known as mucosialin. CD34 belongs to a protein family which also includes endoglycan and podocalyxin. Members of this family are single pass transmembrane proteins with a heavily glycosylated extracellular and N-terminal mucin domain. CD34 was first identified as an antigen expressed on hematopoietic progenitors, and has since been extensively used as a marker to isolate cells capable of hematopoietic cell engraftment. In spite of this, the function of CD34 remains unresolved. In addition to expression on hematopoietic progenitors, CD34 is expressed on some populations of mesenchymal stem cells, tumor cell lines, and by vascular endothelia in the adult. Epitopes of CD34 have been assigned to three classes (class I, II or III) based on their differential sensitivity to enzymatic cleavage by neuraminidase, chymopapain, or O-glycoprotease. According to this analysis, the 4H11 antibody belongs to class III, indicating that it reacts with a protein epitope. Applications Reported: This 4H11 antibody has been reported for use in flow cytometric analysis, and immunoblotting (WB). The 4H11 monoclonal antibody can also be used to inhibit proliferation and induce apoptosis in CD34+ cell lines including MOLM-9, JURL-MK1 and HEL. Applications Tested: This 4H11 antibody has been tested by flow cytometric analysis of TF-1 cells. This can be used at less than or equal to 0.5 µg per test. A test is defined as the amount (µg) of antibody that will stain a cell sample in a final volume of 100 µL. Cell number should be determined empirically but can range from 10^5 to 10^8 cells/test. It is recommended that the antibody be carefully titrated for optimal performance in the assay of interest. Purity: Greater than 90%, as determined by SDS-PAGE. Aggregation: Less than 10%, as determined by HPLC. Filtration: 0.2 µm post-manufacturing filtered.
- Reactivity
- Human
- Host
- Mouse
- Isotype
- IgG
- Antibody clone number
- 4H11
- Vial size
- 2 mg
- Concentration
- 0.5 mg/mL
- Storage
- 4°C
Submitted references Decoding the pathogenesis of Diamond-Blackfan anemia using single-cell RNA-seq.
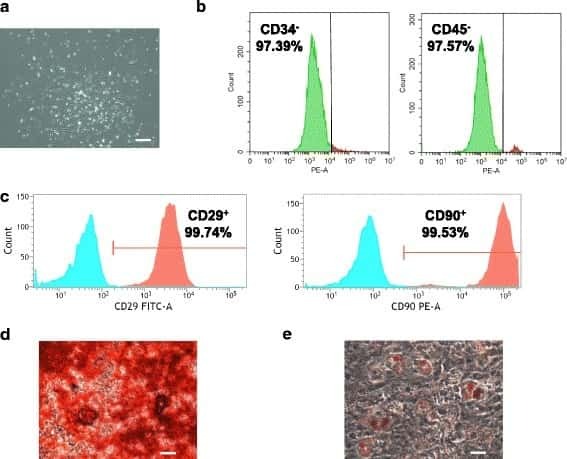
Celecoxib induces adipogenic differentiation of hemangioma-derived mesenchymal stem cells through the PPAR-γ pathway in vitro and in vivo.
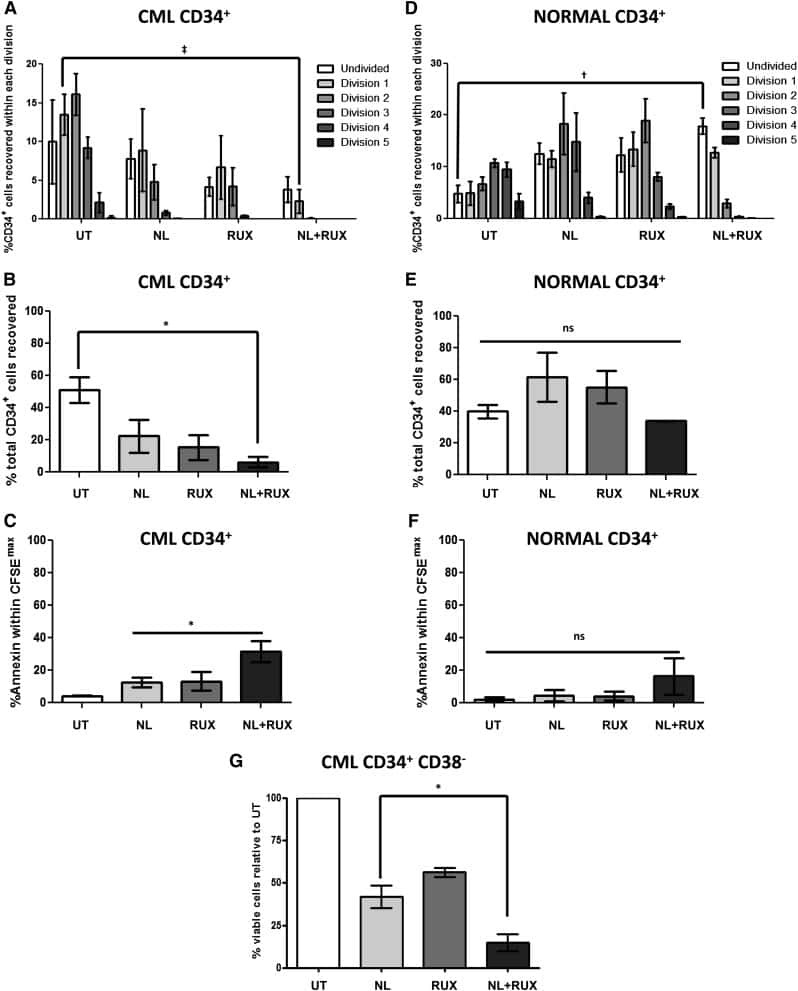
Mitochondrial oxidative phosphorylation is dispensable for survival of CD34(+) chronic myeloid leukemia stem and progenitor cells.
Endothelial GABBR2 Regulates Post-ischemic Angiogenesis by Inhibiting the Glycolysis Pathway.
Targeting the epichaperome as an effective precision medicine approach in a novel PML-SYK fusion acute myeloid leukemia.
Development, characterization, and hematopoietic differentiation of Griscelli syndrome type 2 induced pluripotent stem cells.
Modeling of endothelial cell dysfunction using human induced pluripotent stem cells derived from patients with end-stage renal disease.
VAP-PLGA microspheres (VAP-PLGA) promote adipose-derived stem cells (ADSCs)-induced wound healing in chronic skin ulcers in mice via PI3K/Akt/HIF-1α pathway.
TRPA1 triggers hyperalgesia and inflammation after tooth bleaching.
Differentiation Potential of Early- and Late-Passage Adipose-Derived Mesenchymal Stem Cells Cultured under Hypoxia and Normoxia.
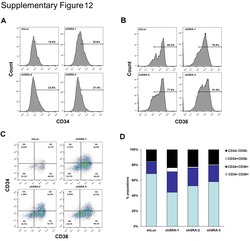
Genome-Wide Transcriptional Regulation of the Long Non-coding RNA Steroid Receptor RNA Activator in Human Erythroblasts.
Nanoparticles from Equine Fetal Bone Marrow-Derived Cells Enhance the Survival of Injured Chondrocytes.
Chemerin enhances the adhesion and migration of human endothelial progenitor cells and increases lipid accumulation in mice with atherosclerosis.
Apoptotic bodies derived from mesenchymal stem cells promote cutaneous wound healing via regulating the functions of macrophages.
Resveratrol rescues TNF‑α‑induced inhibition of osteogenesis in human periodontal ligament stem cells via the ERK1/2 pathway.
Therapeutic Effects of Human Urine-Derived Stem Cells in a Rat Model of Cisplatin-Induced Acute Kidney Injury In Vivo and In Vitro.
TGF‑β induces periodontal ligament stem cell senescence through increase of ROS production.
Regnase-1-mediated post-transcriptional regulation is essential for hematopoietic stem and progenitor cell homeostasis.
Visfatin Mediates Malignant Behaviors through Adipose-Derived Stem Cells Intermediary in Breast Cancer.
Efficient gene transfer into T lymphocytes by fiber-modified human adenovirus 5.
Improving hematopoietic recovery through modeling and modulation of the mesenchymal stromal cell secretome.
BNIP3/Bcl-2-mediated apoptosis induced by cyclic tensile stretch in human cartilage endplate-derived stem cells.
A Human IPS Model Implicates Embryonic B-Myeloid Fate Restriction as Developmental Susceptibility to B Acute Lymphoblastic Leukemia-Associated ETV6-RUNX1.
Human umbilical cord-derived mesenchymal stem cells ameliorate the enteropathy of food allergies in mice.
Combined inhibition of β-catenin and Bcr-Abl synergistically targets tyrosine kinase inhibitor-resistant blast crisis chronic myeloid leukemia blasts and progenitors in vitro and in vivo.
Vitamin C plus hydrogel facilitates bone marrow stromal cell-mediated endometrium regeneration in rats.
A high-yield isolation and enrichment strategy for human lung microvascular endothelial cells.
Human umbilical cord mesenchymal stem cells improve the reserve function of perimenopausal ovary via a paracrine mechanism.
Etanercept-Synthesising Mesenchymal Stem Cells Efficiently Ameliorate Collagen-Induced Arthritis.
Human Induced Pluripotent Stem Cell-Derived Macrophages Share Ontogeny with MYB-Independent Tissue-Resident Macrophages.
Activation of KLF1 Enhances the Differentiation and Maturation of Red Blood Cells from Human Pluripotent Stem Cells.
A Member of the Nuclear Receptor Superfamily, Designated as NR2F2, Supports the Self-Renewal Capacity and Pluripotency of Human Bone Marrow-Derived Mesenchymal Stem Cells.
A Simplified Method for the Aspiration of Bone Marrow from Patients Undergoing Hip and Knee Joint Replacement for Isolating Mesenchymal Stem Cells and In Vitro Chondrogenesis.
Microvesicles from Mesenchymal Stromal Cells Are Involved in HPC-Microenvironment Crosstalk in Myelodysplastic Patients.
CRISPR/Cas9-based genetic correction for recessive dystrophic epidermolysis bullosa.
Enforced Expression of HOXB4 in Human Embryonic Stem Cells Enhances the Production of Hematopoietic Progenitors but Has No Effect on the Maturation of Red Blood Cells.
Human adipose-derived stem cells partially rescue the stroke syndromes by promoting spatial learning and memory in mouse middle cerebral artery occlusion model.
Functional plasticity of the N-methyl-d-aspartate receptor in differentiating human erythroid precursor cells.
Differences in the Osteogenic Differentiation Capacity of Omental Adipose-Derived Stem Cells in Obese Patients With and Without Metabolic Syndrome.
Single-cell mass cytometry reveals intracellular survival/proliferative signaling in FLT3-ITD-mutated AML stem/progenitor cells.
Reprogramming human endothelial cells to haematopoietic cells requires vascular induction.
JAK2/STAT5 inhibition by nilotinib with ruxolitinib contributes to the elimination of CML CD34+ cells in vitro and in vivo.
Microvesicles derived from human umbilical cord Wharton's jelly mesenchymal stem cells attenuate bladder tumor cell growth in vitro and in vivo.
Terminal differentiation and loss of tumorigenicity of human cancers via pluripotency-based reprogramming.
Colony-stimulating factor-1 mediates macrophage-related neural damage in a model for Charcot-Marie-Tooth disease type 1X.
Wang B, Wang C, Wan Y, Gao J, Ma Y, Zhang Y, Tong J, Zhang Y, Liu J, Chang L, Xu C, Shen B, Chen Y, Jiang E, Kurita R, Nakamura Y, Lim KC, Engel JD, Zhou J, Cheng T, Zhu X, Zhu P, Shi L
Cell discovery 2022 May 10;8(1):41
Cell discovery 2022 May 10;8(1):41
Celecoxib induces adipogenic differentiation of hemangioma-derived mesenchymal stem cells through the PPAR-γ pathway in vitro and in vivo.
Wang Y, Kong L, Sun B, Cui J, Shen W
Experimental and therapeutic medicine 2022 Jun;23(6):375
Experimental and therapeutic medicine 2022 Jun;23(6):375
Mitochondrial oxidative phosphorylation is dispensable for survival of CD34(+) chronic myeloid leukemia stem and progenitor cells.
Yan JS, Yang MY, Zhang XH, Luo CH, Du CK, Jiang Y, Dong XJ, Wang ZM, Yang LX, Li YD, Xia L, Lu Y
Cell death & disease 2022 Apr 20;13(4):384
Cell death & disease 2022 Apr 20;13(4):384
Endothelial GABBR2 Regulates Post-ischemic Angiogenesis by Inhibiting the Glycolysis Pathway.
Zhang H, Zhou H, Yuan J, Nan Y, Liu J
Frontiers in cardiovascular medicine 2021;8:696578
Frontiers in cardiovascular medicine 2021;8:696578
Targeting the epichaperome as an effective precision medicine approach in a novel PML-SYK fusion acute myeloid leukemia.
Sugita M, Wilkes DC, Bareja R, Eng KW, Nataraj S, Jimenez-Flores RA, Yan L, De Leon JP, Croyle JA, Kaner J, Merugu S, Sharma S, MacDonald TY, Noorzad Z, Panchal P, Pancirer D, Cheng S, Xiang JZ, Olson L, Van Besien K, Rickman DS, Mathew S, Tam W, Rubin MA, Beltran H, Sboner A, Hassane DC, Chiosis G, Elemento O, Roboz GJ, Mosquera JM, Guzman ML
NPJ precision oncology 2021 May 26;5(1):44
NPJ precision oncology 2021 May 26;5(1):44
Development, characterization, and hematopoietic differentiation of Griscelli syndrome type 2 induced pluripotent stem cells.
Güney-Esken G, Erol ÖD, Pervin B, Gürhan Sevinç G, Önder T, Bilgiç E, Korkusuz P, Günel-Özcan A, Uçkan-Çetinkaya D, Aerts-Kaya F
Stem cell research & therapy 2021 May 13;12(1):287
Stem cell research & therapy 2021 May 13;12(1):287
Modeling of endothelial cell dysfunction using human induced pluripotent stem cells derived from patients with end-stage renal disease.
Kim KW, Shin YJ, Kim BM, Cui S, Ko EJ, Lim SW, Yang CW, Chung BH
Kidney research and clinical practice 2021 Dec;40(4):698-711
Kidney research and clinical practice 2021 Dec;40(4):698-711
VAP-PLGA microspheres (VAP-PLGA) promote adipose-derived stem cells (ADSCs)-induced wound healing in chronic skin ulcers in mice via PI3K/Akt/HIF-1α pathway.
Jiang W, Zhang J, Zhang X, Fan C, Huang J
Bioengineered 2021 Dec;12(2):10264-10284
Bioengineered 2021 Dec;12(2):10264-10284
TRPA1 triggers hyperalgesia and inflammation after tooth bleaching.
Chen C, Huang X, Zhu W, Ding C, Huang P, Li R
Scientific reports 2021 Aug 31;11(1):17418
Scientific reports 2021 Aug 31;11(1):17418
Differentiation Potential of Early- and Late-Passage Adipose-Derived Mesenchymal Stem Cells Cultured under Hypoxia and Normoxia.
Zhao AG, Shah K, Freitag J, Cromer B, Sumer H
Stem cells international 2020;2020:8898221
Stem cells international 2020;2020:8898221
Genome-Wide Transcriptional Regulation of the Long Non-coding RNA Steroid Receptor RNA Activator in Human Erythroblasts.
Sawaengdee W, Cui K, Zhao K, Hongeng S, Fucharoen S, Wongtrakoongate P
Frontiers in genetics 2020;11:850
Frontiers in genetics 2020;11:850
Nanoparticles from Equine Fetal Bone Marrow-Derived Cells Enhance the Survival of Injured Chondrocytes.
Kim KH, Park TS, Cho BW, Kim TM
Animals : an open access journal from MDPI 2020 Sep 23;10(10)
Animals : an open access journal from MDPI 2020 Sep 23;10(10)
Chemerin enhances the adhesion and migration of human endothelial progenitor cells and increases lipid accumulation in mice with atherosclerosis.
Jia J, Yu F, Xiong Y, Wei W, Ma H, Nisi F, Song X, Yang L, Wang D, Yuan G, Zhou H
Lipids in health and disease 2020 Sep 20;19(1):207
Lipids in health and disease 2020 Sep 20;19(1):207
Apoptotic bodies derived from mesenchymal stem cells promote cutaneous wound healing via regulating the functions of macrophages.
Liu J, Qiu X, Lv Y, Zheng C, Dong Y, Dou G, Zhu B, Liu A, Wang W, Zhou J, Liu S, Liu S, Gao B, Jin Y
Stem cell research & therapy 2020 Nov 27;11(1):507
Stem cell research & therapy 2020 Nov 27;11(1):507
Resveratrol rescues TNF‑α‑induced inhibition of osteogenesis in human periodontal ligament stem cells via the ERK1/2 pathway.
Yuan J, Wang X, Ma D, Gao H, Zheng D, Zhang J
Molecular medicine reports 2020 May;21(5):2085-2094
Molecular medicine reports 2020 May;21(5):2085-2094
Therapeutic Effects of Human Urine-Derived Stem Cells in a Rat Model of Cisplatin-Induced Acute Kidney Injury In Vivo and In Vitro.
Sun B, Luo X, Yang C, Liu P, Yang Y, Dong X, Yang Z, Xu J, Zhang Y, Li L
Stem cells international 2019;2019:8035076
Stem cells international 2019;2019:8035076
TGF‑β induces periodontal ligament stem cell senescence through increase of ROS production.
Fan C, Ji Q, Zhang C, Xu S, Sun H, Li Z
Molecular medicine reports 2019 Oct;20(4):3123-3130
Molecular medicine reports 2019 Oct;20(4):3123-3130
Regnase-1-mediated post-transcriptional regulation is essential for hematopoietic stem and progenitor cell homeostasis.
Kidoya H, Muramatsu F, Shimamura T, Jia W, Satoh T, Hayashi Y, Naito H, Kunisaki Y, Arai F, Seki M, Suzuki Y, Osawa T, Akira S, Takakura N
Nature communications 2019 Mar 6;10(1):1072
Nature communications 2019 Mar 6;10(1):1072
Visfatin Mediates Malignant Behaviors through Adipose-Derived Stem Cells Intermediary in Breast Cancer.
Huang JY, Wang YY, Lo S, Tseng LM, Chen DR, Wu YC, Hou MF, Yuan SF
Cancers 2019 Dec 20;12(1)
Cancers 2019 Dec 20;12(1)
Efficient gene transfer into T lymphocytes by fiber-modified human adenovirus 5.
Lv Y, Xiao FJ, Wang Y, Zou XH, Wang H, Wang HY, Wang LS, Lu ZZ
BMC biotechnology 2019 Apr 24;19(1):23
BMC biotechnology 2019 Apr 24;19(1):23
Improving hematopoietic recovery through modeling and modulation of the mesenchymal stromal cell secretome.
Liu FD, Tam K, Pishesha N, Poon Z, Van Vliet KJ
Stem cell research & therapy 2018 Oct 24;9(1):268
Stem cell research & therapy 2018 Oct 24;9(1):268
BNIP3/Bcl-2-mediated apoptosis induced by cyclic tensile stretch in human cartilage endplate-derived stem cells.
Yuan C, Pu L, He Z, Wang J
Experimental and therapeutic medicine 2018 Jan;15(1):235-241
Experimental and therapeutic medicine 2018 Jan;15(1):235-241
A Human IPS Model Implicates Embryonic B-Myeloid Fate Restriction as Developmental Susceptibility to B Acute Lymphoblastic Leukemia-Associated ETV6-RUNX1.
Böiers C, Richardson SE, Laycock E, Zriwil A, Turati VA, Brown J, Wray JP, Wang D, James C, Herrero J, Sitnicka E, Karlsson S, Smith AJH, Jacobsen SEW, Enver T
Developmental cell 2018 Feb 5;44(3):362-377.e7
Developmental cell 2018 Feb 5;44(3):362-377.e7
Human umbilical cord-derived mesenchymal stem cells ameliorate the enteropathy of food allergies in mice.
Yan N, Xu J, Zhao C, Wu Y, Gao F, Li C, Zhou W, Xiao T, Zhou X, Shao Q, Xia S
Experimental and therapeutic medicine 2018 Dec;16(6):4445-4456
Experimental and therapeutic medicine 2018 Dec;16(6):4445-4456
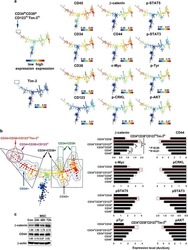
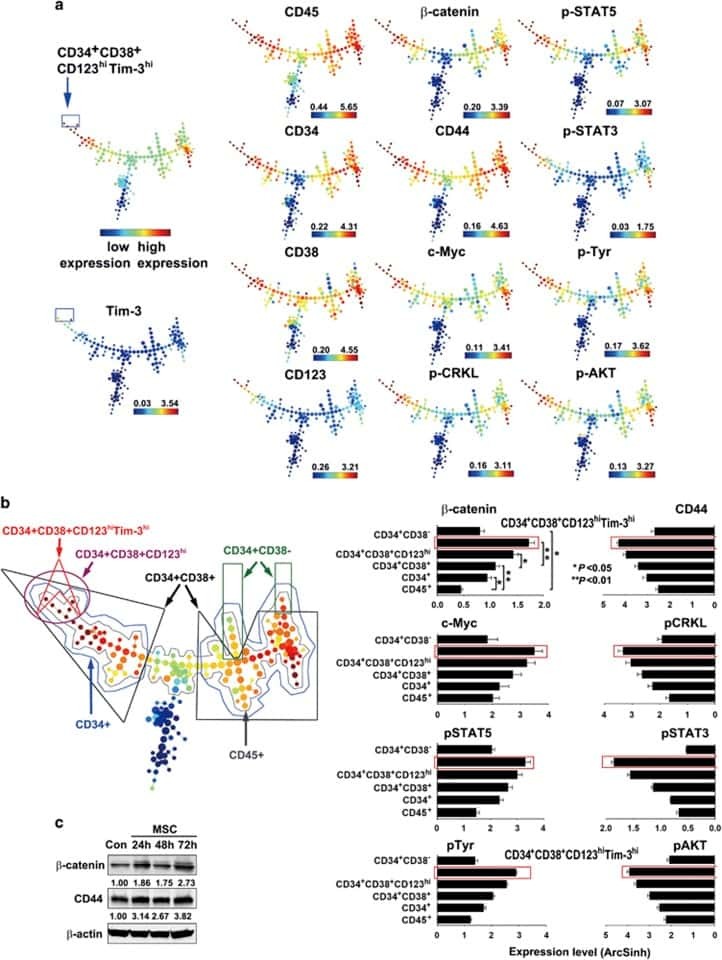
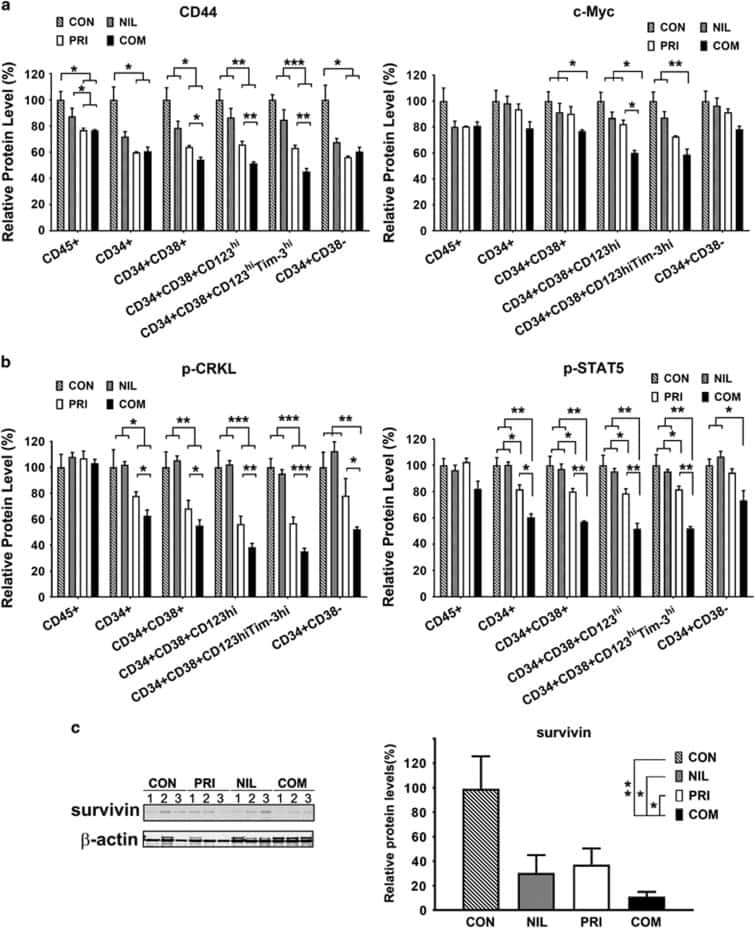
Combined inhibition of β-catenin and Bcr-Abl synergistically targets tyrosine kinase inhibitor-resistant blast crisis chronic myeloid leukemia blasts and progenitors in vitro and in vivo.
Zhou H, Mak PY, Mu H, Mak DH, Zeng Z, Cortes J, Liu Q, Andreeff M, Carter BZ
Leukemia 2017 Oct;31(10):2065-2074
Leukemia 2017 Oct;31(10):2065-2074
Vitamin C plus hydrogel facilitates bone marrow stromal cell-mediated endometrium regeneration in rats.
Yang H, Wu S, Feng R, Huang J, Liu L, Liu F, Chen Y
Stem cell research & therapy 2017 Nov 21;8(1):267
Stem cell research & therapy 2017 Nov 21;8(1):267
A high-yield isolation and enrichment strategy for human lung microvascular endothelial cells.
Gaskill C, Majka SM
Pulmonary circulation 2017 Mar;7(1):108-116
Pulmonary circulation 2017 Mar;7(1):108-116
Human umbilical cord mesenchymal stem cells improve the reserve function of perimenopausal ovary via a paracrine mechanism.
Li J, Mao Q, He J, She H, Zhang Z, Yin C
Stem cell research & therapy 2017 Mar 9;8(1):55
Stem cell research & therapy 2017 Mar 9;8(1):55
Etanercept-Synthesising Mesenchymal Stem Cells Efficiently Ameliorate Collagen-Induced Arthritis.
Park N, Rim YA, Jung H, Kim J, Yi H, Kim Y, Jang Y, Jung SM, Lee J, Kwok SK, Park SH, Ju JH
Scientific reports 2017 Jan 13;7:39593
Scientific reports 2017 Jan 13;7:39593
Human Induced Pluripotent Stem Cell-Derived Macrophages Share Ontogeny with MYB-Independent Tissue-Resident Macrophages.
Buchrieser J, James W, Moore MD
Stem cell reports 2017 Feb 14;8(2):334-345
Stem cell reports 2017 Feb 14;8(2):334-345
Activation of KLF1 Enhances the Differentiation and Maturation of Red Blood Cells from Human Pluripotent Stem Cells.
Yang CT, Ma R, Axton RA, Jackson M, Taylor AH, Fidanza A, Marenah L, Frayne J, Mountford JC, Forrester LM
Stem cells (Dayton, Ohio) 2017 Apr;35(4):886-897
Stem cells (Dayton, Ohio) 2017 Apr;35(4):886-897
A Member of the Nuclear Receptor Superfamily, Designated as NR2F2, Supports the Self-Renewal Capacity and Pluripotency of Human Bone Marrow-Derived Mesenchymal Stem Cells.
Zhu N, Wang H, Wang B, Wei J, Shan W, Feng J, Huang H
Stem cells international 2016;2016:5687589
Stem cells international 2016;2016:5687589
A Simplified Method for the Aspiration of Bone Marrow from Patients Undergoing Hip and Knee Joint Replacement for Isolating Mesenchymal Stem Cells and In Vitro Chondrogenesis.
Juneja SC, Viswanathan S, Ganguly M, Veillette C
Bone marrow research 2016;2016:3152065
Bone marrow research 2016;2016:3152065
Microvesicles from Mesenchymal Stromal Cells Are Involved in HPC-Microenvironment Crosstalk in Myelodysplastic Patients.
Muntión S, Ramos TL, Diez-Campelo M, Rosón B, Sánchez-Abarca LI, Misiewicz-Krzeminska I, Preciado S, Sarasquete ME, de Las Rivas J, González M, Sánchez-Guijo F, Del Cañizo MC
PloS one 2016;11(2):e0146722
PloS one 2016;11(2):e0146722
CRISPR/Cas9-based genetic correction for recessive dystrophic epidermolysis bullosa.
Webber BR, Osborn MJ, McElroy AN, Twaroski K, Lonetree CL, DeFeo AP, Xia L, Eide C, Lees CJ, McElmurry RT, Riddle MJ, Kim CJ, Patel DD, Blazar BR, Tolar J
NPJ Regenerative medicine 2016;1:16014-
NPJ Regenerative medicine 2016;1:16014-
Enforced Expression of HOXB4 in Human Embryonic Stem Cells Enhances the Production of Hematopoietic Progenitors but Has No Effect on the Maturation of Red Blood Cells.
Jackson M, Ma R, Taylor AH, Axton RA, Easterbrook J, Kydonaki M, Olivier E, Marenah L, Stanley EG, Elefanty AG, Mountford JC, Forrester LM
Stem cells translational medicine 2016 Aug;5(8):981-90
Stem cells translational medicine 2016 Aug;5(8):981-90
Human adipose-derived stem cells partially rescue the stroke syndromes by promoting spatial learning and memory in mouse middle cerebral artery occlusion model.
Zhou F, Gao S, Wang L, Sun C, Chen L, Yuan P, Zhao H, Yi Y, Qin Y, Dong Z, Cao L, Ren H, Zhu L, Li Q, Lu B, Liang A, Xu GT, Zhu H, Gao Z, Ma J, Xu J, Chen X
Stem cell research & therapy 2015 May 9;6(1):92
Stem cell research & therapy 2015 May 9;6(1):92
Functional plasticity of the N-methyl-d-aspartate receptor in differentiating human erythroid precursor cells.
Hänggi P, Telezhkin V, Kemp PJ, Schmugge M, Gassmann M, Goede JS, Speer O, Bogdanova A
American journal of physiology. Cell physiology 2015 Jun 15;308(12):C993-C1007
American journal of physiology. Cell physiology 2015 Jun 15;308(12):C993-C1007
Differences in the Osteogenic Differentiation Capacity of Omental Adipose-Derived Stem Cells in Obese Patients With and Without Metabolic Syndrome.
Oliva-Olivera W, Leiva Gea A, Lhamyani S, Coín-Aragüez L, Alcaide Torres J, Bernal-López MR, García-Luna PP, Morales Conde S, Fernández-Veledo S, El Bekay R, Tinahones FJ
Endocrinology 2015 Dec;156(12):4492-501
Endocrinology 2015 Dec;156(12):4492-501
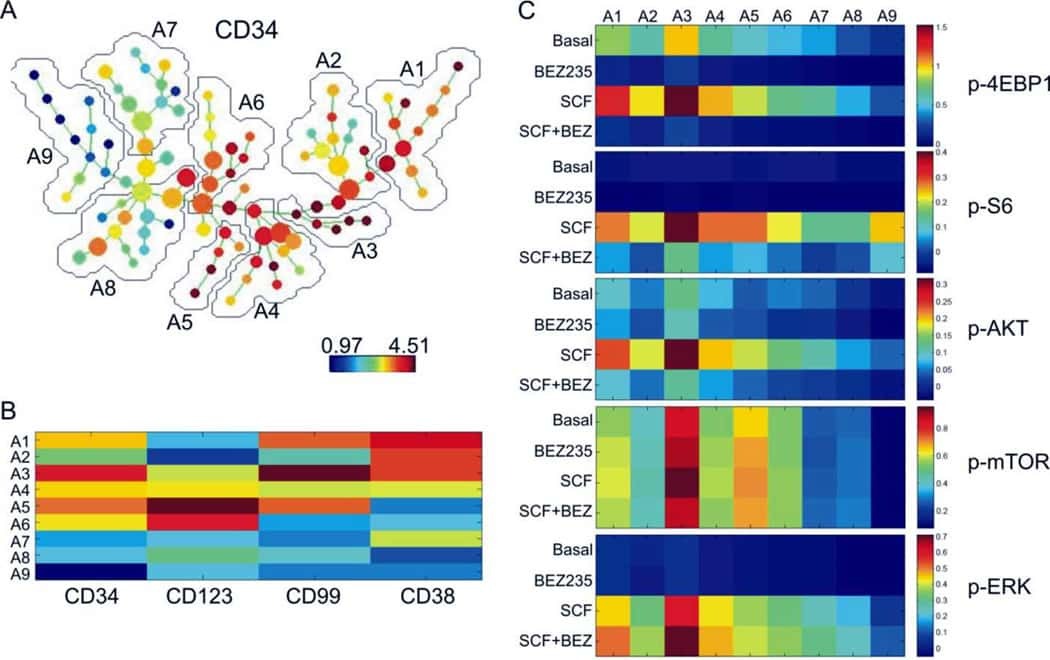
Single-cell mass cytometry reveals intracellular survival/proliferative signaling in FLT3-ITD-mutated AML stem/progenitor cells.
Han L, Qiu P, Zeng Z, Jorgensen JL, Mak DH, Burks JK, Schober W, McQueen TJ, Cortes J, Tanner SD, Roboz GJ, Kantarjian HM, Kornblau SM, Guzman ML, Andreeff M, Konopleva M
Cytometry. Part A : the journal of the International Society for Analytical Cytology 2015 Apr;87(4):346-56
Cytometry. Part A : the journal of the International Society for Analytical Cytology 2015 Apr;87(4):346-56
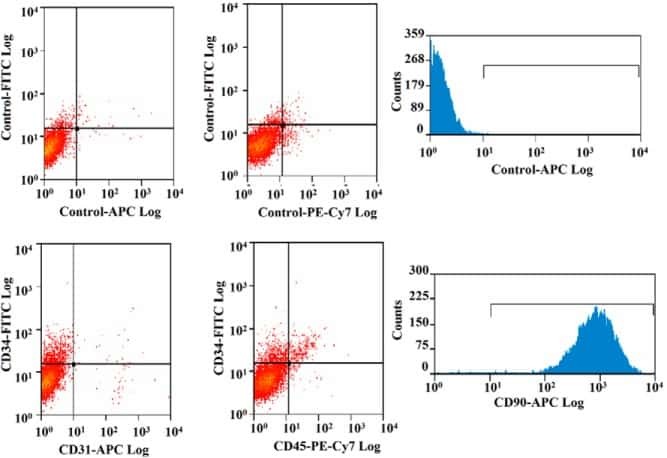
Reprogramming human endothelial cells to haematopoietic cells requires vascular induction.
Sandler VM, Lis R, Liu Y, Kedem A, James D, Elemento O, Butler JM, Scandura JM, Rafii S
Nature 2014 Jul 17;511(7509):312-8
Nature 2014 Jul 17;511(7509):312-8
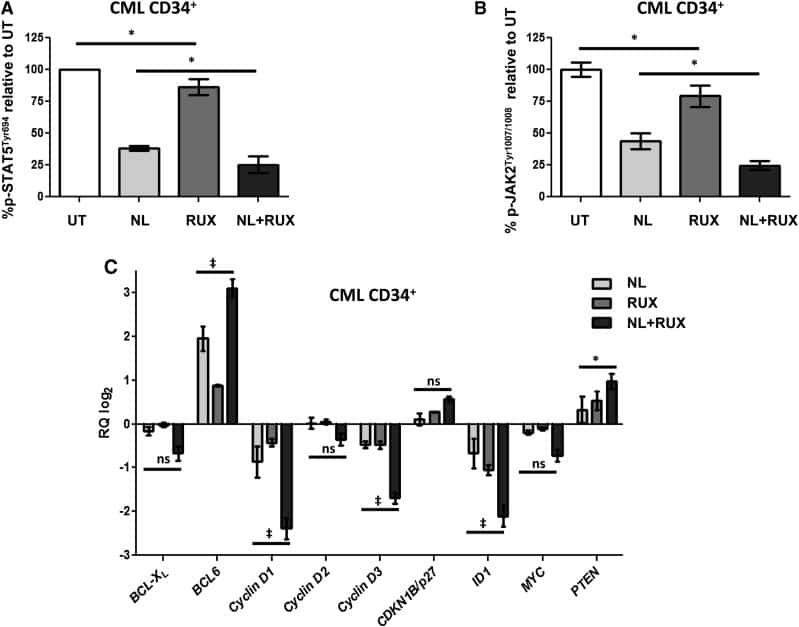
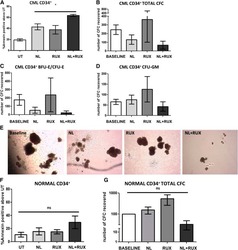
JAK2/STAT5 inhibition by nilotinib with ruxolitinib contributes to the elimination of CML CD34+ cells in vitro and in vivo.
Gallipoli P, Cook A, Rhodes S, Hopcroft L, Wheadon H, Whetton AD, Jørgensen HG, Bhatia R, Holyoake TL
Blood 2014 Aug 28;124(9):1492-501
Blood 2014 Aug 28;124(9):1492-501
Microvesicles derived from human umbilical cord Wharton's jelly mesenchymal stem cells attenuate bladder tumor cell growth in vitro and in vivo.
Wu S, Ju GQ, Du T, Zhu YJ, Liu GH
PloS one 2013;8(4):e61366
PloS one 2013;8(4):e61366
Terminal differentiation and loss of tumorigenicity of human cancers via pluripotency-based reprogramming.
Zhang X, Cruz FD, Terry M, Remotti F, Matushansky I
Oncogene 2013 May 2;32(18):2249-60, 2260.e1-21
Oncogene 2013 May 2;32(18):2249-60, 2260.e1-21
Colony-stimulating factor-1 mediates macrophage-related neural damage in a model for Charcot-Marie-Tooth disease type 1X.
Groh J, Weis J, Zieger H, Stanley ER, Heuer H, Martini R
Brain : a journal of neurology 2012 Jan;135(Pt 1):88-104
Brain : a journal of neurology 2012 Jan;135(Pt 1):88-104
No comments: Submit comment
Supportive validation
- Submitted by
- Invitrogen Antibodies (provider)
- Main image

- Experimental details
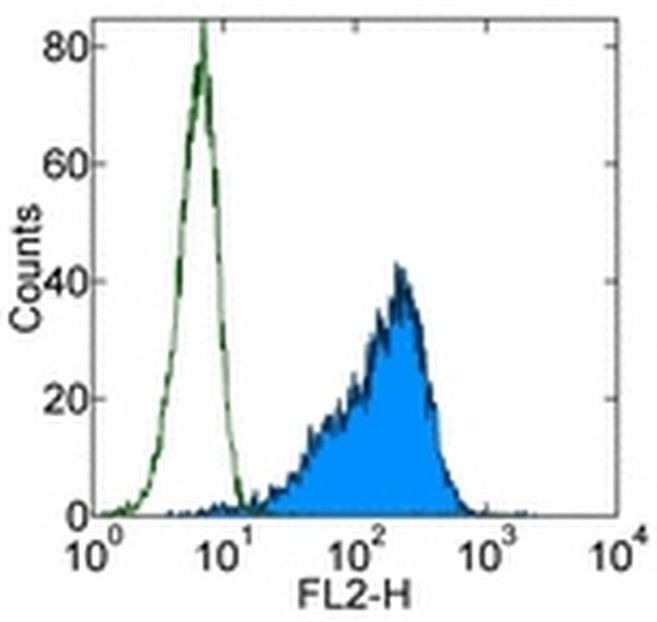
- Staining of TF-1 cell line with 0.25 µg of Mouse IgG1 K Isotype Control Purified (Product # 14-4714-82) (open histogram) or 0.25 µg of Anti-Human CD34 Purified (filled histogram) followed by F (ab')2 Anti-Mouse IgG PE (Product # 12-4012). Total viable cells were used for analysis.

- Submitted by
- Invitrogen Antibodies (provider)
- Main image

- Experimental details
- Staining of TF-1 cell line with 0.25 µg of Mouse IgG1 K Isotype Control Purified (Product # 14-4714-82) (open histogram) or 0.25 µg of Anti-Human CD34 Purified (filled histogram) followed by F (ab')2 Anti-Mouse IgG PE (Product # 12-4012). Total viable cells were used for analysis.
Supportive validation
- Submitted by
- Invitrogen Antibodies (provider)
- Main image

- Experimental details
- NULL
- Submitted by
- Invitrogen Antibodies (provider)
- Main image
- Experimental details
- NULL

- Submitted by
- Invitrogen Antibodies (provider)
- Main image

- Experimental details
- NULL
- Submitted by
- Invitrogen Antibodies (provider)
- Main image
- Experimental details
- NULL
- Submitted by
- Invitrogen Antibodies (provider)
- Main image

- Experimental details
- NULL
- Submitted by
- Invitrogen Antibodies (provider)
- Main image
- Experimental details
- NULL
- Submitted by
- Invitrogen Antibodies (provider)
- Main image

- Experimental details
- NULL
- Submitted by
- Invitrogen Antibodies (provider)
- Main image
- Experimental details
- NULL
- Submitted by
- Invitrogen Antibodies (provider)
- Main image
- Experimental details
- NULL
- Submitted by
- Invitrogen Antibodies (provider)
- Main image

- Experimental details
- NULL
- Submitted by
- Invitrogen Antibodies (provider)
- Main image
- Experimental details
- NULL
- Submitted by
- Invitrogen Antibodies (provider)
- Main image
- Experimental details
- Figure 2 hWJMSC-MVs surface expressed molecules analysis. Flow cytometery analysis showed hWJMSC-MVs were positive for some surface expressed molecules typically expressed by MSCs, such as CD9, CD44, CD63, CD73, and negative for CD34, CD45.

- Submitted by
- Invitrogen Antibodies (provider)
- Main image
- Experimental details
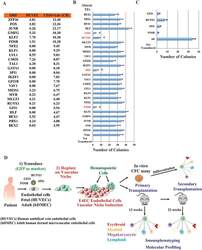
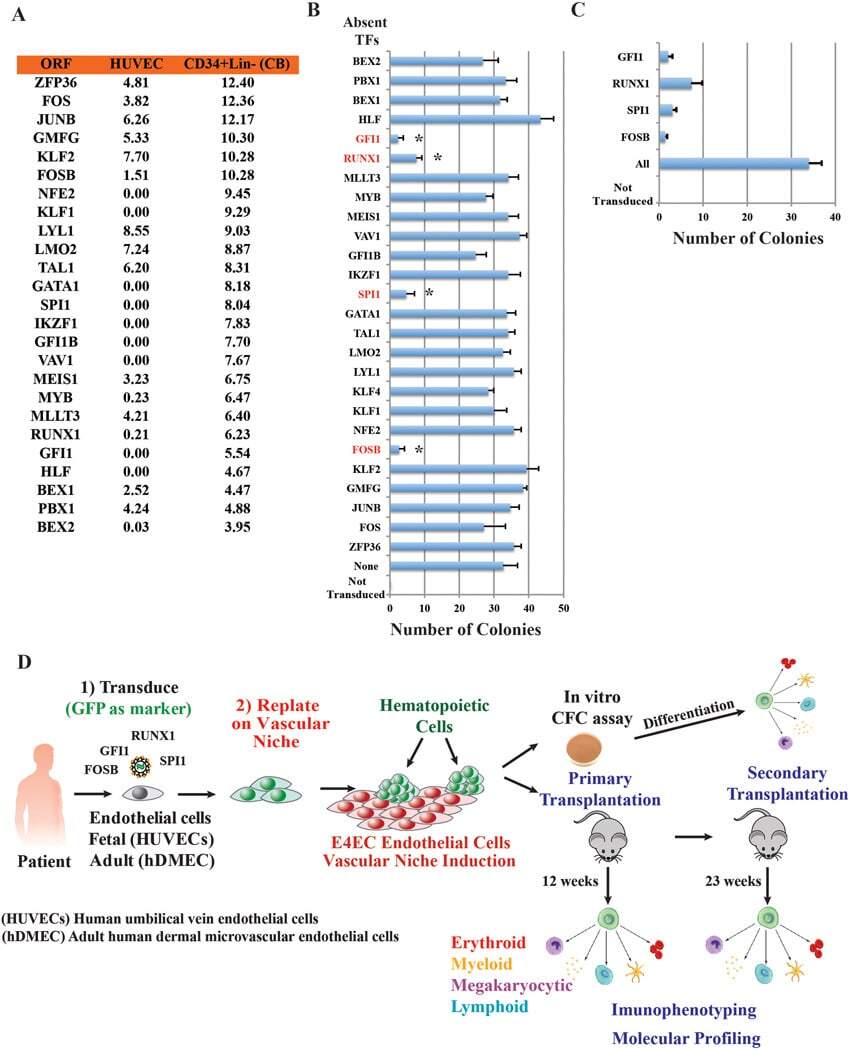
- Extended Data Figure 6 Conditional expression of FGRS is sufficient for optimal generation of rEC-hMPPs with multilineage potential, including T-Cell lymphoid cells A to C: Conditional expression of mouse inducible FGRS factors activates endogenous human FGRS in HUVECs sustaining functional hematopoietic cell fate of rEC-hMPPs. A . To test whether FGRS-induced reprogramming triggered expression of endogenous FGRS genes , HUVECs were transduced with lentivirus expressing FGRS-Tet-On and a trans-activator, and grown on E4EC-vascular niche for 18-22 days (n=4) in the presence of doxycycline. Doxycycline was removed from the culture medium after 18-22 days to shut off the expression of mouse FGRS and cells were cultured for additional 7-10 days. Human CD45 + CD34 + cells were FACS isolated for CFC assay and whole-transcriptome deep sequencing (RNA-seq). CFC assay revealed emergence of hematopoietic colonies with cells expressing human CD235, CD11b, CD83, and CD14. B . Comparison of transcriptional profiles of the human FGRS expression in human HUVECs, hCD45 + rEC-hMPPs programmed using inducible mouse FGRS, CD45 + CD34 + rEC-hMPPs, 22 weeks post-transplantation, hDMEC-derived CD45 + CD34 + rEC - hMPPs after 15 weeks post-secondary engraftment and naive CD34 + Lin + cells purified from cord blood. C . Analysis of whole-transcriptome RNA-Seq of rEC-hMPPs derived using inducible mouse FGRS (n=3). All RNA-Seq reads were aligned against human and mouse FGRS sequences. RNA-Seq reads th
- Submitted by
- Invitrogen Antibodies (provider)
- Main image

- Experimental details
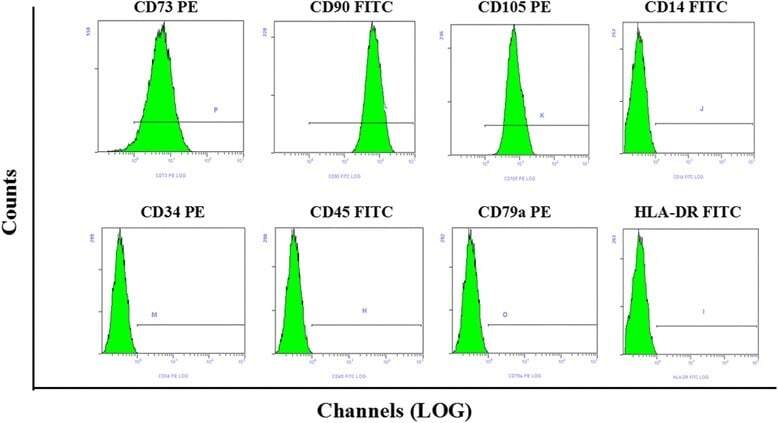
- Fig. 1 Flow cytometry analysis of phenotype characterization of hUCMSCs. Phenotype of CD73, CD90, CD105, CD14, CD34, CD45, CD79a and HLA-DR of hUCMSCs was detected by flow cytometry. Intensity >= 95% represented strong expression while
- Submitted by
- Invitrogen Antibodies (provider)
- Main image
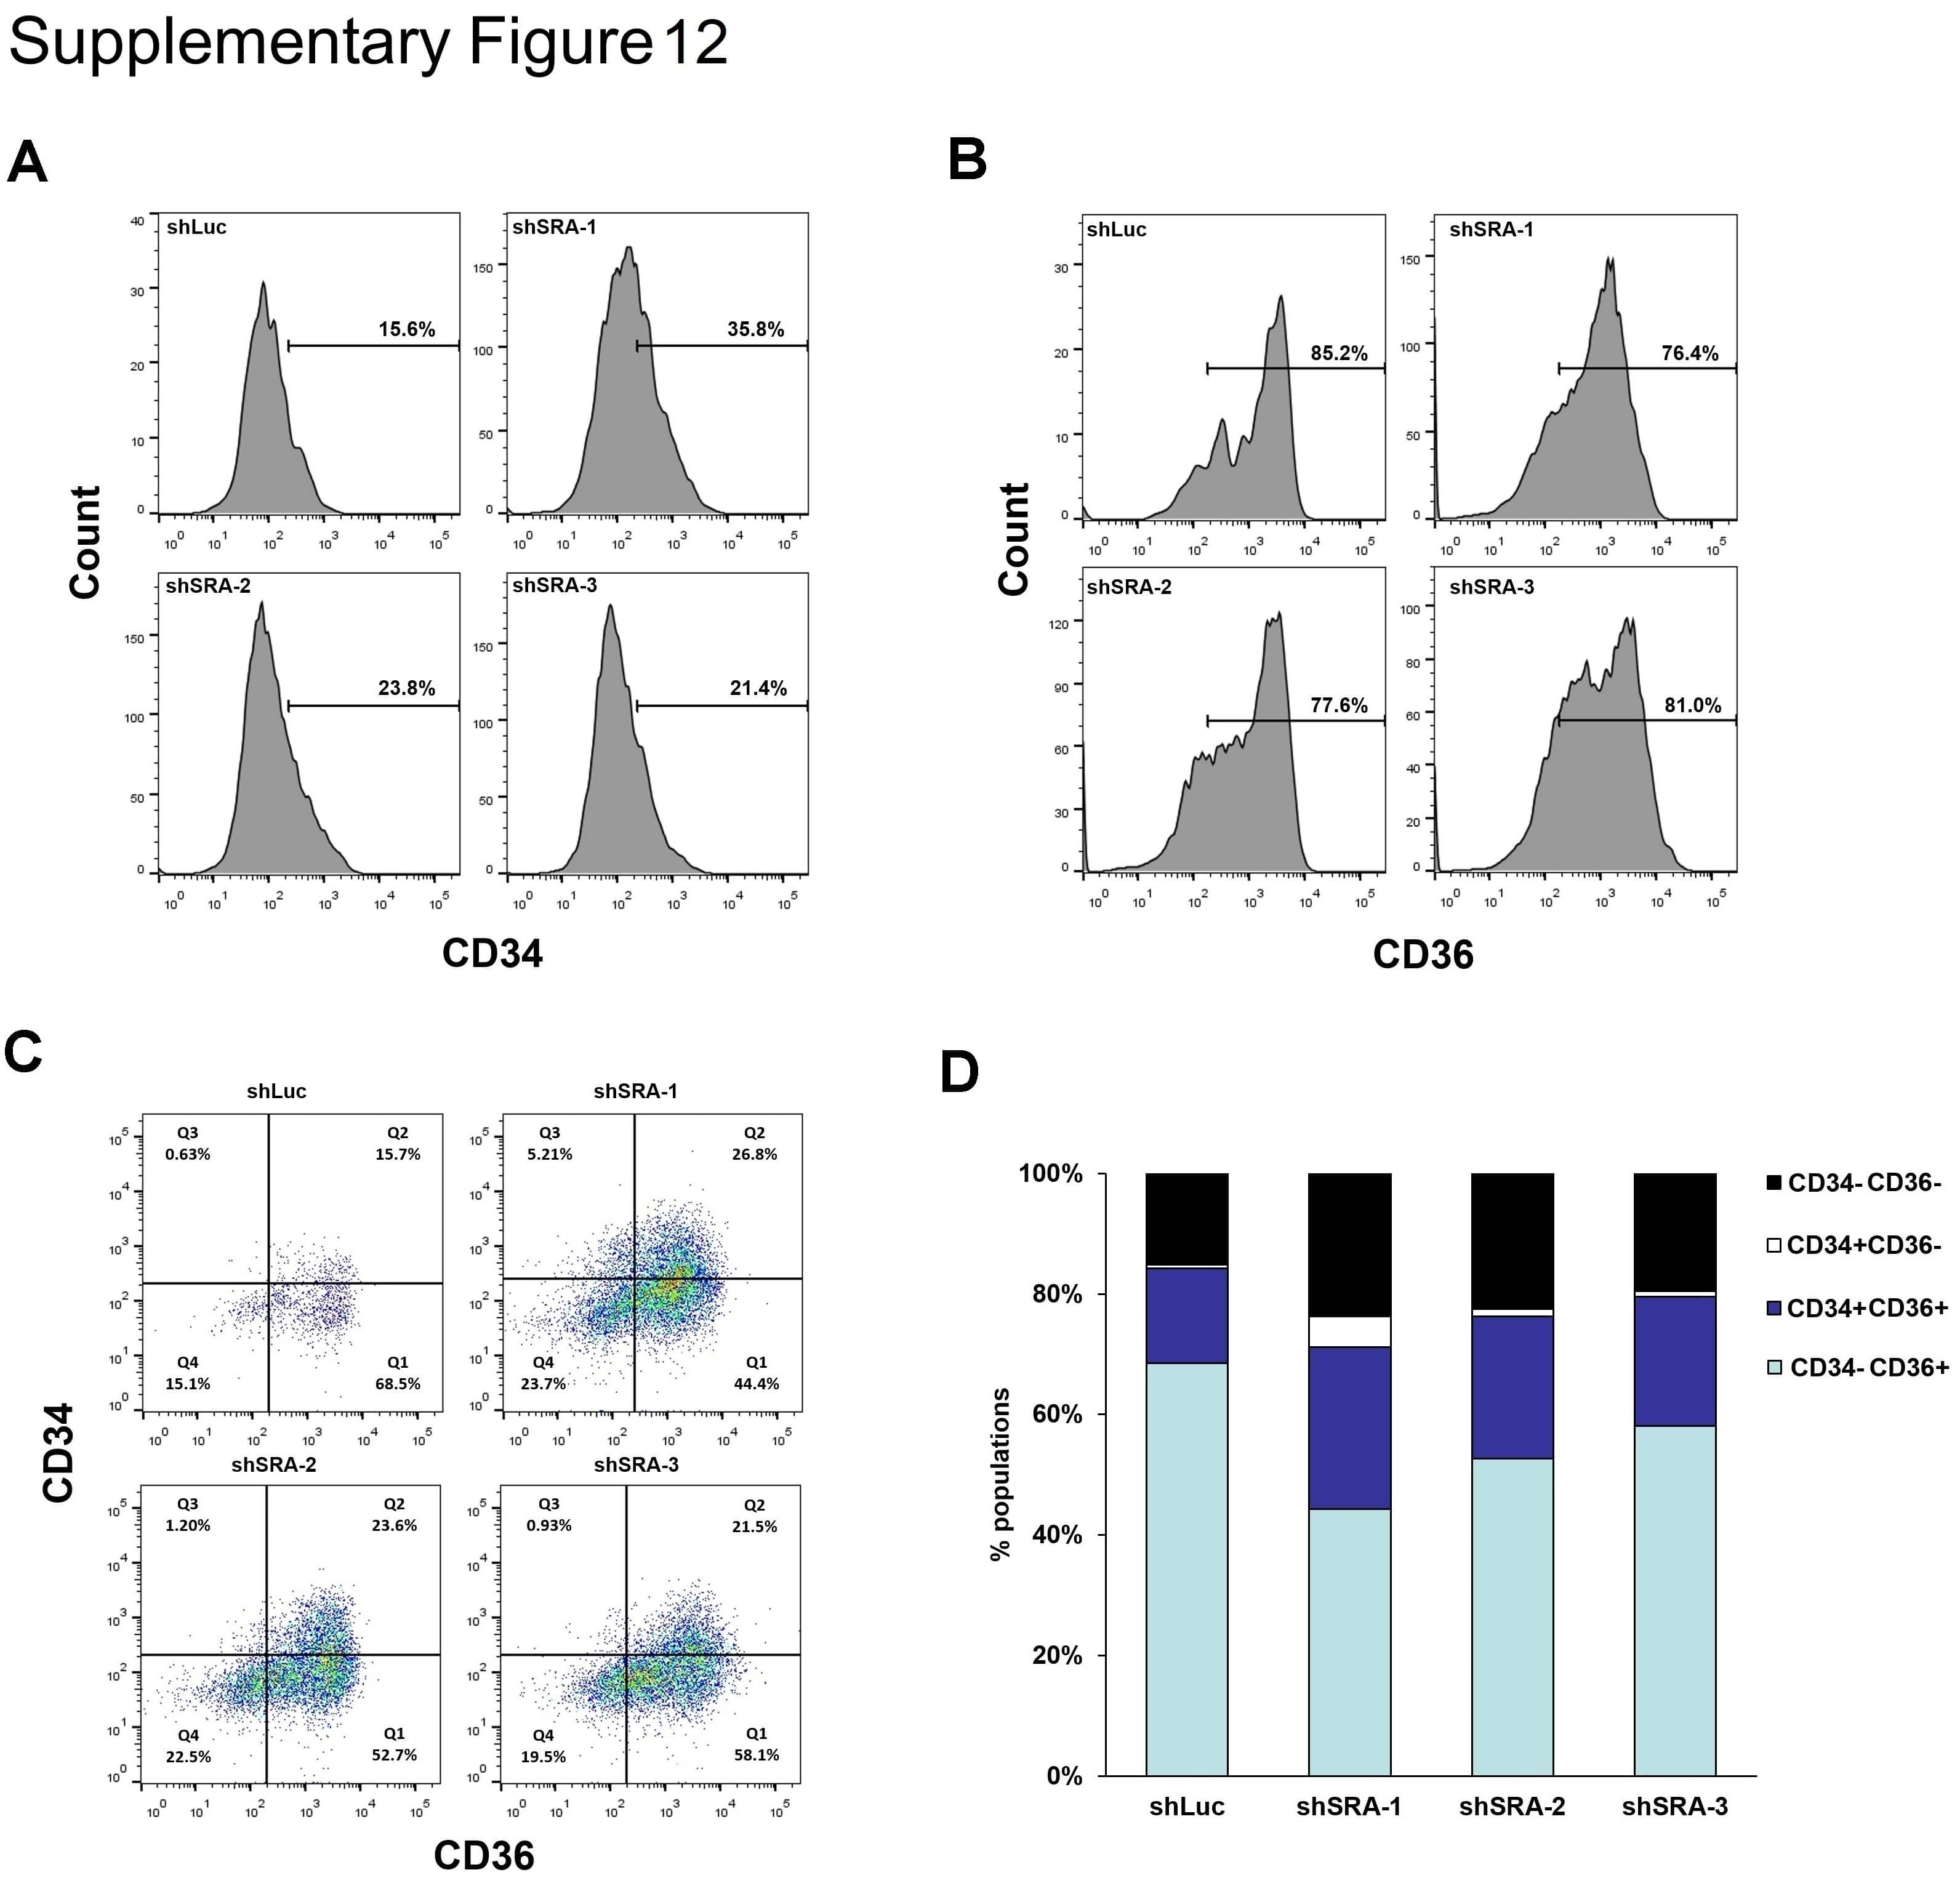
- Experimental details
- Figure 1. Immunophenotypic profile of cultured cartilage endplate-derived stem cells. The blue lines represent the fluorescence intensity of cells stained with the indicated antibodies and the red lines represent the negative controls cells, which were stained with a non-immunoreactive isotype control antibody. FITC, fluorescein isothiocyanate; PerCP, peridinin chlorophyll; PE, phycoerythrin; HLA-DR, human leukocyte antigen-antigen D related.
- Submitted by
- Invitrogen Antibodies (provider)
- Main image
- Experimental details
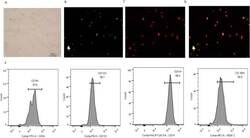
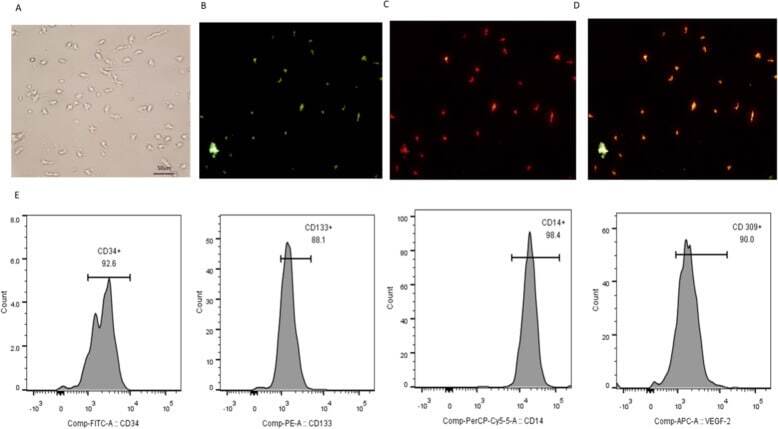
- Fig. 1 Identification of EPCs. a Adherent cells grew in a blood island manner. Fluorescent staining of EPCs. b Adherent cells took up UEA-1-lectin. c Adherent cells took up Dil-Ac-LDL. d Adherent cells took up UEA-1-lectin and Dil-Ac-LDL. E. Surface molecular markers of EPCs. Adherent cells expressed CD34, CD133, CD14 and VEGFR-2. All experiments involving cell culture studies were repeated three times with three replicates per experiment
- Submitted by
- Invitrogen Antibodies (provider)
- Main image
- Experimental details
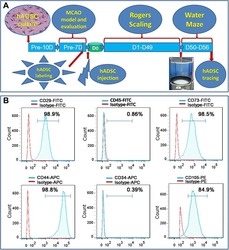
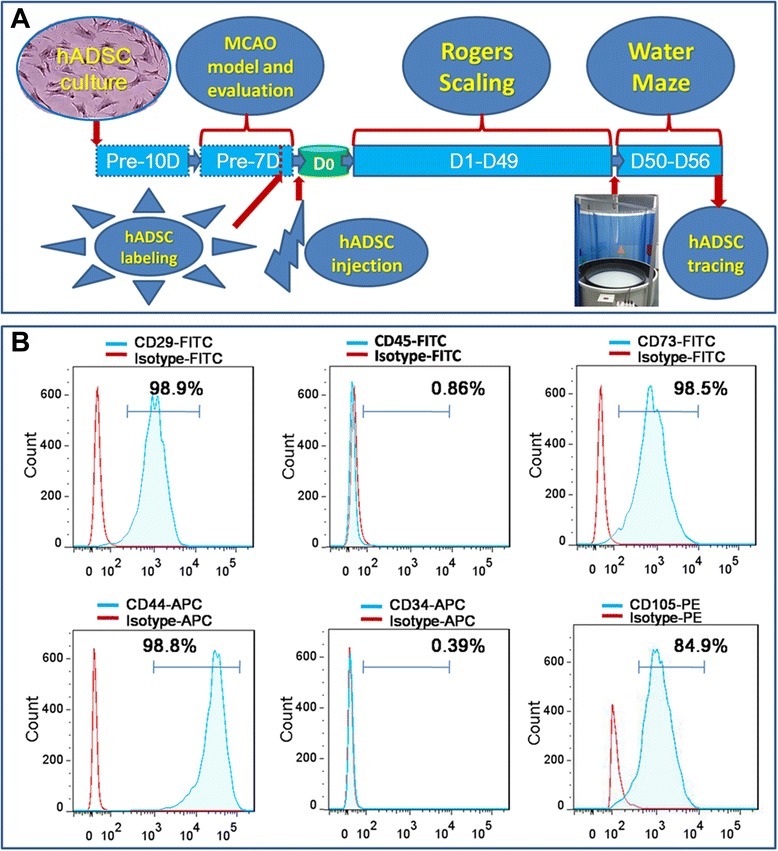
- Figure 1 Experimental diagram (A) , hADSC surface antigen profiling with FACS showed that hADSCs positively express CD29, CD44, CD73 and CD105, negatively express CD34 and CD45 (B) . FACS, flow activated cell sorting; hADSCs, human adipose-derived stem cells.
- Submitted by
- Invitrogen Antibodies (provider)
- Main image
- Experimental details
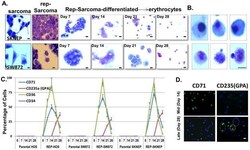
- Figure 3 (A) Morphological comparison of sarcomas, reprogrammed sarcomas, and reprogrammed sarcomas at days 7, 14, 21 and 28 of an erythroid differentiation protocol. Scale bars=10uM. (B) Individual cells on the verge of enucleation from day 28 erythroid differentiation cultures. Scale bars=5uM. The original magnification for all panels in A were x200; and x1000 for B. (C) Percentage of cells from HOS, SW872, SKNEP, Rep-HOS, Rep-SW872, and Rep-SKNEP cultures undergoing erythroid differentiation expressing CD71, CD235a (GPA), CD36, and CD34. Error bars=standard deviation. (D) CD71 and CD235(GPA) immunofluorescence in reprogrammed SW872 cells after 14 and 28 days of erythroid differentiation. green circle=CD235a+/DAPI+; blue circle=CD235-/DAPI+; yellow circle=CD235a+/DAPI-. Scale bars=10um.

- Submitted by
- Invitrogen Antibodies (provider)
- Main image
- Experimental details
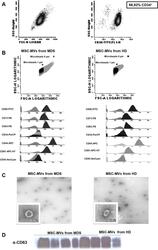
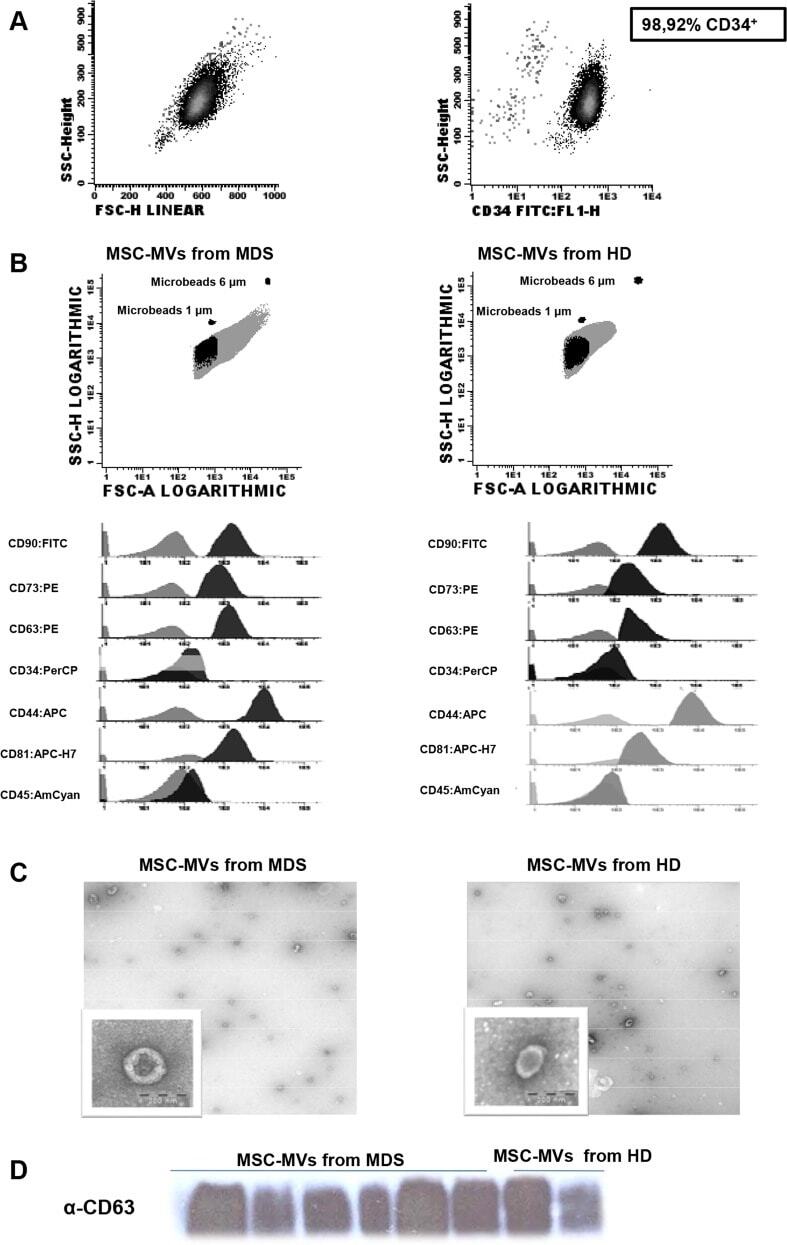
- Fig 1 Characterization of CD34 + cells from leukapheresis of HD. (A) Percentage of CD34 + cells isolated by immunomagnetic beads and the purity determined by flow cytometry. (B) Flow cytometry characterization of MVs released from MSCs of MDS and HD. The upper images are dot-plots of forward and side scatter of MVs. The gate was defined as elements of smaller size than the 1mum beads. The histograms represent the MVs stained with negative (CD34 and CD45) and positive markers for MVs from HD and MDS-MSC (CD90, CD44, CD73) and for MVs markers (CD81 and CD63). Controls (unstained MVs) are shown in gray; the MVs stained with the different antibodies are shown in black. Images on the left are those of the MVs from MSC-HD, while those on the right images are of the MVs from MSC-MDS. (C) Representative images of transmission electronic microscopy of MVs released by MSC from HD(left) and MDS (right) as revealed by TEM. Scale bar, 200nm. Original magnification: x 8000. (D) MVs characterization by Western Blot assay for the expression of CD63. HD-MVs: microvesicles from healthy donors. MDS-MVs: microvesicles from patients with myelodysplastic syndrome.
- Submitted by
- Invitrogen Antibodies (provider)
- Main image
- Experimental details
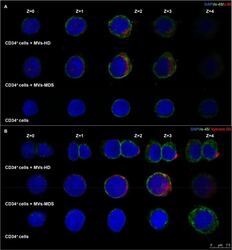
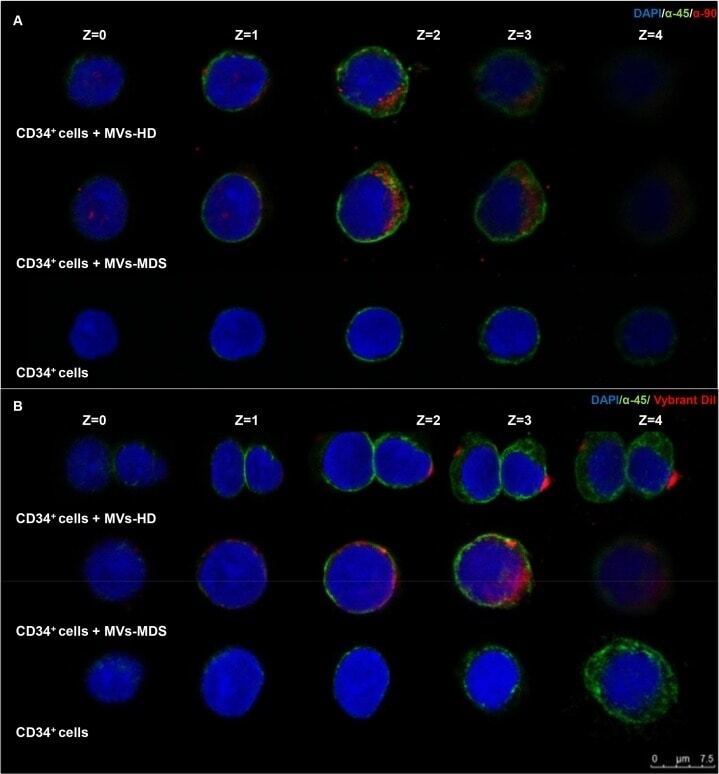
- Fig 3 Incorporation of MVs from MSC-MDS and MSC-HD into CD34 + cells. (A) Representative images of MVs incorporation by CD34 + cells stained with anti-CD90 Ab (red) and anti-CD45 Ab (green). (B) Representative images of MVs previously labeled with Vybrant-Dil cell-labeling solution (red) that were incorporated into CD34 + cells and stained with anti-CD45 Ab (green). (A-B) Images in the top row are from CD34 + cells that incorporated the MVs released from MSC-HD. Images on the middle row show the incorporation of MVs released from MSC-MDS. In the lower row, images of the CD34 + cells (without incorporation) are shown. Nuclei were counterstained with DAPI (blue). Scale bar, 7.5mum. Revealed by confocal microscopy and acquired in layers (z-Stacks) of 1mum.
- Submitted by
- Invitrogen Antibodies (provider)
- Main image
- Experimental details
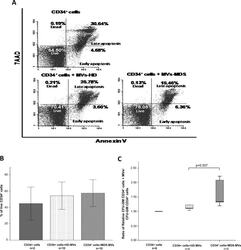
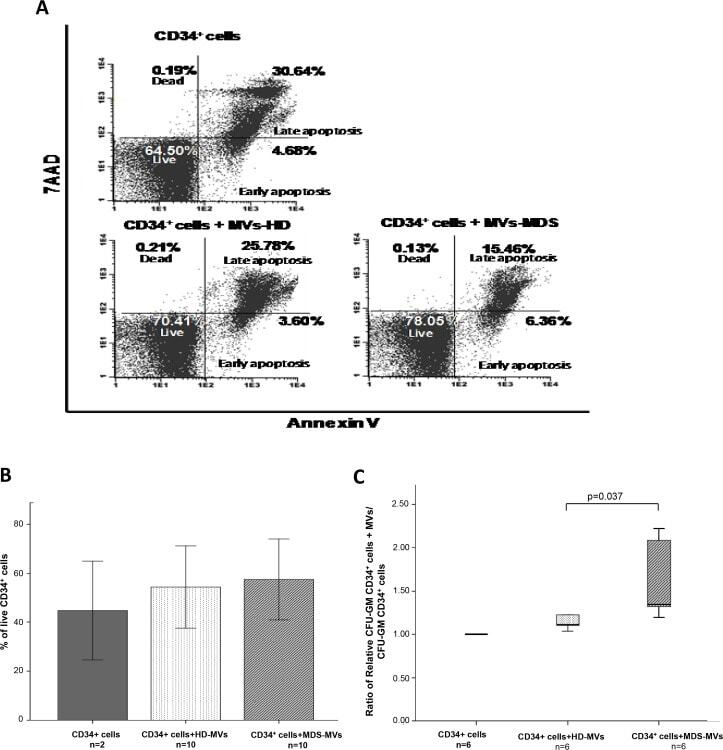
- Fig 5 MVs content incorporation results in CD34 + cells behavior modification. (A): Representative FACS plots of annexinV/7AAD staining on CD34 + cells with and without MVs. Percentage of each subset (dead, live, early and late apoptosis) within the total number of CD34 + cells. (B) Percentage of live CD34 + cells. An increase on the percentage of CD34 + viable cells (annexinV - /7AAD - ) was observed when cells were cultured with MDS-MVs compared with the other groups is shown. (C) Clonogenic assays. Results are expressed as the ratio between CFU-GM obtained with CD34 + cells that had been cultured with MVs and CD34 + cells without MVs.
- Submitted by
- Invitrogen Antibodies (provider)
- Main image
- Experimental details
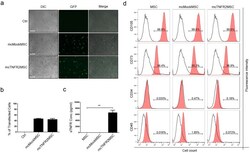
- Figure 2 Generation of mcTNFR2MSCs by transfection with mcTNFR2. ( a ) Fluorescence images showing the expression of GFP at 48 h after transfection. Expression of GFP was similar in mcMockMSCs and mcTNFR2MSCs. Experiment was repeated 4-6 times and the representative image is shown. Scale bars: 500 mum. ( b ) The transfection efficacy of mcMock and mcTNFR2 was measured by counting GFP+ cells. ( c ) Concentration of sTNFR2-Fc in the conditioned media of MSCs transfected with minicircles encoding sTNFR2-Fc (mean +- SEM). The conditioned media were removed 48 h post-transfection and analysed by an ELISA. The experiment was repeated three times with each conditioned media. ( d ) Characterisation of mcTNFR2MSCs. The percentage of cells expressing each MSC marker was analysed. The analysed plots represent the fluorescence intensity and cell number per fluorescence channel. Negative control (isotype control) fluorescence is plotted on each panel as a black line. CD105-PE-Cy7 and CD73-FITC were used as positive markers. CD34-APC and CD45-PE were used as negative markers. Each histogram is a representative result of at least three MSC, mcMockMSC and mcTNFR2MSC samples (*P < 0.01; **P < 0.005; ***P < 0.001).

- Submitted by
- Invitrogen Antibodies (provider)
- Main image
- Experimental details
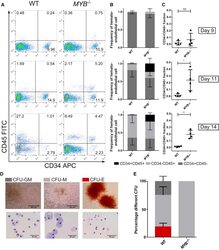
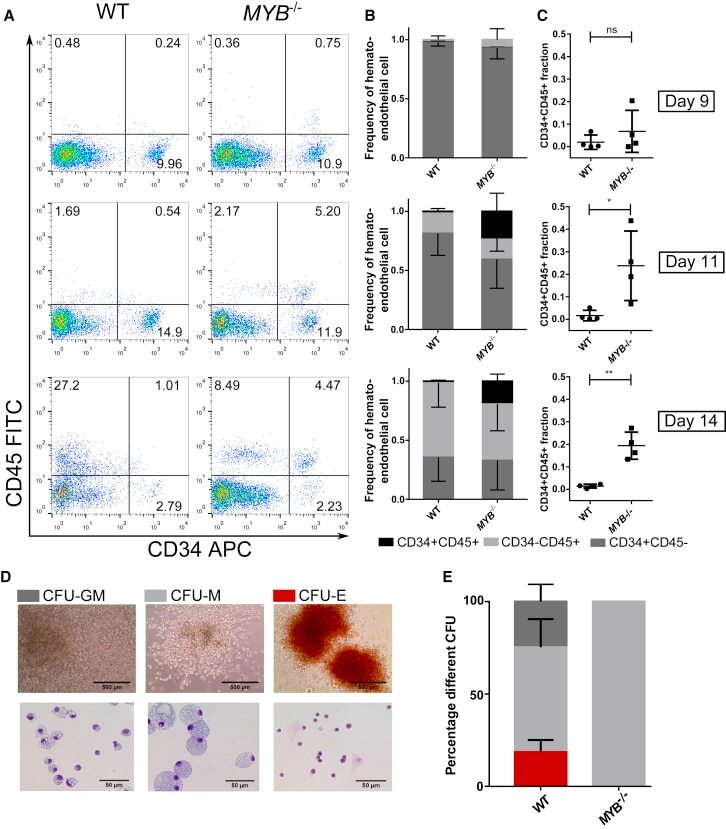
- Figure 4 Study of the Progenitor Cells within the iPSC-Derived EBs (A) Representative plots of day 9, 11, and 14 EBs of WT and MYB -/- iPSCs, which were enzymatically dissociated, stained for expression of CD34 and CD45, and analyzed by flow cytometry. Hemogenic and nonhemogenic-endothelial cells are CD34 + CD45 - , HPCs are CD34 + CD45 + , and differentiated hematopoietic cells are CD34 - CD45 + . (B) Relative proportion of CD34 + CD45 + , CD34 + CD45 - , and CD34 - CD45 + populations on day 9, 11, and 14 normalized to the total number of single- and double-positive cells. Mean and SD of four repeats are plotted. (C) Relative proportion of CD34 + CD45 + populations on day 9, 11, and 14. Statistical comparisons were done using a paired t test. ns, nonsignificant; * p < 0.05, ** p < 0.01. (D) Image of the different colony types. The images on the left show a bright-field image of representative CFU-E, CFU-M, and CFU-GM WT colonies in methylcellulose media at day 14, while the images on the right show the cytospined and eosin and methylene blue-stained cells present within the three different types of colony. (E) Dissociated day 14 EBs were plated into H4434 MethoCult; after 14 days, colonies were scored. The percentage of each type of colony is displayed as mean with SD (WT n = 5, MYB -/- n = 3 for each knockout clone). Presence of erythroid (CFU-E), granulocyte-macrophage (CFU-GM), and macrophage progenitors (CFU-M) can be detected in WT iPSC differentiation, whereas MYB -/-
- Submitted by
- Invitrogen Antibodies (provider)
- Main image
- Experimental details
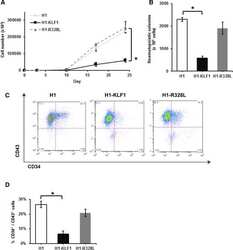
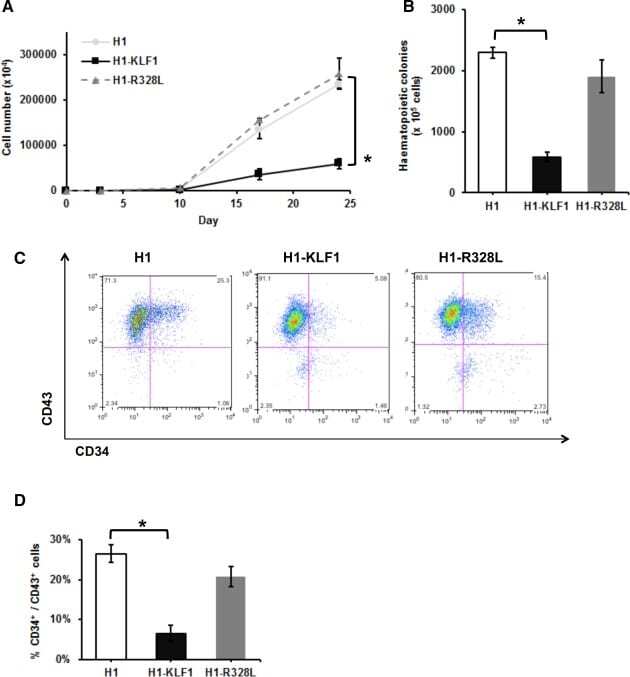
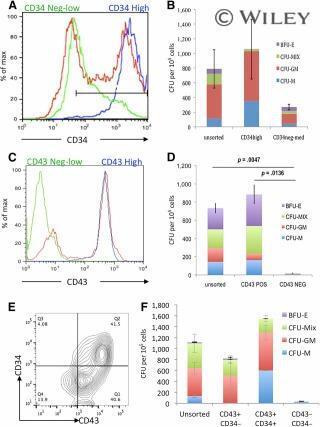
- Figure 1 Constitutive KLF1 expression in human embryonic stem cells (hESCs) results in reduced proliferation and hematopoietic progenitor cell production. ( A) : Cell counts throughout the erythroid differentiation protocol of control H1 hESCs (H1) and H1 hESCs transfected with a vector containing either wild type KLF1 (H1-KLF1) or the mutant form of KLF1 (H1-R328L). (B) : Total number of CFU-Cs generated from differentiating H1, H1-KLF1, and H1-R328L hESCs at day 10 of the differentiation protocol. (C) : Flow cytometry analysis of differentiating H1, H1-EKLF, and H1-R328L hESC at day 10 of the differentiation protocol using antibodies against CD34 and CD43 to mark hematopoietic progenitor cells (HPCs). (D) : Quantification flow cytometry data showing the %CD34 + /CD43 + HPCs at day 10 of the differentiation protocol. All data represents the mean of at least three independent experiments with error bars representing SEM. p values were calculated using two-way ANOVA followed by Tukey's multiple comparisons test (A) or one-way ANOVA followed by Holm-Sidak's multiple comparison test (B and D) (* p < .05).
- Submitted by
- Invitrogen Antibodies (provider)
- Main image
- Experimental details
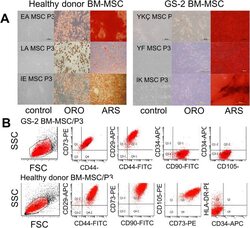
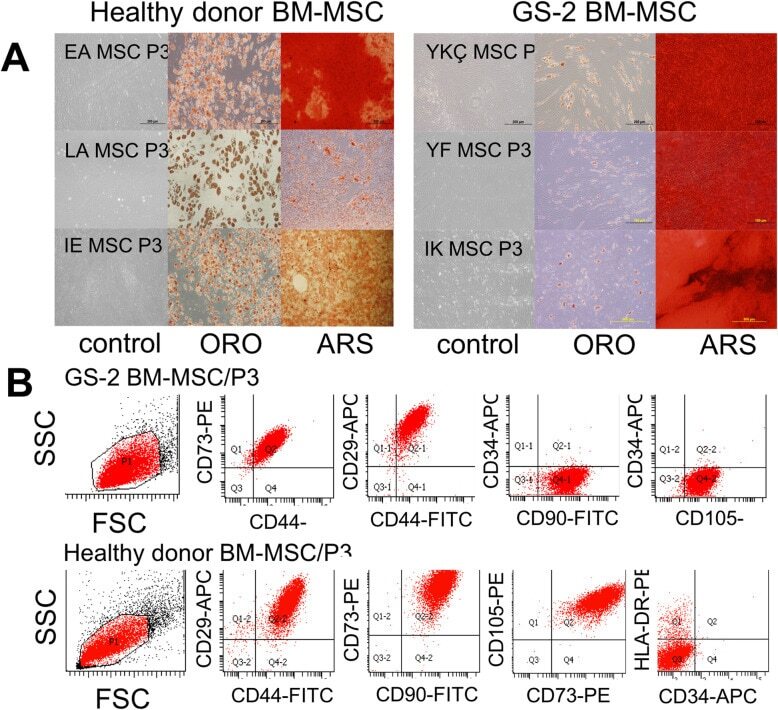
- Fig. 1 Characterization of a healthy donor and GS-2 BM-MSCs. a Morphology before and after differentiation of healthy donor (left, n =3) and GS-2 (right, n =3) BM-MSCs. MSCs were cultured in control medium (left lines) or adipogenic and osteogenic differentiation media for 21 days and were stained with Oil Red O (midline, ORO) for adipogenic differentiation and Alizarin Red S (right lines, ARS) for osteogenic differentiation. b Immunophenotype of a healthy donor and GS-2 BM-MSCs. Dot plots from representative BM-MSC samples of passage 3 GS-2 (upper lane) and healthy control (lower lane) BM-MSCs
- Submitted by
- Invitrogen Antibodies (provider)
- Main image
- Experimental details
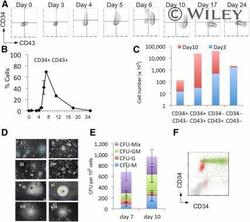
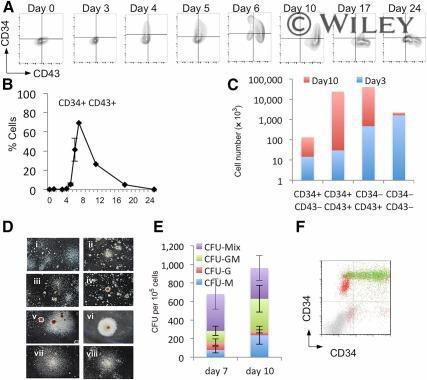
- Monitoring hematopoietic progenitor production throughout the differentiation protocol. Representative flow cytometry analysis of cells from days 0 to 24 of the differentiation protocol using antibodies against CD34 and CD43 (A) and the quantification of the percentage positive (B) was performed from at least three independent experiments. Absolute cell numbers of the differentiation represented in (A) are shown for days 3 and 10 (C) . Representative colonies generated from day 7 (Di-Div) and day 10 (Dv-Dviii) cells are shown, CFU-C activity having been assessed by methylcellulose assays on days 7 and 10 (E) . These data represent three independent experiments, and bars indicate the SEM. Flow cytometry analysis to assess the expression of Runx1C-GFP in the CD34/CD43 double-positive cell population; Runx1C-GFP + cells are shown in green and Runx1C-GFP - cells in red (F) . Original magnification x60. Abbreviations: CFU, colony-forming unit; G, granulocyte; GFP, green fluorescent protein; GM, granulocyte macrophage; M, macrophage; Q, quartile.
- Submitted by
- Invitrogen Antibodies (provider)
- Main image

- Experimental details
- CFU-C activity was enriched within the CD34 hi CD43 + cell population. CD34 + cells from day 7 cultures (A) and CD43 + cells from day 10 cultures (C) were sorted using magnetically activated cell sorting enrichment and reanalyzed by flow cytometry to assess purity (unsorted [red], enriched positive cells [blue], and flow-through low/negative cells [green]). Hematopoietic activity was quantified by plating these cell populations in CFU-C assays (B, D) . Day 10 cultures were stained for both CD34 and CD43 (E) and CD43 + /CD34 - , CD43 + /CD34 + double-positive, and CD43 - CD34 - double-negative cells were plated in CFU-C assays to quantify their hematopoietic activity (F) . Abbreviations: BFU-E, burst-forming unit erythroid; CFU, colony-forming unit; GM, granulocyte macrophage; M, monocyte; Max, maximum; MIX, mixed; NEG, negative; POS, positive; Q, quartile.
- Submitted by
- Invitrogen Antibodies (provider)
- Main image

- Experimental details
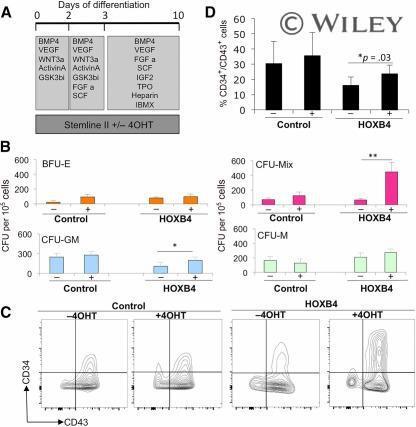
- Activation of HOXB4 enhanced the production of hematopoietic progenitors. Tamoxifen (labeled + or -) was added to cultures to activate HOXB4 in H1 human embryonic stem cells (hESCs) expressing HOXB4-ER T2 (labeled HOXB4) or parental H1 hESCs (labeled control) between days 0 and 10 (A) and then assessed for CFU-C activity (B) and expression of hematopoietic progenitor markers, CD34 and CD43, by flow cytometry (C, D) . Data were generated from four independent experiments, with error bars representing SEM. *, p = .03; **, p = .04. Abbreviations: 4OHT, tamoxifen; BFU-E, burst-forming unit erythroid; BMP4, bone morphogenetic protein 4; C, cell; CFU, colony-forming unit; FGF a, fibroblast growth factor-alpha; GM, granulocyte macrophage; GSK, glycogen synthase kinase; IBMX, isobutylmethylxanthine; IGF2, insulin-like growth factor 2; M, macrophage; Q, quartile; SCF, stem cell factor; TPO, thrombopoietin; VEGF, vascular endothelial growth factor.
- Submitted by
- Invitrogen Antibodies (provider)
- Main image
- Experimental details
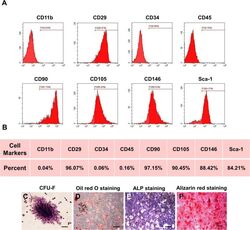
- Fig. 1 Characterization of murine BMMSCs. a , b Flow cytometric analysis of the surface markers showed positive expression of CD29, CD90, CD105, CD146, and Sca-1, and negative expression of hematopoietic markers CD11b, CD34, and CD45. c Representative image of colony formation of murine BMMSCs. d Representative image of Oil Red O staining of murine BMMSCs. e Representative image of ALP staining of murine BMMSCs. f Representative image of Alizarin red staining of murine BMMSCs. Scale bar, 500 mum

- Submitted by
- Invitrogen Antibodies (provider)
- Main image
- Experimental details
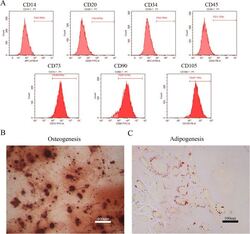
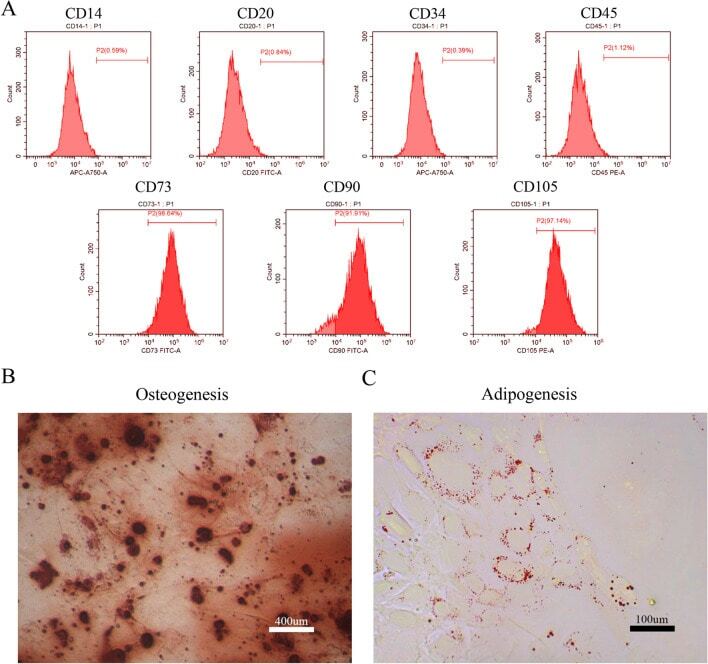
- Figure 1 Identification of dental pulp stem cells (DPSCs). Human DPSCs were positive for the cell surface antigens CD73, CD90, and CD105, as well as negative for CD14, CD20, CD34, and CD45 demonstrated by flow cytometry ( A ). DPSCs were cultured under osteogenic ( B , 14 days) or adipogenic ( C , 21 days) conditions, and showed mineralized nodules and lipid clusters as revealed by alizarin red and oil red staining, respectively. Scale bar = 400 ( B ) or 100 ( C ) mum.
- Submitted by
- Invitrogen Antibodies (provider)
- Main image
- Experimental details
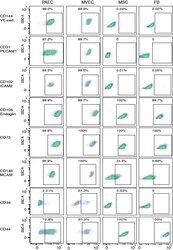
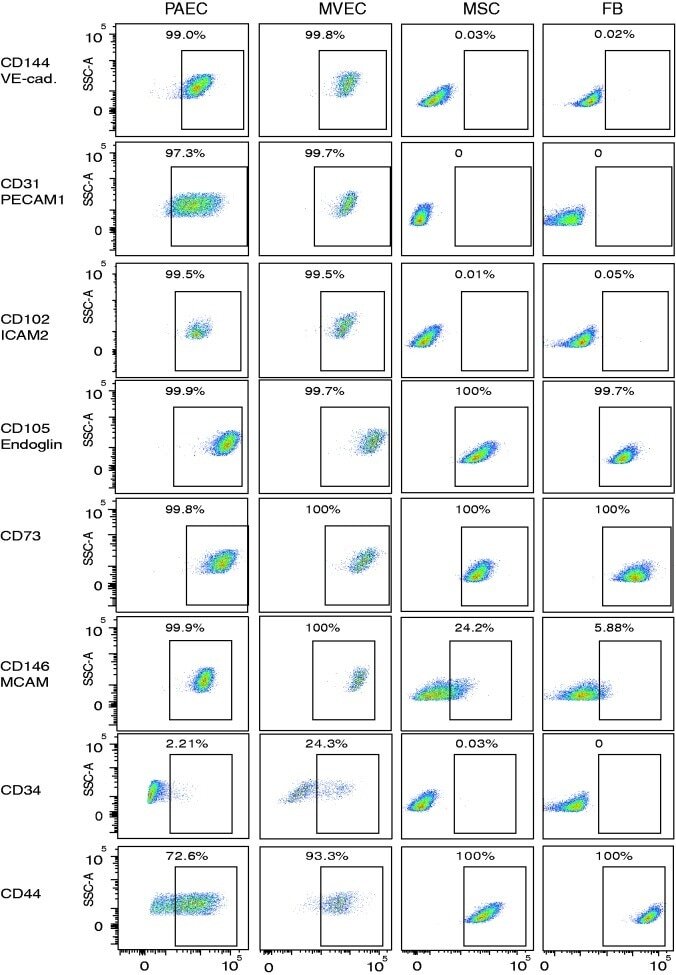
- Fig. 3 Expression of endothelial cell surface determinants by primary lung MVEC. Lung cells were incubated with primary antibodies directly conjugated to fluorophores and staining intensity analyzed by flow cytometry. Representative dot plots are presented. Human lung FB and MSC were used as known negative controls, and PAEC as a known positive control. DAPI was used to exclude dead cells.
- Submitted by
- Invitrogen Antibodies (provider)
- Main image
- Experimental details
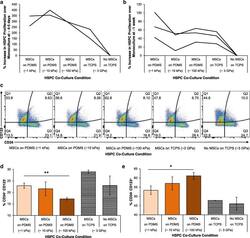
- Fig. 3 In vitro hematopoietic recovery: HSPC and MSC co-culture. Hematopoietic stem and progenitors (HSPCs) were grown in direct contact co-culture with MSCs grown on 1, 10, 100 kPa PDMS and TCPS. Proliferation of HSPCs in these co-culture conditions relative to monoculture were determined at ( a ) 4-5 days and ( b ) 1 week after co-culture. Individual lines represent replicate experiments. c HSPC surface marker expression of CD123 and CD34 assayed using flow cytometry. d % expression of CD34 + and CD123 - cells as mean +- standard deviations. e % expression of CD34 - and CD123 + cells as mean +- standard deviations. d - e Co-culture on PDMS of increasing stiffness (1, 10, 100 kPa) indicated in darkening shades of orange , respectively. Co-culture and monoculture of HSPCs on tissue culture polystyrene are shown as with black- and white-striped bars as distinct current standard protocols for comparison. Significant differences were calculated with one-tailed Student's t tests with unequal variance, (* p < 0.01, ** p < 0.005). Data are plotted as mean +- standard deviation, N = 3 across replicate wells

- Submitted by
- Invitrogen Antibodies (provider)
- Main image
- Experimental details
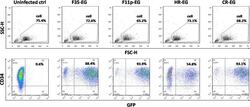
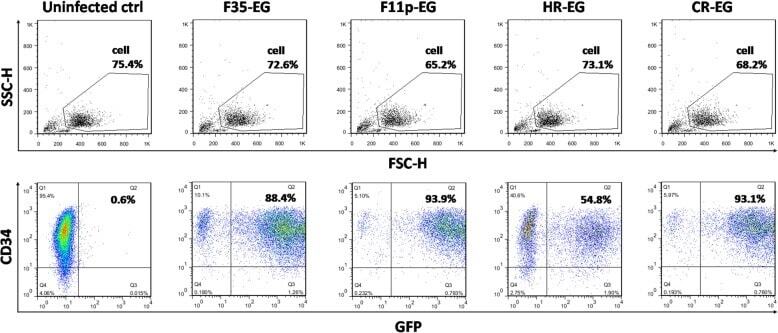
- Fig. 4 Transduction of cord blood CD34+ cells by fiber-modified HAdV-5 vectors. Isolated cord blood CD34+ cells were infected by adenoviral vectors at an MOI of 1000 vp/cell. Two days post infection, cells were labelled with APC-conjugated anti-CD34 antibody, and the GFP and APC fluorescences were analyzed with flow cytometry
- Submitted by
- Invitrogen Antibodies (provider)
- Main image
- Experimental details
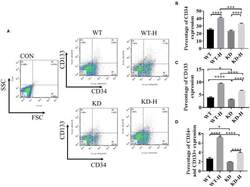
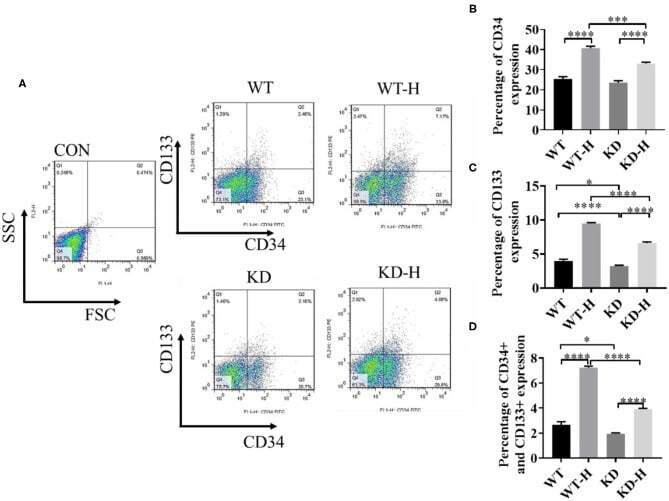
- Figure 4 Effect of gamma-aminobutyric acid type B receptor subunit 2 (GABBR2) knockdown on endothelial progenitor cell (EPC) mobilization in peripheral blood in hindlimb post-ischemia. (A) Representative images of CD34 + /CD133 + cells in the peripheral blood of mice analyzed by flow cytometry. WT , normal mice; KD , GABBR2-downregulated mice; WT-H , wild-type (WT) mice with hindlimb ischemia; KD-H , GABBR2 knockdown (KD) mice with hindlimb ischemia. (B) Ratio of CD34 + cells in the peripheral blood of normal and ischemic mice. (C) Ratio of CD133 + cells in the peripheral blood of normal and ischemic mice. (D) Ratio of CD34 + and CD133 + cells in the peripheral blood of normal and ischemic mice. * p < 0.05; *** p < 0.001; **** p < 0.0001.
- Submitted by
- Invitrogen Antibodies (provider)
- Main image
- Experimental details
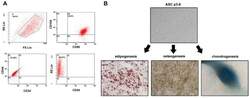
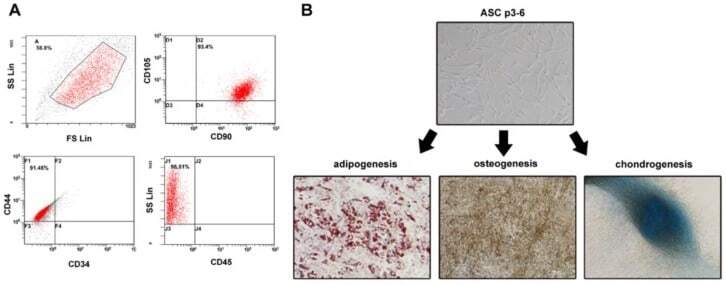
- Figure 1 Identification of ADSCs. ( A ) ADSCs were isolated from the adipose tissue of breast tumors. After two to three passages, the expressions of ADSCs markers (CD90FITC, CD105PE, and CD44FITC) and the lack of CD34PE and CD45FITC were confirmed by flow cytometry. ( B ) The differentiation ability of ADSCs was tested by adipogenesis, osteogenesis, and chondrogenesis.
- Submitted by
- Invitrogen Antibodies (provider)
- Main image
- Experimental details
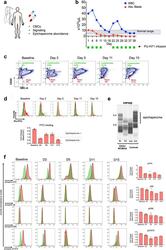
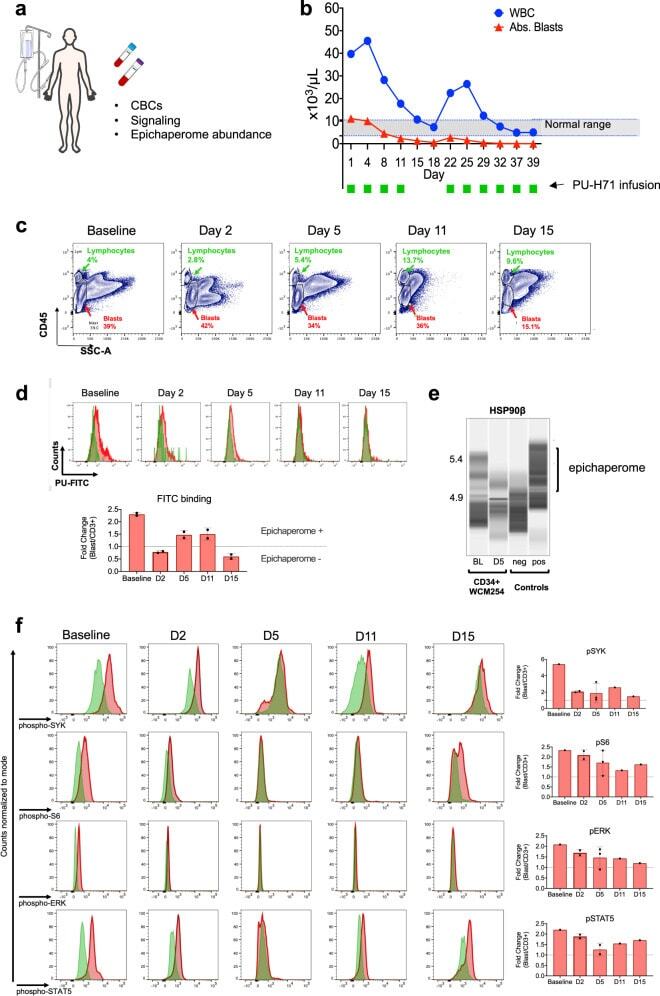
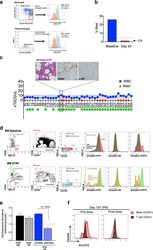
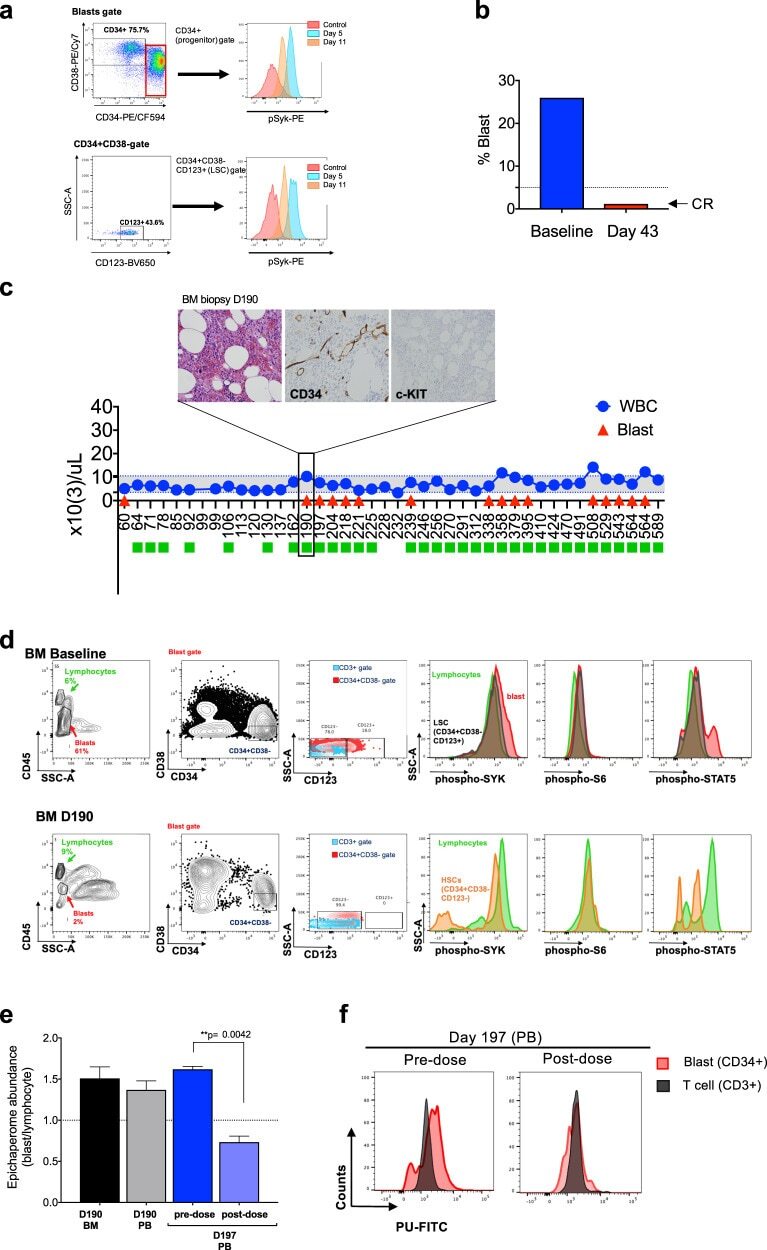
- Fig. 2 PU-H71 productively engages the epichaperome during treatment of patient WCM254. a During treatment with PU-H71, the patient WCM254 was monitored for complete blood counts (CBCs), signaling in leukocytes subsets, and epichaperome abundance in cells from peripheral blood and bone marrow. b The clinical course of patient WCM254 during the first ten doses of PU-H71. Absolute leukocyte (blue circle) and blast counts (red triangle) are indicated on each day they were assessed. Days on which the patient received a dose of PU-H71 are indicated with green squares. Gray shaded area indicates the normal range of leukocyte counts. c Chronological changes of percentages of lymphocytes (green) and blasts (red) in mononuclear cells at baseline and on day 2, 5, 11, and 15. Lymphocytes and blasts were gated on SSC-A vs. CD45. d , Epichaperome abundance determined by flow cytometry on day 0, 5, 11, and 15 is shown as a biomarker of response to PU-H71. Graph, mean +- SD of MFI of blasts (i.e., epichaperome +ve)/MFI of CD3 + lymphocytes (i.e., epichaperome -ve). e Isoelectric focusing shows long-lived multimeric HSP90 species (a biochemical signature of epichaperomes) in sorted CD34 + baseline (BL) blasts that decrease by day 5 of treatment (D5). Negative control, ASPC1 (epichaperome + ) homogenate; positive control, MDA-MB-468 homogenate (epichaperome-) . f Cell subsets as in c and d were evaluated by flow cytometry for levels of intracellular phospho-Syk(Y525/526), phospho-STAT5(Y694),
- Submitted by
- Invitrogen Antibodies (provider)
- Main image
- Experimental details
- Fig. 3 Long-term evaluation of disease and the impact of treatment in stem cell and progenitor compartments during administration of PU-H71. a Evaluation of activated intracellular signaling in AML CD34 + progenitor cells (top) and CD34 + CD38-CD123 + leukemic stem cells (bottom) at day 5 and 11 during PU-H71 therapy. Red shows florescence minus one (FMO) control. b Clinical assessment of the percentage of blasts in bone marrow at baseline and on day 43 after 10 does of PU-H71. Bone marrow aspirate showed
- Submitted by
- Invitrogen Antibodies (provider)
- Main image
- Experimental details
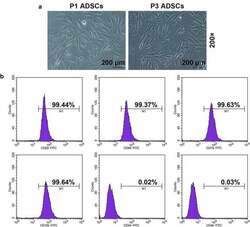
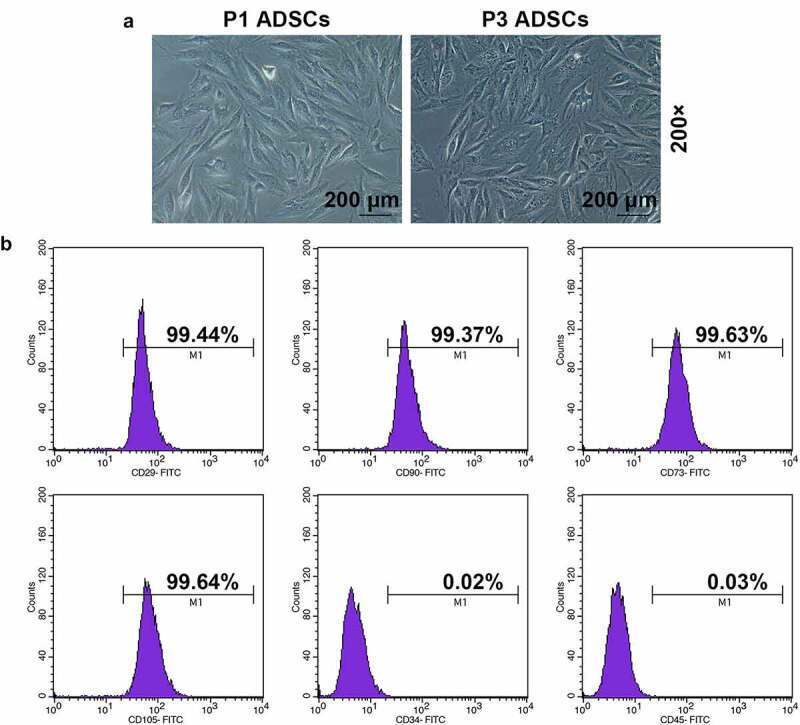
- Figure 1. Morphology and immune phenotype of adipose-derived stem cells (ADSCs) were identified by morphological observation and flow cytometry. (a) Morphology of the primary (P1) and third passage (P3) of ADSCs. Images were acquired at 200x magnification. (b) Immune phenotype of ADSCs. The average data from three independent experiments were shown as mean +- standard deviation
- Submitted by
- Invitrogen Antibodies (provider)
- Main image
- Experimental details
- Figure 1. Identification and characteristics of hPDLSCs. Morphological characterization of hPDLSCs in (A) primary culture and (B) culture at passage 3. A periodontal membrane fragment is present and shown in A. Flow cytometry analysis of surface markers expressed on hPDLSCs, showing that they were positive for (D) 0CD44, (F) CD90 and (G) CD105, and negative for (C) CD34 and (E) CD45. (H) Following 3 weeks of culture in osteogenic induction medium, the cells were stained with alizarin red. Mineralized nodules are shown. (I) Following 3 weeks of culture in adipogenic induction medium, the cells were stained with Oil Red O. Lipid globules are shown (black arrow). hPDLSCs, human periodontal ligament stem cells; PE, phycoerythrin.

- Submitted by
- Invitrogen Antibodies (provider)
- Main image
- Experimental details
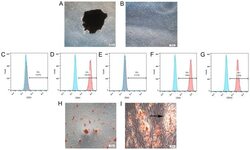
- Fig. 1 BM erythroid progenitors in DBA patients show compromised growth. a Schematic illustrating the experimental workflow. Bone marrow (BM) erythroid progenitors from healthy individuals (acting as normal controls, NC) and DBA patients, who were subcategorized into untreated (UT), glucocorticoid (GC)-responsive (GCR) and GC-non-responsive (GCNR) groups, were sorted using flow cytometry and processed for single-cell RNA-seq (scRNA-seq) using modified STRT-seq, followed by data analyses and experimental validation. b Representative FACS plots showing the gating strategies used for isolation of BFU-E cells from NCs, which were immunophenotypically defined as CD45 + CD3 - CD4 - CD14 - CD19 - CD41 - CD235a - CD123 - CD36 - CD34 + . c The percentage of colonies generated from FACS-sorted cells (BFU-E: CD45 + CD3 - CD4 - CD14 - CD19 - CD41 - CD235a - CD123 - CD36 - CD34 + ) from cord blood (CB) and BM mononuclear cells. We seeded the sorted cells from the CB of three individuals and BM of one individual due to the limited healthy BM sample. Results are represented as mean +- SEM. d Micrographs of representative BFU-E colonies differentiated from sorted BFU-E cells of NC and DBA UT patients on day 14 of the colony forming unit assay. Scale bars, 100 mum. See also Supplementary Fig. S1 , Tables S1 , 2 .

- Submitted by
- Invitrogen Antibodies (provider)
- Main image
- Experimental details
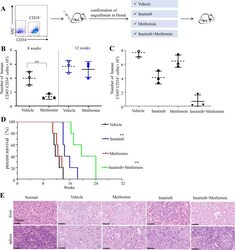
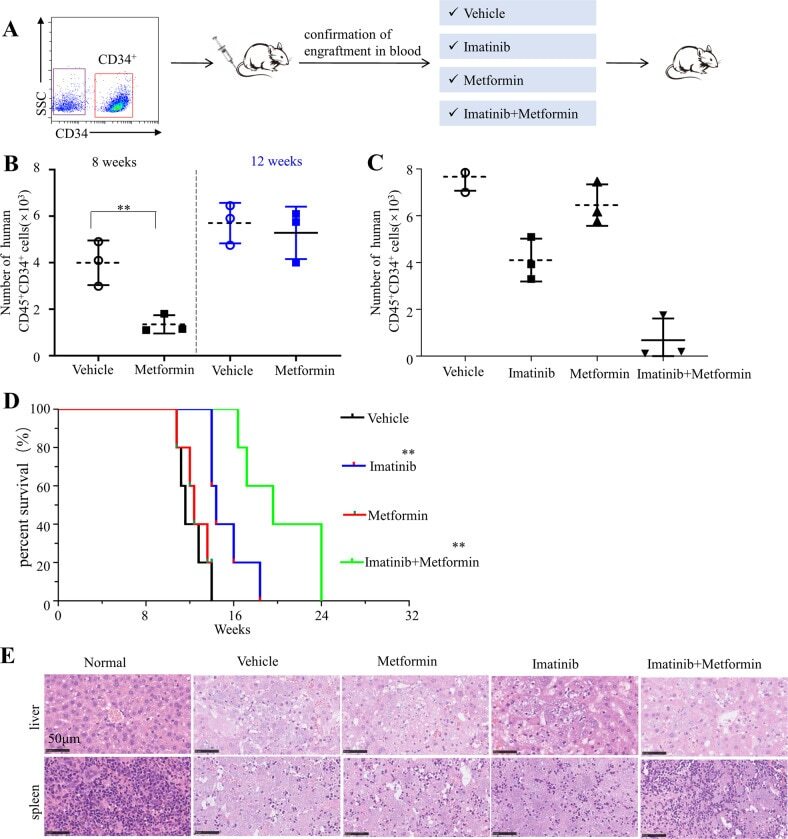
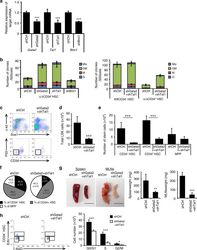
- Metformin resumes the sensitivity of CD34 + CML cells to imatinib in the PDX model. A Diagram of experimental design. The engraftment of CML CD34 + cells in mice were assessed by monitoring the percentage of human CD45 + circulating leukocytes using flow cytometry. B , C Percentages of human CD45 + CD34 + cells in the bone marrow post transplantation are shown. D Survival of the CML PDX mice with indicated treatment was shown. E The leukemic invasions in the spleen and liver of PDX mice with indicated treatment were analyzed by hematoxylin and eosin (H&E) staining.
- Submitted by
- Invitrogen Antibodies (provider)
- Main image
- Experimental details
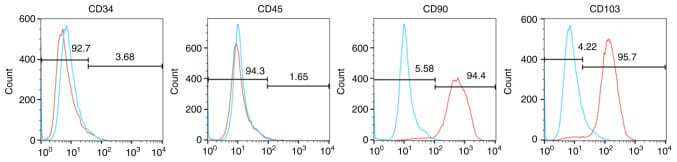
- Hemangioma-derived mesenchymal stem cells (Hem-MSCs) express CD103 and CD90, but do not express CD34 or CD45, according to flow cytometry.
- Submitted by
- Invitrogen Antibodies (provider)
- Main image
- Experimental details
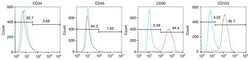
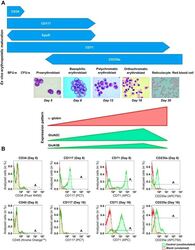
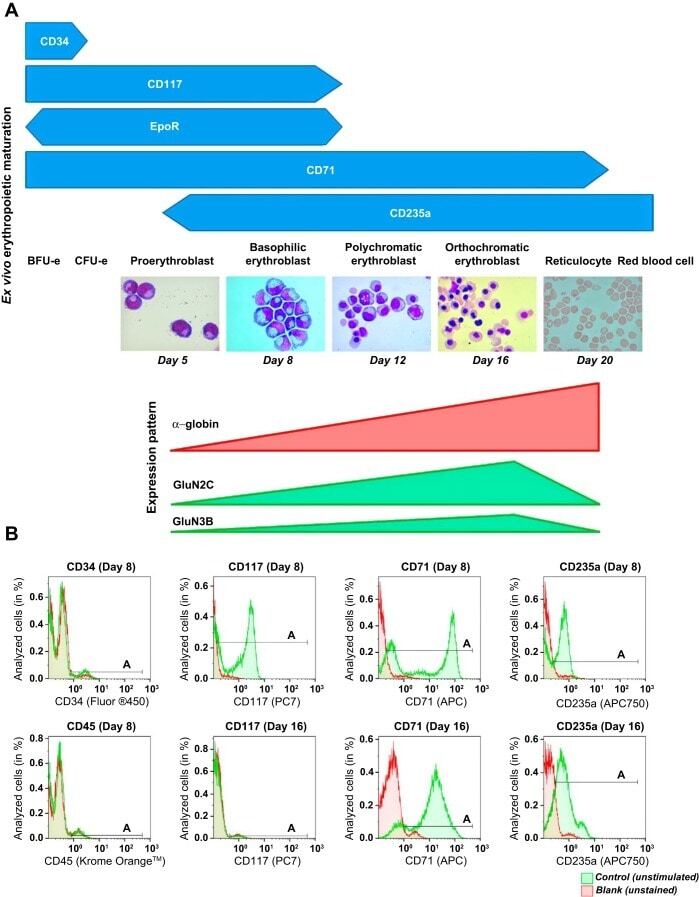
- Fig. 1. Stage-dependent N -methyl- d -aspartate receptor (NMDAR) subunit expression during ex vivo erythropoietic maturation. A : differentiation stages of erythroid precursor cells (EPCs) in culture derived from peripheral blood-borne CD34 + cells were analyzed morphologically and by the presence of the differentiation markers (CD34, CD117, CD71, and CD235a) assessed by flow cytometry () and matched with the alpha-globin, GRIN2C , and GRIN3B transcript abundance during ex vivo erythropoietic maturation (). EpoR, erythropoietin (Epo)-Epo receptor; BFUe, burst-forming units-erythroid; CFUe, colony-forming units- erythroid. B : green histograms (control, unstimulated) showing CD34, CD117, CD71, and CD235a abundance in the EPCs at days 8 (basophilic erythroblasts) and 16 (orthochromatic erythroblasts) in culture. Horizontal bars indicate the A gate selection. Shown in red are the histograms for the unstained cells (blank). CD45 was used to assess the fraction of white blood cells in erythroid cultures (quantification of the data and statistics are presented in Table 1 ).
- Submitted by
- Invitrogen Antibodies (provider)
- Main image
- Experimental details
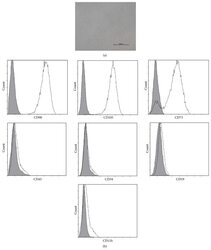
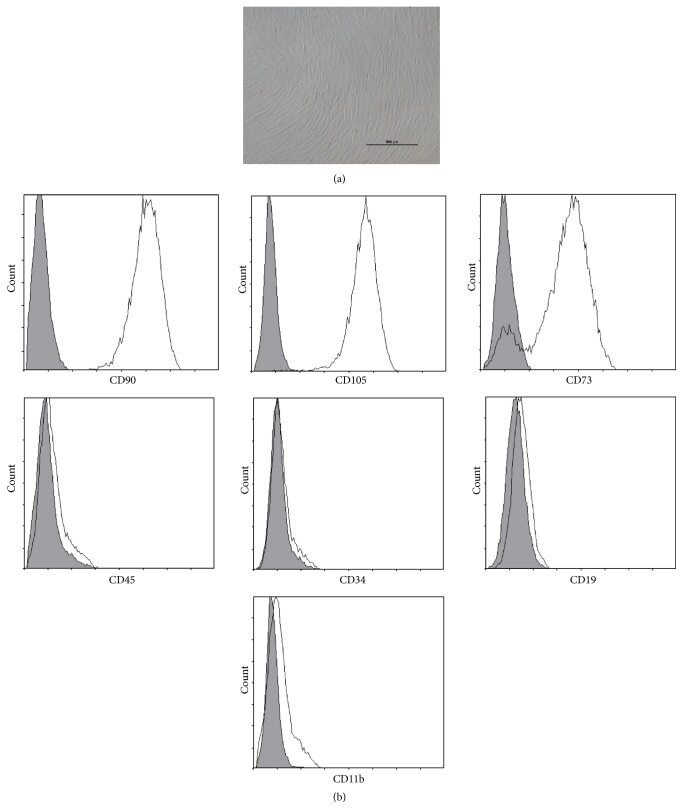
- Figure 1 Characteristics of BM-MSCs. (a) Representative morphology of BM-MSCs. Scale bar = 500 mu m. (b) Representative flow cytometric characterization of cell surface markers expressed on BM-MSCs. Isotypic controls were represented by the gray filled histograms.
- Submitted by
- Invitrogen Antibodies (provider)
- Main image

- Experimental details
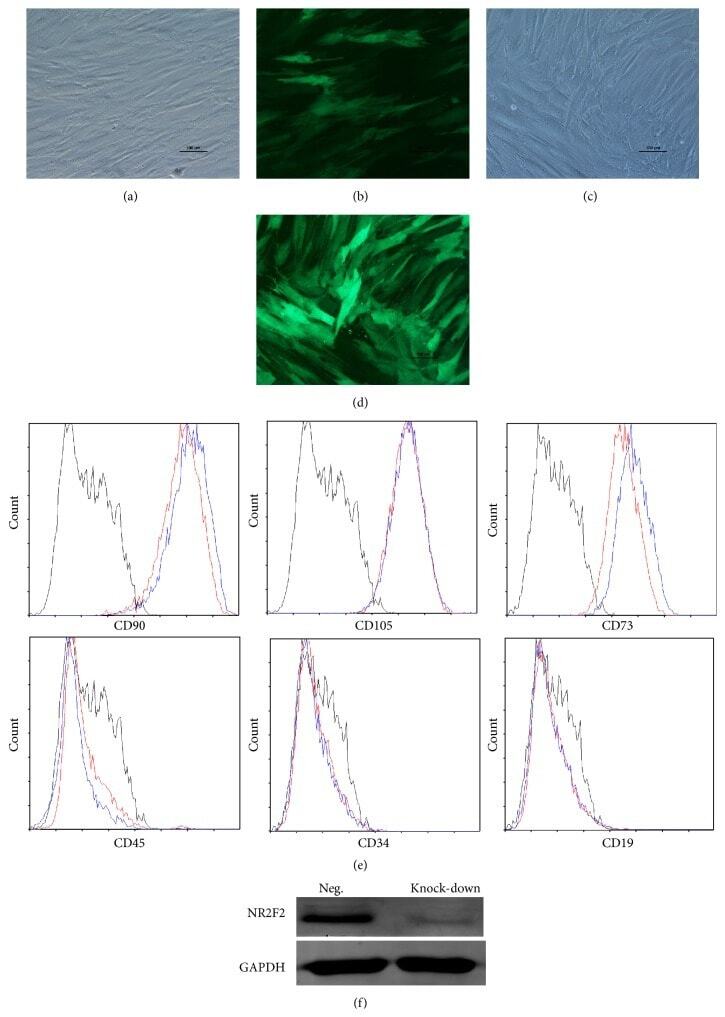
- Figure 2 Characteristics of transfected BM-MSCs. (a) Representative morphology of transfected BM-MSCs in negative control group. (b) More than 90% of BM-MSCs expressed GFP in negative control group. (c) Representative morphology of transfected BM-MSCs in knock-down group. (d) More than 90% of BM-MSCs expressed GFP in knock-down group. (e) Representative flow cytometric characterization of cell surface markers expressed on transfected BM-MSCs. Isotypic controls were represented by black line. The red line represented the negative control group and the blue line represented the knock-down group. (f) The knock-down of NR2F2 was confirmed by western blot analysis.
- Submitted by
- Invitrogen Antibodies (provider)
- Main image
- Experimental details
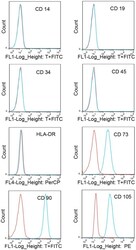
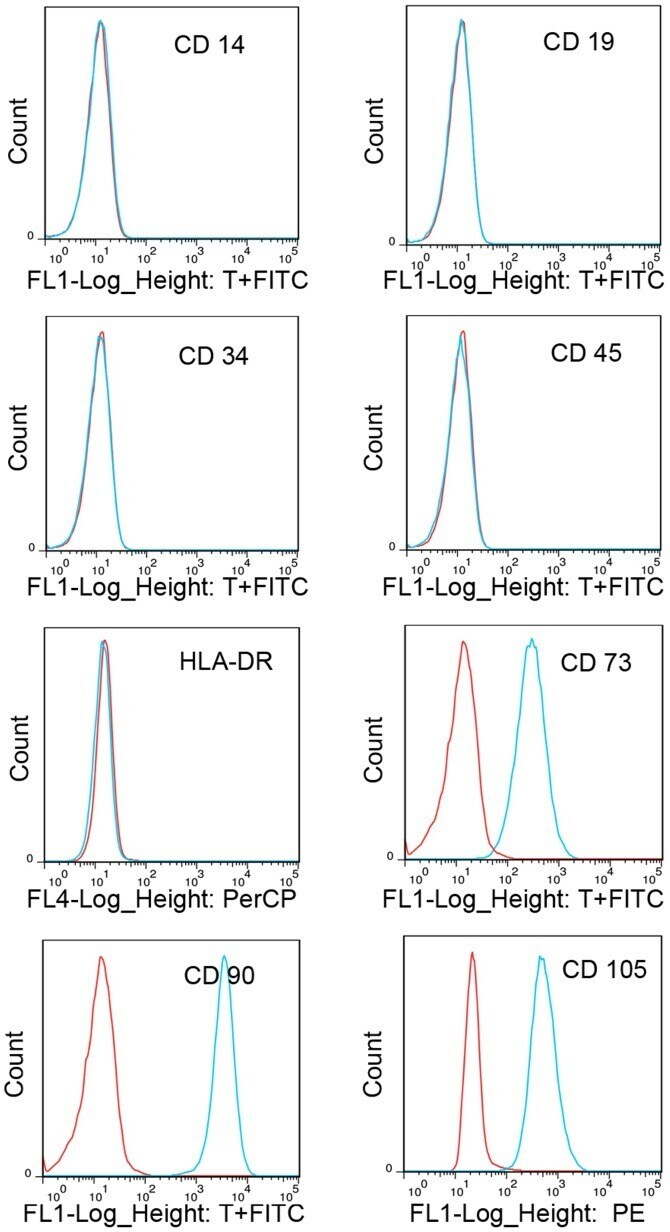
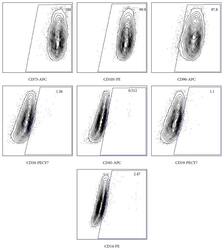
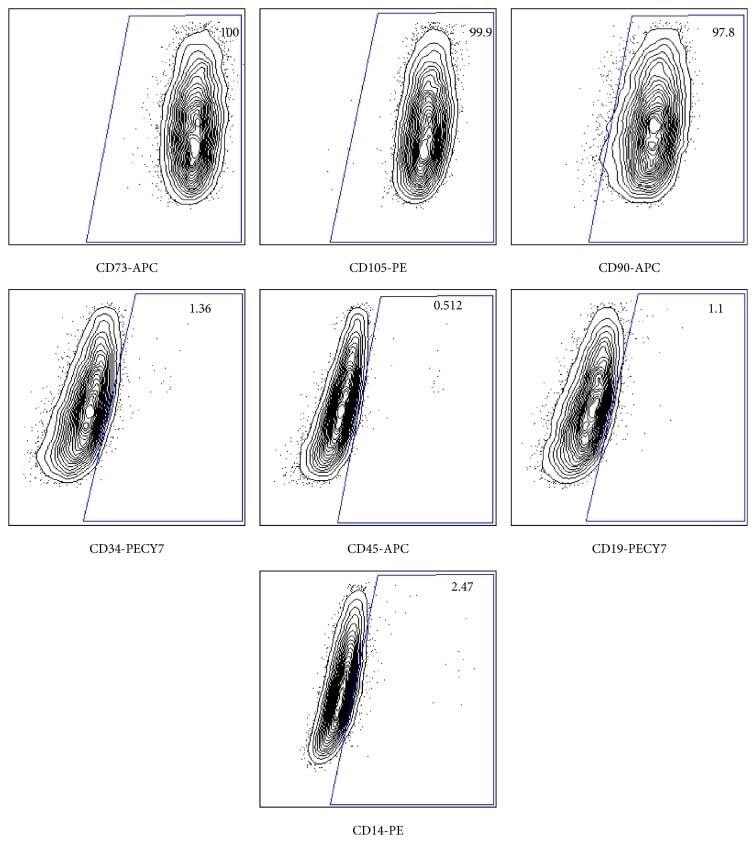
- Figure 3 Flow cytometry of human bone marrow-derived MSCs indicating the percentage of each marker in each panel and name of conjugated antibody at the bottom of each panel. C73, CD105, and CD90 shown as positive markers and CD34, CD45, CD19, and CD14 shown as negative markers.
- Submitted by
- Invitrogen Antibodies (provider)
- Main image
- Experimental details
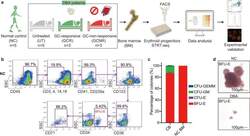
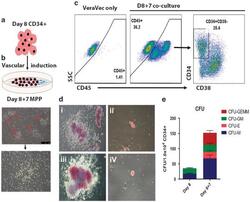
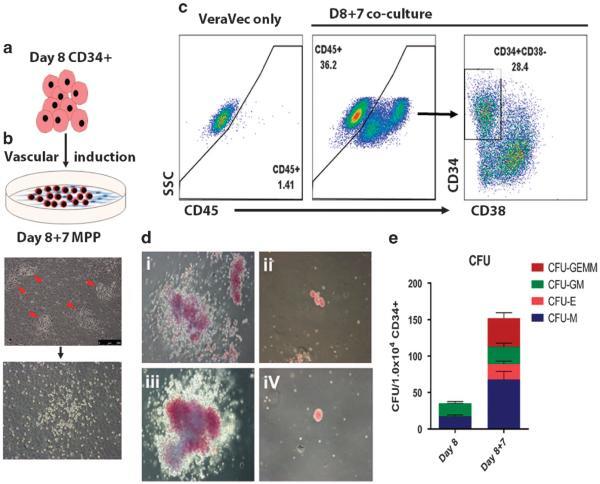
- Figure 5 Haematopoietic differentiation and vascular induction. ( a ) Experimental design. EBs formed over 8 days (as shown in this figure), were dissociated, sorted for CD34 cells, and then incubated on the VeraVec endothelial cell line expressing the E4ORF1 gene. ( b ) Multipotent haematopoietic progenitors. Upon vascular induction, small clusters of budding hemogenic cells (red triangles) were evident by light microscopy and gave rise to non-adherent haematopoietic progenitors. ( c ) FACS phenotype of iPSC CD34s that underwent vascular induction. Day 8 CD34 from EBs cultured on VeraVec cells for 1 week was analysed by flow cytometry for CD34, 48 and 45. ( d ) Vascular induction CFU. CD34 CD45+ cells isolated from the VeraVec feeder cells were cultured in methylcellulose, and representative colonies for CFU-GEMM (i and iii) and CFU-E (ii and iv) are shown. ( e ) CFU quantification. Three independent experiments were analysed and quantified for the number of lineage-specific colonies formed for CD34 cells derived +/- vascular induction. CFU-GEMM, colony-forming unit-granulocyte, erythrocyte, monocyte/macrophage, megakaryocyte; CFU-GM, colony-forming unit granulocyte- monocyte/macrophage; CFU-E, colony-forming unit erythroid; CFU-M, colony-forming unit monocyte/macrophage; FACS, fluorescence-activated cell sorting.
- Submitted by
- Invitrogen Antibodies (provider)
- Main image
- Experimental details
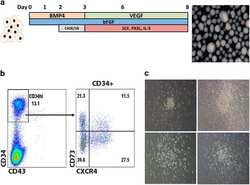
- Figure 4 Haematopoietic differentiation. ( a ) Culture condition schema. Embryoid bodies were formed from iPSCs in the presence BMP4, VEGF, bFGF, CHIR99021 and SB431542, and haematopoietic cytokines (Flt3-ligand, SCF and IL-3) over the course of 8 days. A representative image of EBs are shown at right. ( b ) FACS phenotype of EB-derived CD34. Dissociated EBs were analysed by FACS for CD73 and CXCR4 in the CD34 high-expressing population. ( c ) Methylcellulose CFU assay. CD34 cells were embedded in methylcellulose, and an image of the dominating CFU-G/M colony types are shown. The analyses/experiments are from at least four different differentiation procedures. FACS, fluorescence-activated cell sorting.

- Submitted by
- Invitrogen Antibodies (provider)
- Main image
- Experimental details
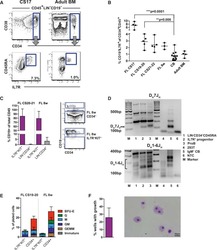
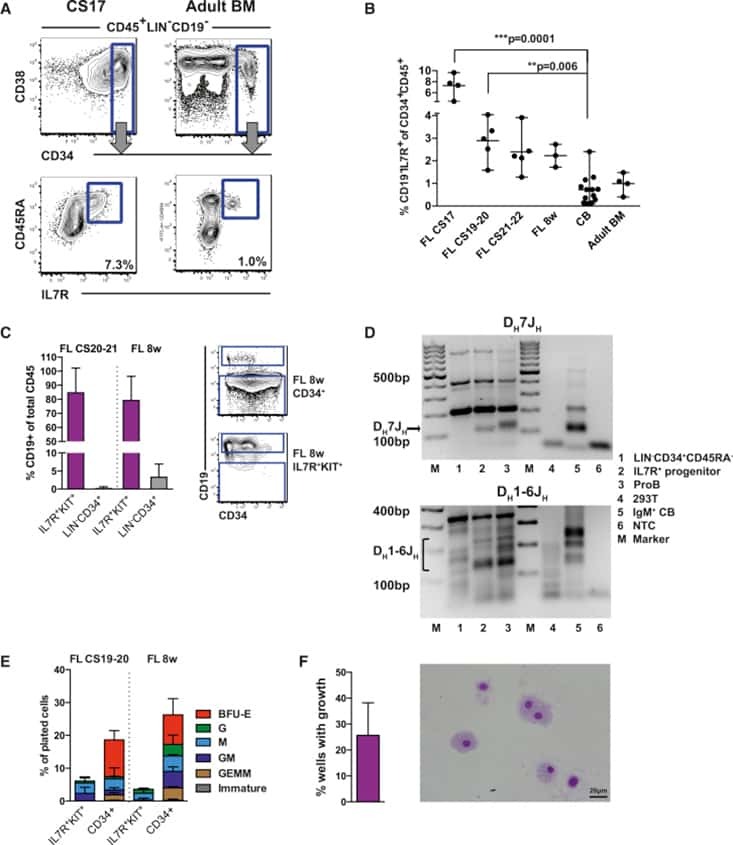
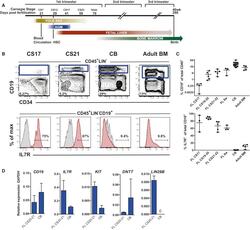
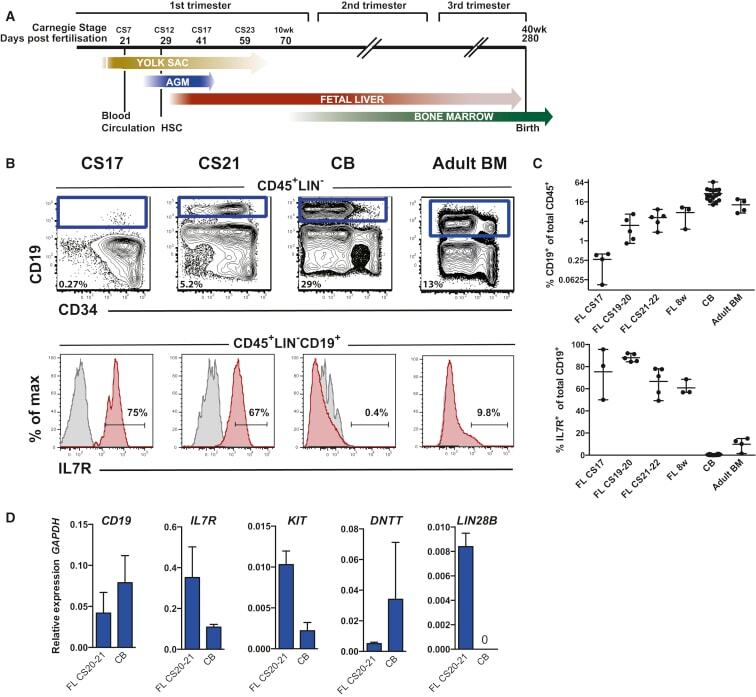
- Figure 1 The Majority of Emerging B Cells in the Human Fetal Liver Express IL-7R (A) Major hematopoietic sites in the developing human embryo. Timescale shows days of gestation and embryonic development by Carnegie stage (CS) ( Tavian and Peault, 2005 ). (B) CD19 + B cells from human fetal livers (FLs) at CS17 and CS21-22, cord blood (CB) and adult bone marrow (BM) were analyzed for surface expression of IL-7R. Viable cells were gated CD45 + LIN - , further gating as indicated. Top panel: mean percentage CD19 + B cells of total CD45 + cells. Bottom panel: mean percentage of CD19 + B cells expressing IL-7R. (C) Emergence of CD19 + B cells as percent of total CD45 + cells (top panel) and percent CD19 + B cells expressing IL-7R (bottom panel) at different time points of development. Each dot represents one biological sample. Mean with range. (D) Quantitative gene-expression analysis of CD34 + CD19 + proB cells (CS 20-21 FL and CB). Data are presented relative to GAPDH ; mean +- SD, n = 2-3. See also Figure S1 .
- Submitted by
- Invitrogen Antibodies (provider)
- Main image

- Experimental details
- Figure 1. Characterization of PDLSCs. (A) PDL cell clusters exhibited radiating or whirlpool-like morphology. The central structure in this image is a fragment of PDL tissue. Scale bar, 200 mum (B) CD146 + PDLSCs were small, round, fusiform and triangular. Scale bar, 100 mum. (C) PDLSCs were positive for the stem cell markers CD44, CD90 and CD105, but negative for CD34 and CD45, as detected by flow cytometry. PDL, periodontal ligament; PDLSCs, PDL stem cells.
- Submitted by
- Invitrogen Antibodies (provider)
- Main image
- Experimental details
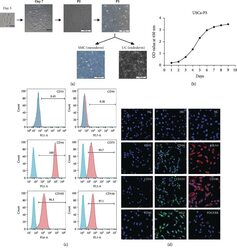
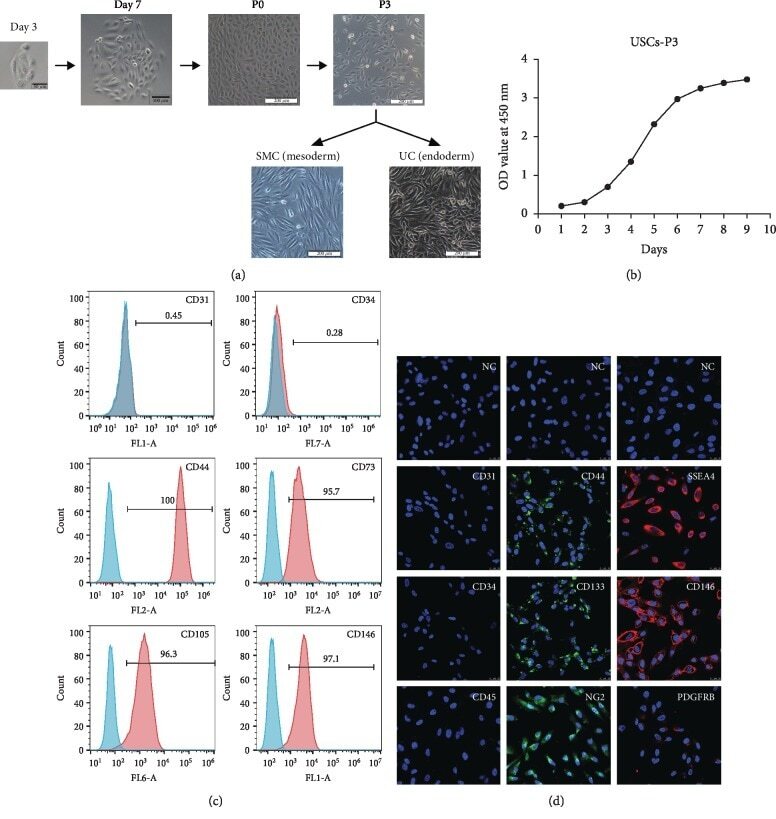
- Figure 1 Growth characteristics of USCs. (a) The morphology of USCs by passage and differentiation. Single, small, compact rice grain-like cells were observed on the third day after initial seeding, and they formed a colony on the seventh day. The cells were considered to be at P0 when the confluence reached 70-80% and were passaged to the next generation. The USCs maintained the rice grain-like morphology after several passages, and USCs from the P3 generation were induced to differentiate into SMCs and UCs. The cells showed an elongated and spindle-shaped morphology after SMC differentiation and a cobblestone-shaped morphology after UC differentiation. Scale bar: 50 mu m, 100 mu m, and 200 mu m. (b) The growth curve of USCs from the P3 generation. (c) Detection of surface markers in USCs using flow cytometry. USCs did not express hematopoietic stem cell markers (CD31: 0.45%, CD34: 0.28%) but expressed MSC markers (CD44: 100%, CD73: 97.1%, and CD105: 96.3%) and pericyte markers (CD146: 95.7%). (d) Detection of surface markers in USCs using IF. USCs did not express hematopoietic stem cell markers (CD31, CD34, and CD45) but did express MSC markers (CD44 and CD133), the ESC marker SSEA4, and pericyte markers (CD146, PDGFRB, and NG2). NC: negative control; PDGFRB: platelet-derived growth factor beta-receptor; NG2: neural/glial antigen 2. Scale bar: 25 mu m.
- Submitted by
- Invitrogen Antibodies (provider)
- Main image
- Experimental details
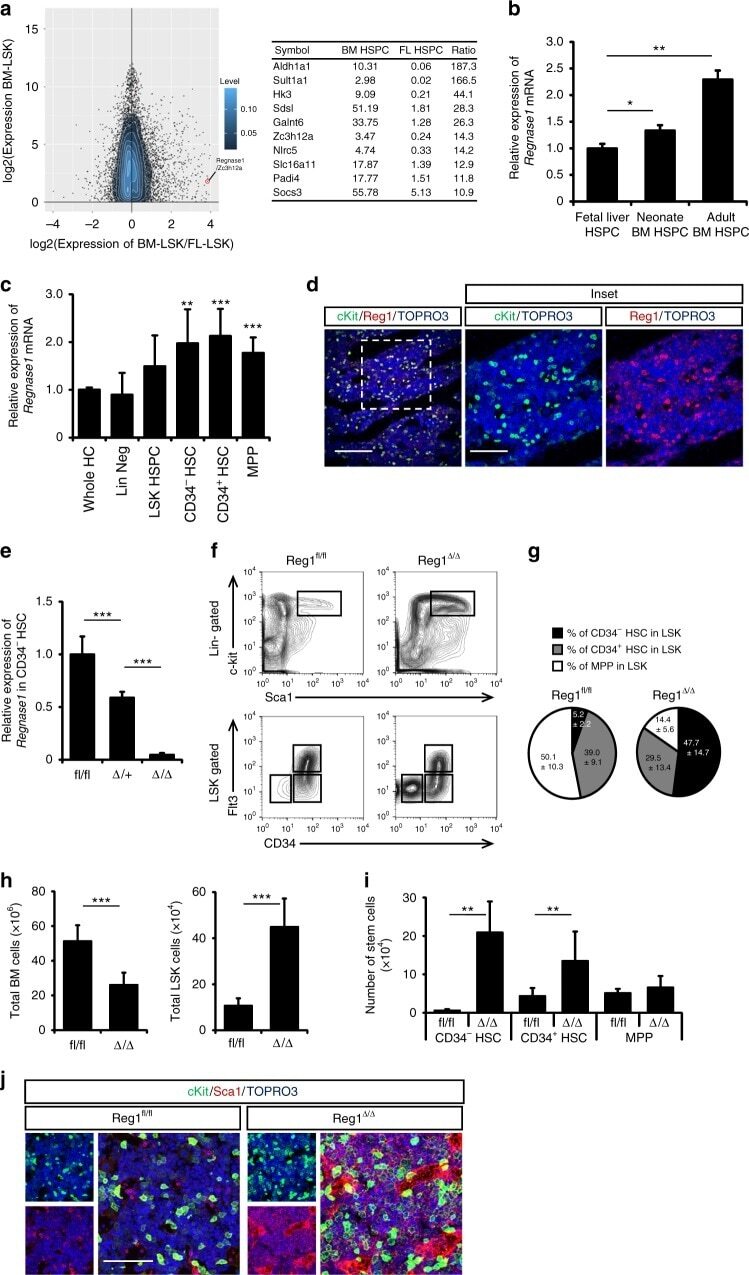
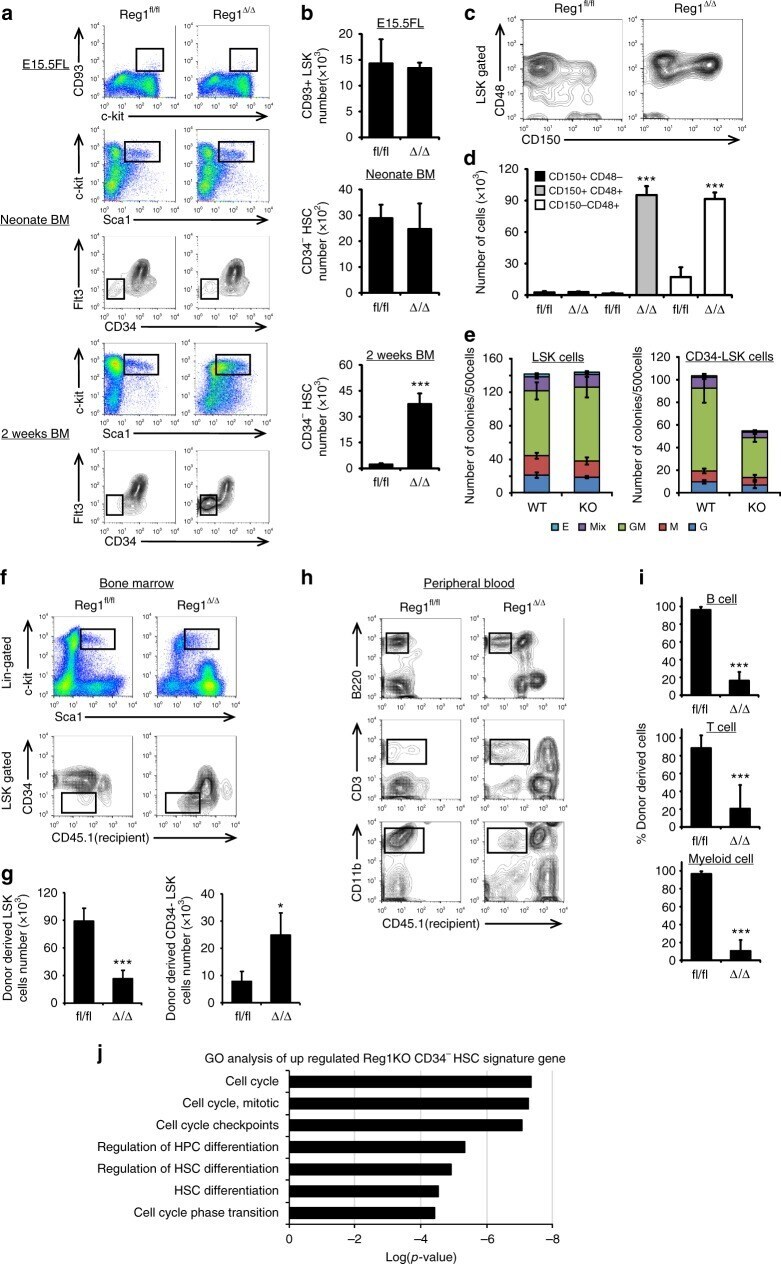
- Fig. 1 Regnase-1 is expressed in HSPCs and is involved in maintenance of the HSC pool. a Mean difference plot of mRNA expression in Lineage - Sca-1 + c-Kit + (LSK) HSPCs from adult BM and HSPCs from E14.5 FL using the GEO data sets ( GSE69760 ). Genes with expression levels increased >=10-fold in adult BM and encoding intra-cellar proteins are listed in the table on the right. b Quantitative RT-PCR of Regnase-1 expression in isolated LSK cells from E14.5 fetal liver, neonate BM, and adult BM ( n = 3 per group). Data are expressed as fold-change relative to fetal liver HSPCs. c Regnase-1 mRNA expression in lineage-negative cells (Lin Neg), Lin - cKit + Sca-1 + cells (LSK HSC), LSK CD34 - Flt3 - (CD34 - HSC), LSK CD34 + Flt3 - (CD34 + HSC), and LSK CD34 + Flt3 + (MPP) prepared from BM of adult mice (8-week-old) ( n = 3). d Immunohistochemical staining of Regnase-1 in BM. The right-hand panels show a higher magnification of the areas indicated by the boxes. The scale bars represent 200 mum and 100 mum (insets). e Loss of Regnase-1 expression in CD34 - HSCs was confirmed by Quantitative RT-PCR of adult Vav1-iCre; Regnase-1 flox/flox (Delta/Delta), Vav1-iCre; Regnase-1 flox/+ (Delta/+) and control Regnase-1 flox/flox (fl/fl). The level of Regnase-1 mRNA of the fl/fl mice was set at 1.0 ( n = 3 mice of each genotype). f - i Representative flow cytometric analysis ( f ), quantitative and statistical analyses of HSPCs populations ( g ), and the num
- Submitted by
- Invitrogen Antibodies (provider)
- Main image
- Experimental details
- Fig. 2 Regnase-1 deficiency leads to expansion of immature HSPCs. a Representative flow cytometric analysis of HSPC populations in the FL of E15.5 embryo, BM of 1-day-old neonate, BM of 2-week-old control (fl/fl) or Regnase-1-KO (Delta/Delta) mice ( n = 3 per group). b The numbers of LSK-HSCs or CD34 - HSCs in the total FL or BM cells assessed by flow cytometry. c Representative flow cytometric analysis of LSK cells for CD48 and CD150 expression of 8-week-old control (fl/fl) or Regnase-1-KO (Delta/Delta) ( n = 3 per group). d Percentage of CD150 + CD48 - cells, CD150 + CD48 + cells, and CD150 - CD48 + cells of control (fl/fl) and Regnase-1-KO (Delta/Delta) mice. e Colony-forming ability of LSK-HSCs and CD34 - HSC from control (fl/fl) or Regnase-1-KO (Delta/Delta) mice BM. G CFU-granulocyte; GM CFU-granulocyte/monocyte; M CFU-monocyte; E CFU-erythroid; and mix mixed CFU-granulocytes, monocyte, erythroid, and megakaryocyte. Data show the means +- SD ( n = 5; 3 independent experiments). f Competitive repopulation assay of lethally irradiated (10 Gy) WT recipients (CD45.1) transplanted with BM of either control (fl/fl) or Regnase-1-KO (Delta/Delta) mice. Chimerism was analyzed in recipient mice 16 weeks after injection of 1 x 10 3 of CD34 - HSCs from control or Regnase-1-KO mice (CD45.2) with 5 x 10 5 competitor BM cells (CD45.1). Donor-derived cell ratios (CD45.1 - ) in BM HSPC and CD34 - HSC populations were determined by flow cytometry ( n = 5 per group). g The number of LSK o
- Submitted by
- Invitrogen Antibodies (provider)
- Main image
- Experimental details
- Fig. 7 The effect of Regnase-1 on HSPCs is mediated through Gata2 and Tal1. a Relative expression of Gata2 , Tal1 , and Bmi1 in CD34 - HSCs infected with shRNA virus targeting Gata2 , Tal1 , Bmi1 or scrambled control (shCtrl). Bmi1 was used as a non-candidate negative control. Data are expressed as fold-change relative to control shRNA infection ( n = 3 per group). b Colony-forming assay of Regnase-1-deficient CD34 - HSCs infected with either an shCtrl, shGata2, or shTal1 shRNA virus (left), and control (fl/fl) or Regnase-1-KO (Delta/Delta) CD34 - HSCs infected with control or shGata2+ shTal1 shRNA virus (right). G indicates CFU-granulocyte; GM CFU-granulocyte/monocyte; M CFU-monocyte; E CFU-erythroid; and mix mixed CFU-granulocytes, monocyte, erythroid, and megakaryocyte ( n = 4 per group; 4 independent experiments). c Regnase-1-KO (Delta/Delta) CD34 - HSCs infected with shCtrl or shGata2+ shTal1 shRNA virus were transplanted and analyzed by flow cytometry ( n = 3 per group; 3 independent experiments). d - f Numbers and populations of LSK-HSCs or CD34 - HSCs in total BM assessed by flow cytometry in c . Data represent the means +- SD. g Representative gross appearance of the spleen and mesenteric lymph nodes (MLNs) collected from bone marrow-transplanted mice as shown in c . The scale bars represent 1 cm. h Cell-cycle analysis of control BM CD34 - HSCs in c by flow cytometry using EdU/7AAD staining. Dot plots indicate the frequency of CD34 -

- Submitted by
- Invitrogen Antibodies (provider)
- Main image
- Experimental details
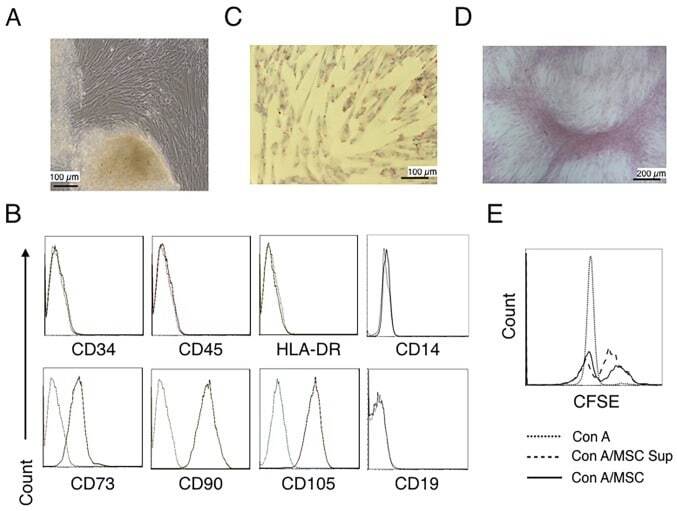
- Figure 1. Characterization of hUC-MSCs. (A) Morphological observations of hUC-MSCs. Umbilical cord tissues were cultured for >15 days and long spindle-shaded fibroblastic cells were observed around the tissue using Zeiss light microscopy (scale bar, 100 um). (B) Phenotyping of hUC-MSCs. hUC-MSCs were stained with a fluorescein-labeled antibodies (CD34, CD45, CD73, CD90, CD105, CD14, CD19 and HLA-DR) and analyzed with a flow cytometer. (C) Adipogenic and (D) osteogenic differentiation of hUC-MSCs. hUC-MSCs were cultured in adipogenic and osteogenic medium, respectively. Lipid droplets in the adipocytes are presented with Oil Red O staining (scale bar, 100 um). hUC-MSCs-derived osteoblasts were detected with Alizarin Red staining (scale bar, 200 um). (E) hUC-MSCs inhibit the proliferation of CFSE-labeled CD4 + T cells, which were activated by Con A stimulation. Experiments were repeated three times and representative graphs and images are presented. hUC-MSC, human umbilical cord-derived mesenchymal stem cell; MSC Sup, culture supernatant of hUC-MSCs; Con A, concanavalin A; CFSE, carboxyfluorescein succinimidyl ester.
- Submitted by
- Invitrogen Antibodies (provider)
- Main image
- Experimental details
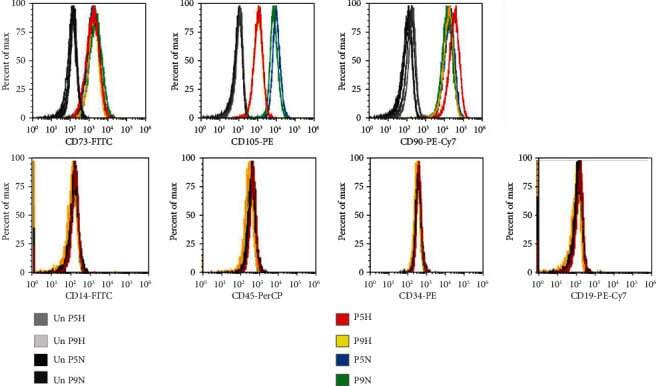
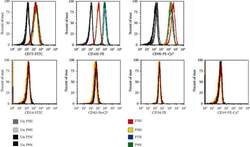
- Figure 2 Flow cytometry of CD cell surface markers for cells cultured under hypoxia and normoxia. The positive CD markers for MSCs as detected by the fluorescent antibodies anti-CD73 FITC, anti-CD105 PE, and anti-CD90 PE Cy7. The negative markers of MSCs were detected using anti-CD14 FITC, anti-CD45 PerCP, anti-CD34-R-PE, and anti-CD19 PE-Cy7 antibodies. Unstained cell for each condition was used as negative controls.