 Explore
 Validate
 Learn
Learn Western blot
Antibody data
- Antibody Data
- Antigen structure
- References [15]
- Comments [0]
- Validations
- Western blot [2]
- Immunocytochemistry [4]
- Immunohistochemistry [1]
- Other assay [14]
Submit
Validation data
Reference
Comment
Report error
- Product number
- PA1-10019 - Provider product page

- Provider
- Invitrogen Antibodies
- Product name
- GFAP Polyclonal Antibody
- Antibody type
- Polyclonal
- Antigen
- Purifed from natural sources
- Description
- By Western blot, two bands are detected in rat cerebellum homogenate: a prominent band at 50 kDa corresponding to rodent GFAP and a lower band at ~45 kDa that most likely represents a proteolytic fragment derived from the GFAP molecule.
- Reactivity
- Human, Mouse, Rat, Bovine, Porcine
- Host
- Rabbit
- Isotype
- IgG
- Vial size
- 100 µL
- Concentration
- Conc. Not Determined
- Storage
- Store at 4°C short term. For long term storage, store at -20°C, avoiding freeze/thaw cycles.
Submitted references The Neurotoxicity of Vesicles Secreted by ALS Patient Myotubes Is Specific to Exosome-Like and Not Larger Subtypes.
Low-dose metformin treatment in the subacute phase improves the locomotor function of a mouse model of spinal cord injury.
Erythrocyte adenosine A2B receptor prevents cognitive and auditory dysfunction by promoting hypoxic and metabolic reprogramming.
Nicotine induces morphological and functional changes in astrocytes via nicotinic receptor activity.
The effect of rosmarinic acid on deformities occurring in brain tissue by craniectomy method. Histopathological evaluation of IBA-1 and GFAP expressions.
Cellular and molecular outcomes of glutamine supplementation in the brain of succinic semialdehyde dehydrogenase-deficient mice.
Differentiation of Human Mesenchymal Stem Cells from Wharton's Jelly Towards Neural Stem Cells Using A Feasible and Repeatable Protocol.
Nonivasive quantification of axon radii using diffusion MRI.
A Neuron-Optimized CRISPR/dCas9 Activation System for Robust and Specific Gene Regulation.
Neuroprotective Effect of Nortriptyline in Overt Hepatic Encephalopathy Through Attenuation of Mitochondrial Dysfunction.
Age-related macular degeneration phenotypes are associated with increased tumor necrosis-alpha and subretinal immune cells in aged Cxcr5 knockout mice.
Identification of mouse cochlear progenitors that develop hair and supporting cells in the organ of Corti.
Spatial and Sex-Dependent Responses of Adult Endogenous Neural Stem Cells to Alcohol Consumption.
Obesity, diabetes, and leptin resistance promote tau pathology in a mouse model of disease.
Analgesic effect of minocycline in rat model of inflammation-induced visceral pain.
Anakor E, Milla V, Connolly O, Martinat C, Pradat PF, Dumonceaux J, Duddy W, Duguez S
Cells 2022 Mar 1;11(5)
Cells 2022 Mar 1;11(5)
Low-dose metformin treatment in the subacute phase improves the locomotor function of a mouse model of spinal cord injury.
Song WY, Ding H, Dunn T, Gao JL, Labastida JA, Schlagal C, Ning GZ, Feng SQ, Wu P
Neural regeneration research 2021 Nov;16(11):2234-2242
Neural regeneration research 2021 Nov;16(11):2234-2242
Erythrocyte adenosine A2B receptor prevents cognitive and auditory dysfunction by promoting hypoxic and metabolic reprogramming.
Qiang Q, Manalo JM, Sun H, Zhang Y, Song A, Wen AQ, Wen YE, Chen C, Liu H, Cui Y, Nemkov T, Reisz JA, Edwards Iii G, Perreira FA, Kellems RE, Soto C, D'Alessandro A, Xia Y
PLoS biology 2021 Jun;19(6):e3001239
PLoS biology 2021 Jun;19(6):e3001239
Nicotine induces morphological and functional changes in astrocytes via nicotinic receptor activity.
Aryal SP, Fu X, Sandin JN, Neupane KR, Lakes JE, Grady ME, Richards CI
Glia 2021 Aug;69(8):2037-2053
Glia 2021 Aug;69(8):2037-2053
The effect of rosmarinic acid on deformities occurring in brain tissue by craniectomy method. Histopathological evaluation of IBA-1 and GFAP expressions.
Özevren H, Deveci E, Tuncer MC
Acta cirurgica brasileira 2020;35(4):e202000406
Acta cirurgica brasileira 2020;35(4):e202000406
Cellular and molecular outcomes of glutamine supplementation in the brain of succinic semialdehyde dehydrogenase-deficient mice.
Brown MN, Gibson KM, Schmidt MA, Walters DC, Arning E, Bottiglieri T, Roullet JB
JIMD reports 2020 Nov;56(1):58-69
JIMD reports 2020 Nov;56(1):58-69
Differentiation of Human Mesenchymal Stem Cells from Wharton's Jelly Towards Neural Stem Cells Using A Feasible and Repeatable Protocol.
Kruminis-Kaszkiel E, Osowski A, Bejer-Oleńska E, Dziekoński M, Wojtkiewicz J
Cells 2020 Mar 17;9(3)
Cells 2020 Mar 17;9(3)
Nonivasive quantification of axon radii using diffusion MRI.
Veraart J, Nunes D, Rudrapatna U, Fieremans E, Jones DK, Novikov DS, Shemesh N
eLife 2020 Feb 12;9
eLife 2020 Feb 12;9
A Neuron-Optimized CRISPR/dCas9 Activation System for Robust and Specific Gene Regulation.
Savell KE, Bach SV, Zipperly ME, Revanna JS, Goska NA, Tuscher JJ, Duke CG, Sultan FA, Burke JN, Williams D, Ianov L, Day JJ
eNeuro 2019 Jan-Feb;6(1)
eNeuro 2019 Jan-Feb;6(1)
Neuroprotective Effect of Nortriptyline in Overt Hepatic Encephalopathy Through Attenuation of Mitochondrial Dysfunction.
Jeong JH, Kim DK, Lee NS, Jeong YG, Kim HW, Kim JS, Han SY
ASN neuro 2018 Jan-Dec;10:1759091418810583
ASN neuro 2018 Jan-Dec;10:1759091418810583
Age-related macular degeneration phenotypes are associated with increased tumor necrosis-alpha and subretinal immune cells in aged Cxcr5 knockout mice.
Huang H, Liu Y, Wang L, Li W
PloS one 2017;12(3):e0173716
PloS one 2017;12(3):e0173716
Identification of mouse cochlear progenitors that develop hair and supporting cells in the organ of Corti.
Xu J, Ueno H, Xu CY, Chen B, Weissman IL, Xu PX
Nature communications 2017 May 11;8:15046
Nature communications 2017 May 11;8:15046
Spatial and Sex-Dependent Responses of Adult Endogenous Neural Stem Cells to Alcohol Consumption.
McGrath EL, Gao J, Kuo YF, Dunn TJ, Ray MJ, Dineley KT, Cunningham KA, Kaphalia BS, Wu P
Stem cell reports 2017 Dec 12;9(6):1916-1930
Stem cell reports 2017 Dec 12;9(6):1916-1930
Obesity, diabetes, and leptin resistance promote tau pathology in a mouse model of disease.
Platt TL, Beckett TL, Kohler K, Niedowicz DM, Murphy MP
Neuroscience 2016 Feb 19;315:162-74
Neuroscience 2016 Feb 19;315:162-74
Analgesic effect of minocycline in rat model of inflammation-induced visceral pain.
Kannampalli P, Pochiraju S, Bruckert M, Shaker R, Banerjee B, Sengupta JN
European journal of pharmacology 2014 Mar 15;727:87-98
European journal of pharmacology 2014 Mar 15;727:87-98
No comments: Submit comment
Supportive validation
- Submitted by
- Invitrogen Antibodies (provider)
- Main image

- Experimental details
- Western blot was performed using Anti-GFAP Rabbit Polyclonal Antibody (Product # PA1-10019) and a 50 kDa band corresponding to GFAP was observed across tissues tested except Mouse and Rat liver. Whole cell extracts (30 µg lysate) of Mouse brain (Lane 1), Rat brain (Lane 2), Mouse liver (Lane 3) and Rat liver (Lane 4) were electrophoresed using Novex® NuPAGE® 4-12 % Bis-Tris gel (Product # NP0321BOX). Resolved proteins were then transferred onto a nitrocellulose membrane (Product # IB23001) by iBlot® 2 Dry Blotting System (Product # IB21001). The blot was probed with the primary antibody (1:5000 dilution) and detected by chemiluminescence Goat anti-Rabbit IgG (H+L), Superclonal™ Recombinant Secondary Antibody, HRP (Product # A27036, 1:4000 dilution) using the iBright FL 1000 (Product # A32752). Chemiluminescent detection was performed using Novex® ECL Chemiluminescent Substrate Reagent Kit (Product # WP20005).

- Submitted by
- Invitrogen Antibodies (provider)
- Main image

- Experimental details
- Western blot analysis of GFAP in tissue lysates using a GFAP polyclonal antibody (Product # PA1-10019) at a dilution of 1:5,000 as seen in green. 1) protein standard (red), 2) rat brain, 3) rat spinal cord, 4) mouse brain, 5) mouse spinal cord. Strong band at about 50kDa corresponds to the major isotype of the GFAP protein. Smaller isotypes and proteolytic fragments of GFAP are also detected on the blot.

Supportive validation
- Submitted by
- Invitrogen Antibodies (provider)
- Main image
- Experimental details
- Immunofluorescent analysis of GFAP using a polyclonal antibody (Product # PA1-10019).

- Submitted by
- Invitrogen Antibodies (provider)
- Main image
- Experimental details
- Immunofluorescent analysis of GFAP using a polyclonal antibody (Product # PA1-10019).

- Submitted by
- Invitrogen Antibodies (provider)
- Main image
- Experimental details
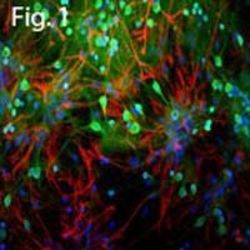
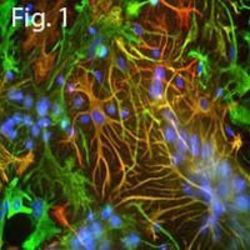
- Immunofluorescent analysis of GFAP in cortical neuron-glial cell culture. Culture is from an E20 rat that was stained with a GFAP polyclonal antibody (Product # PA1-10019) at a dilution of 1:5,000 as seen in red, with a Vimentin polyclonal antibody at a dilution of 1:10,000 as seen in green, and with DAPI staining of nuclear DNA as seen in blue. In this image the astrocytes containing GFAP only are red, GFAP and Vimentin are golden-yellow, and the fibroblastic cells only containing vimentin are green.

- Submitted by
- Invitrogen Antibodies (provider)
- Main image
- Experimental details
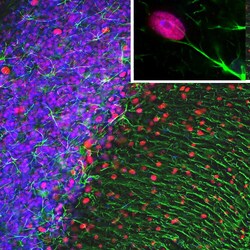
- Immunofluorescent analysis of GFAP in rat cerebellum section. The rat cerebellum section was obtained following transcardial perfusion of rat with 4% paraformaldehyde, brain was post fixed for 1 hour, cut to 45µM. Free-floating sections were stained with a GFAP polyclonal antibody (Product # PA1-10019) at a dilution of 1:5,000 as seen in green, with an MeCP2 monoclonal antibody at a dilution 1:500, as seen in red, and with a DAPI staining of nuclear DNA as seen in blue. In this image the GFAP antibody stains the network of astrocytic cells and the processes of Bergmann glia in the molecular layer. The MeCP2 antibody specifically labels nuclei of certain neurons.

Supportive validation
- Submitted by
- Invitrogen Antibodies (provider)
- Main image

- Experimental details
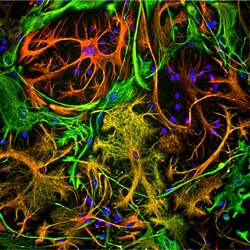
- Immunohistological analysis of GFAP in rat cerebellum. The rat cerebellum section was obtained following transcardial perfusion of the rat with 4% paraformaldehyde, brain was post fixed for 24 hours, and cut to 45µM. Free-floating sections were stained with an NF-H polyclonal antibody (Product # PA1-10002) at a dilution of 1:5,000 as seen in red, and costained with a GFAP polyclonal antibody (Product # PA1-10019) at a dilution of 1:5,000 as seen in green, and with DAPI staining the nuclear DNA in blue. The NF-H antibody labels network of axons of different neurons, while the GFAP antibody stains astrocytes and other glial cells.

Supportive validation
- Submitted by
- Invitrogen Antibodies (provider)
- Main image

- Experimental details
- Figure 4 Effect of metformin on the spinal cord lesion size in SCI mice at 14 days post-injury. (A-C) Longitudinal sections of mouse spinal cords were immunostained with an antibody against GFAP (green, stained by Alexa Fluor(r) 488), which outlines the boundary of the lesion site. Scale bar: 500 mum. The cavity areas in the 3 dpi group and the 0 dpi group are significantly smaller than those in the control group. (D) Quantitation of the lesion area (delineated by GFAP astroglial scar). Data are presented as the mean +- SEM ( n = 5). * P < 0.05, *** P < 0.001 (one-way analysis of variance followed by Bonferroni post hoc test). Control: Vehicle treated; 0 dpi or 3 dpi: the first dose of metformin given immediately or 3 days post SCI, respectively. GFAP: Glial fibrillary acidic protein; SCI: spinal cord injury.

- Submitted by
- Invitrogen Antibodies (provider)
- Main image

- Experimental details
- NULL

- Submitted by
- Invitrogen Antibodies (provider)
- Main image

- Experimental details
- Figure 3. Attenuation of neuronal death without affecting astrogliosis in SNc in OHE rats by NT administration. (a) Representative cresyl-violet-stained images of SNc in SHAM, BDL+VEH, and BDL+NT groups. SNc is depicted with the area bounded with a dotted line. For a clearer visualization, the rectangular boxed areas in upper panels (100x) are magnified as shown in lower panels (400x). Scale bar = 200 and 50 mum in upper and lower panels, respectively. (b) The average number of SNc neurons. Neuronal cell bodies with visible nucleoli were only counted. Representative TH immunohistochemistry images of SNc (c) and striatum (e) and the averaged TH immunoreactivities in SNc (d) and in striatum (f). Scale bar = 20 and 500 mum in panels (c) and (e), respectively. (g) Representative GFAP immunohistochemistry images and (h) the averaged GFAP immunoreactivities in SNc. Scale bar = 50 mum. To quantify the immunoreactivities of TH and GFAP, the randomly selected brain sections contained with SNc or striatum were photographed under the different magnification values. The ROI per high-power field were analyzed by Image J (v.1.49) and averaged per group. For all graphs, data are expressed as percentage of SHAM group ( n = 8 per group). * p < .01, ** p < .01, *** p < .001 versus SHAM group; # p < .05, ## p < .01 versus BDL+VEH group. BDL = bile duct ligation; VEH = vehicle; NT = nortriptyline; SNr = substantia nigra reticulate; NS = statistically not significant; GFAP = glial fibr

- Submitted by
- Invitrogen Antibodies (provider)
- Main image

- Experimental details
- Figure 3a - GFAP immunostaining (Control group). Positive GFAP expression was seen in astrocytes cell feet ( red arrow ) and some glia cell nuclei around the small capillary vessels in the brain cortex ( left parietal lobe ). Scale bar = 500 mum.

- Submitted by
- Invitrogen Antibodies (provider)
- Main image

- Experimental details
- Figure 3b - GFAP immunostaining (TBI group). GFAP reaction of apoptotic glia cells, irregularities and shortened extensions of astrocytes ( red arrow ) were observed with blood vessel dilatation ( left parietal lobe ). Scale bar = 500 mum.

- Submitted by
- Invitrogen Antibodies (provider)
- Main image

- Experimental details
- Figure 3c - GFAP immunostaining (TBI+ RA group). Regular astrocytes in blood vessels and GFAP expression was found to be positive ( yellow arrow ) ( left parietal lobe ). Scale bar = 500 mum.

- Submitted by
- Invitrogen Antibodies (provider)
- Main image

- Experimental details
- 7 FIGURE Anti-glial fibrillary acidic protein (GFAP) expression of control- and nicotine-treated astrocytes using antibody labeling (GFAP-Alexa 488). (a-d) Representative confocal images of fixed anti-GFAP labeled control astrocytes and the astrocytes treated with different concentrations (0.1, 1, and 10 muM) of nicotine for 24 hr (scale bar = 100 mum), (e,f) three-dimensional confocal images of fixed anti-GFAP labeled single control astrocyte and an astrocyte treated with 1 muM nicotine for 24 hr (scale bar = 30 mum). (g) Measurement of GFAP intensity of control astrocytes and astrocytes treated with different concentrations of nicotine for 24 hr. GFAP was quantified from the intensity of anti-GFAP Alexa 488 fluorescence normalized to number of cells in 24 well plates (50,000 cells) for control astrocytes and astrocytes treated with different concentrations of nicotine: 0.1, 1, and 100 muM for 24 hr. One-way analysis of variance (ANOVA) ( n = 47, p = .014). Bonferroni and Holm post hoc analysis: p = .685 for control versus 0.1 muM, p = .401 for control versus 1 muM nicotine-treated astrocytes, and ** p = .009 for control astrocytes versus astrocytes treated with 10 muM of nicotine for 24 hr. Data are expressed in the form of mean +- SEM and three to five independent experiments were performed [Color figure can be viewed at wileyonlinelibrary.com ]

- Submitted by
- Invitrogen Antibodies (provider)
- Main image

- Experimental details
- Figure 4 Effect of metformin on the spinal cord lesion size in SCI mice at 14 days post-injury. (A-C) Longitudinal sections of mouse spinal cords were immunostained with an antibody against GFAP (green, stained by Alexa Fluor(r) 488), which outlines the boundary of the lesion site. Scale bar: 500 mum. The cavity areas in the 3 dpi group and the 0 dpi group are significantly smaller than those in the control group. (D) Quantitation of the lesion area (delineated by GFAP astroglial scar). Data are presented as the mean +- SEM ( n = 5). * P < 0.05, *** P < 0.001 (one-way analysis of variance followed by Bonferroni post hoc test). Control: Vehicle treated; 0 dpi or 3 dpi: the first dose of metformin given immediately or 3 days post SCI, respectively. GFAP: Glial fibrillary acidic protein; SCI: spinal cord injury.

- Submitted by
- Invitrogen Antibodies (provider)
- Main image

- Experimental details
- Figure 5 Effect of metformin on the neuron and astrocytes in the spinal cord of SCI mice. GFAP (green, stained by Alexa Fluor(r) 488) and NeuN (red, stained by Alexa Fluor(r) 568) double-immunostained spinal cord tissue (longitudinally sectioned) around the lesion site at 14 dpi. (A-L) Merged images of the control, 0 dpi and 3 dpi groups (A, E, I; 4x original magnification, scale bar: 500 mum). GFAP (B, F, J) immunostaining and (C, G, K) NeuN immunostaining (10x original magnification, scale bars: 300 mum). Merged images (D, H, L; 40x original magnification, scale bar: 100 mum). In the 0 dpi and 3 dpi groups, more neurons were observed around the lesion site with a reduced number of astrocytes. In A, E and I, large yellow square insets are enlarged in B-C, F-G and J-K, respectively; whereas small yellow insets enlarged in D, H and L, respectively. The yellow arrows indicate neurons. (M, N) The number of neurons in 40x fields. (M) and GFAP immunopositivity (N). Data are presented as the mean +- SEM ( n = 5) * P < 0.05, ** P < 0.01 (one-way analysis of variance followed by Bonferroni post hoc test). Control: Vehicle treated; 0 dpi or 3 dpi: the first dose of metformin given immediately or 3 days post SCI, respectively. GFAP: Glial fibrillary acidic protein; NeuN: neuronal nuclear antigen; SCI: spinal cord injury.

- Submitted by
- Invitrogen Antibodies (provider)
- Main image

- Experimental details
- Effects of MuVs or lmEVs on astrocytes. ( A ) Quantification of astrocyte survival following treatment with EVs secreted by the myotubes of ALS or healthy subjects. ( B ) Representative images of astrocyte shapes. Green: GFAP staining, blue: DAPI. ( C ) Distributions of astrocyte shapes when treated or not with MuVs (NT-M = non-treated, H-M = treated with Healthy MuVs, A-M = treated with ALS MuVs) or with lmEVs (NT-L = non-treated, H-L = treated with Healthy lmEVs, A-L = treated with ALS lmEVs), ( n = 4 per treatment). **, p < 0.01, ***, p < 0.001, significantly different from NT, ##, p < 0.01, significantly different from Healthy MuV values, ns: non-significant. Plots are shown for ( D ) percentage of Ki67 positive astrocytes, ( E ) measurement of GFAP intensity in astrocytes, and ( F ) quantification of ROS production in rat astrocytes, following treatment with MuVs (ALS or Healthy) or lmEVs (ALS or Healthy) ( n = 3-4 per treatment). Dotted lines indicate levels for untreated cells or in ( D ) for H 2 O 2 positive control and NAC (N-acetyl cysteine) negative control. Lower panels: representative Western blots showing ( D ) the low expression level of PCNA in astrocytes, and ( E ) the constant expression level of GFAP in astrocytes, regardless of treatment; ns--non-significant.

- Submitted by
- Invitrogen Antibodies (provider)
- Main image

- Experimental details
- Figure 8. CRISPRa-mediated induction of Fosb is neuron-selective in vivo . A , B , IHC performed for ( A ) NeuN or ( B ) GFAP alongside Fosb demonstrates neuronal selectivity of CRISPRa-mediated Fosb induction. Scale bar = 50 mum. C , Pixel density quantification and cross-correlation analysis reveals a signal overlap between Fosb and NeuN and depletion of signal between Fosb and GFAP ( n = 2 animals with eight regions of interest). All data are expressed as mean +- SEM.

- Submitted by
- Invitrogen Antibodies (provider)
- Main image

- Experimental details
- Figure 3 Immunophenotype characterization of the representative hWJ-NSCs sample. ( a ) Expression of Nestin and SOX1. P1 gated on the plot represents the cell population of neural stem and progenitor cells (Nestin+/SOX1+) comprising 96.1% of the total cells; ( b ) expression of Ki67 and SOX1. P2 gated on the plot represents the Ki67+/SOX1+ cell population comprising 93.3% of the total cells; ( c ) expression of DCX and nestin. P3 gated on the plot represents glia and neural stem and progenitor cells (Nestin+/DCX-) comprising 93.7% of the total cells; ( d ) expression of Ki67 and SOX2. P4 gated on the plot represents Ki67+/SOX1+ cells comprising 93.3% of the total cells; ( e ) expression of DCX and nestin. P3 gated on the plot represents glia and neural stem and progenitor cells (Nestin+/DCX-) comprising 94.8% of the total cells; ( f ) expression of CD44 and SOX1. P5 gated on the plot represents glial cells (CD44+/SOX1+) comprising 96% of the total cells; ( g ) expression of DCX and GFAP. P6 gated on the plot represents astrocytes (GFAP+/DCX-) comprising 32.9% of the total cells. P7 gated on the plot represents DCX+/GFAP- cell population comprising 1.67% of the total cells; ( h ) expression of CD44 and SOX1. P5 gated on the plot represents glial cells (CD44+/SOX1+) comprising 99% of the total cells; U--unstained cell population gated on all plots. SOX1--sex-determining region Y (SRY) box 1; SOX2--sex-determining region Y (SRY) box 2; GFAP--glial fibrillary acidic protein; DCX-

- Submitted by
- Invitrogen Antibodies (provider)
- Main image

- Experimental details
- Figure 4 Immunofluorescence analysis of hWJ-MSCs vs. hWJ-NSCs. Comparison of expression of several markers: ( a ') expression of CD45 (red) in hWJ-NSCs compared to ( a ) expression of CD45 (red) in hWJ-MSCs; ( b ') expression of CD90 (red) in hWJ-NSCs compared to ( b ) expression of CD90 (red) in hWJ-MSCs; ( c ') expression of Ki67 (green) in hWJ-NSCs compared to ( c ) expression of Ki67 (green) in hWJ-MSCs; ( d ') expression of nestin (green) in hWJ-NSCs compared to ( d ) expression of nestin (green) in hWJ-MSCs; ( e ') expression of SOX2 (red) in hWJ-NSCs compared to ( e ) expression of SOX2 (red) in hWJ-MSCs; ( f ') expression of GFAP (red) in hWJ-NSCs compared to ( f ) expression of GFAP (red) in hWJ-MSCs; ( g ') expression of MAP2 (green) in hWJ-NSCs compared to ( g ) expression of MAP2 (green) in hWJ-MSCs; ( h ') expression of S100beta (green) in hWJ-NSCs compared to ( h ) expression of S100beta (green) in hWJ-MSCs; Cell nuclei counterstained with Hoechst (blue); Scale bar = 100 µm. hWJ-MSCs--human Wharton's jelly derived mesenchymal stem cells; hWJ-NSCs--human Wharton's jelly derived neural stem cells; SOX2--sex-determining region Y (SRY) box 2; GFAP--glial fibrillary acidic protein; MAP2--microtubule-associated protein 2; S100beta--S100 calcium-binding protein beta; Ki67--proliferation marker.

- Submitted by
- Invitrogen Antibodies (provider)
- Main image

- Experimental details
- Figure 5 Immunofluorescence analysis of differentiated cells (hWJ-NSCs). ( a ) Co-expression of SOX2 (red) and nestin (green); ( b ) co-expression of GFAP (red) and nestin (green), neurosphere-like structure (white arrow); ( c ) co-expression of GFAP (red) and S100beta (green); ( d ) co-expression of SOX2 (red) and MAP2 (green). Cell nuclei counterstained with Hoechst (blue). Scale bar = 100 µm. hWJ-MSCs--human Wharton's jelly derived mesenchymal stem cells; hWJ-NSCs--human Wharton's jelly derived neural stem cells; SOX2--sex-determining region Y (SRY) box 2; GFAP--glial fibrillary acidic protein; MAP2--microtubule-associated protein 2; S100beta--S100 calcium-binding protein beta.
