 Explore
 Validate
 Learn
Learn Western blot
 Immunocytochemistry
 Flow cytometry
Antibody data
- Antibody Data
- Antigen structure
- References [35]
- Comments [0]
- Validations
- Immunocytochemistry [3]
- Other assay [24]
Submit
Validation data
Reference
Comment
Report error
- Product number
- 14-9892-80 - Provider product page

- Provider
- Invitrogen Antibodies
- Product name
- GFAP Monoclonal Antibody (GA5), eBioscience™
- Antibody type
- Monoclonal
- Antigen
- Other
- Description
- Description: This GA5 monoclonal antibody reacts with human, mouse, rat, chicken, rabbit, and pig glial fibrillary acidic protein (GFAP). This 49-kDa type III intermediate filament protein is expressed in neural tissues and distinguishes astrocytes from other glial cells during central nervous system development. Three alternative splice variants of GFAP exist; however, alpha-GFAP is the predominant form expressed in astrocytes. GFAP can co-assemble with vimentin and nestin in astrocytes, but such associations are not required for assembly. Like other intermediate filaments, GFAP assembly is dependent on phosphorylation and dephosphorylation of the N-terminal domain. Studies have demonstrated that mutations in the GFAP gene lead to Alexander disease. Moreover, GFAP has also been shown to be overexpressed in certain glial-derived tumors. Applications Reported: This GA5 antibody has been reported for use in immunocytochemistry, western blotting, immunohistochemical staining of formalin-fixed paraffin embedded tissue sections, and flow cytometric analysis. Applications Tested: This GA5 antibody has been tested by immunoblotting of lysate prepared from mouse brain, immunocytochemistry of fixed and permeabilized C6 cells, and immunohistochemistry of FFPE human tissue using low pH antigen retrieval. This can be used at less than or equal to 5 µg/mL. Purity: Greater than 90%, as determined by SDS-PAGE. Aggregation: Less than 10%, as determined by HPLC. Filtration: 0.2 µm post-manufacturing filtered.
- Reactivity
- Human, Mouse, Rat, Chicken/Avian, Porcine, Rabbit
- Host
- Mouse
- Isotype
- IgG
- Antibody clone number
- GA5
- Vial size
- 25 μg
- Concentration
- 0.5 mg/mL
- Storage
- 4°C
Submitted references Monomeric C-reactive protein induces the cellular pathology of Alzheimer's disease.
Light-sheet mesoscopy with the Mesolens provides fast sub-cellular resolution imaging throughout large tissue volumes.
Cell type-specific biotin labeling in vivo resolves regional neuronal and astrocyte proteomic differences in mouse brain.
Single-cell transcriptomics and surface epitope detection in human brain epileptic lesions identifies pro-inflammatory signaling.
Studies of involvement of G-protein coupled receptor-3 in cannabidiol effects on inflammatory responses of mouse primary astrocytes and microglia.
Regionally diverse astrocyte subtypes and their heterogeneous response to EAE.
Developmental Role of Adenosine Kinase in the Cerebellum.
microRNAs (miR 9, 124, 155 and 224) transdifferentiate mouse macrophages to neurons.
CSF SERPINA3 Levels Are Elevated in Patients With Progressive MS.
The Role of Endoplasmic Reticulum in the Differential Endurance against Redox Stress in Cortical and Spinal Astrocytes from the Newborn SOD1(G93A) Mouse Model of Amyotrophic Lateral Sclerosis.
Bidens pilosa Extract Administered after Symptom Onset Attenuates Glial Activation, Improves Motor Performance, and Prolongs Survival in a Mouse Model of Amyotrophic Lateral Sclerosis.
Inhibition of GSK3β and RIP1K Attenuates Glial Scar Formation Induced by Ischemic Stroke via Reduction of Inflammatory Cytokine Production.
Plasma Levels of Neuron- and Astrocyte-Derived Exosomal Amyloid Beta1-42, Amyloid Beta1-40, and Phosphorylated Tau Levels in Schizophrenia Patients and Non-psychiatric Comparison Subjects: Relationships With Cognitive Functioning and Psychopathology.
Oxidative stress in the retina and retinal pigment epithelium (RPE): Role of aging, and DJ-1.
Neuroprotective effect of ACTH on collagenase-induced peri-intraventricular hemorrhage in newborn male rats.
Muscovite nanoparticles mitigate neuropathic pain by modulating the inflammatory response and neuroglial activation in the spinal cord.
Flow-cytometric microglial sorting coupled with quantitative proteomics identifies moesin as a highly-abundant microglial protein with relevance to Alzheimer's disease.
Neuronal Mitochondria Modulation of LPS-Induced Neuroinflammation.
Characterisation of the inflammatory cytokine and growth factor profile in a rabbit model of proliferative vitreoretinopathy.
Obesity-Induced Cellular Senescence Drives Anxiety and Impairs Neurogenesis.
FGL2 promotes tumor progression in the CNS by suppressing CD103(+) dendritic cell differentiation.
CHIMERA repetitive mild traumatic brain injury induces chronic behavioural and neuropathological phenotypes in wild-type and APP/PS1 mice.
Adverse early life environment induces anxiety-like behavior and increases expression of FKBP5 mRNA splice variants in mouse brain.
Nfat/calcineurin signaling promotes oligodendrocyte differentiation and myelination by transcription factor network tuning.
Vitamin D receptor expression is essential during retinal vascular development and attenuation of neovascularization by 1, 25(OH)2D3.
Roles of Pannexin-1 Channels in Inflammatory Response through the TLRs/NF-Kappa B Signaling Pathway Following Experimental Subarachnoid Hemorrhage in Rats.
Depletion of microglia exacerbates postischemic inflammation and brain injury.
Cellular Microbiology of Mycoplasma canis.
Estrogen receptor-α is localized to neurofibrillary tangles in Alzheimer's disease.
Atoxic derivative of botulinum neurotoxin A as a prototype molecular vehicle for targeted delivery to the neuronal cytoplasm.
Learning induces sonic hedgehog signaling in the amygdala which promotes neurogenesis and long-term memory formation.
GFAP and its role in Alexander disease.
Immunohistochemistry of the glial fibrillary acidic protein: basic and applied considerations.
Neuronal modulation of Schwann cell glial fibrillary acidic protein (GFAP).
Quantitation of glial fibrillary acidic protein in human brain tumours.
Gan Q, Wong A, Zhang Z, Na H, Tian H, Tao Q, Rajab IM, Potempa LA, Qiu WQ
Alzheimer's & dementia (New York, N. Y.) 2022;8(1):e12319
Alzheimer's & dementia (New York, N. Y.) 2022;8(1):e12319
Light-sheet mesoscopy with the Mesolens provides fast sub-cellular resolution imaging throughout large tissue volumes.
Battistella E, Schniete J, Wesencraft K, Quintana JF, McConnell G
iScience 2022 Sep 16;25(9):104797
iScience 2022 Sep 16;25(9):104797
Cell type-specific biotin labeling in vivo resolves regional neuronal and astrocyte proteomic differences in mouse brain.
Rayaprolu S, Bitarafan S, Santiago JV, Betarbet R, Sunna S, Cheng L, Xiao H, Nelson RS, Kumar P, Bagchi P, Duong DM, Goettemoeller AM, Oláh VJ, Rowan M, Levey AI, Wood LB, Seyfried NT, Rangaraju S
Nature communications 2022 May 25;13(1):2927
Nature communications 2022 May 25;13(1):2927
Single-cell transcriptomics and surface epitope detection in human brain epileptic lesions identifies pro-inflammatory signaling.
Kumar P, Lim A, Hazirah SN, Chua CJH, Ngoh A, Poh SL, Yeo TH, Lim J, Ling S, Sutamam NB, Petretto E, Low DCY, Zeng L, Tan EK, Arkachaisri T, Yeo JG, Ginhoux F, Chan D, Albani S
Nature neuroscience 2022 Jul;25(7):956-966
Nature neuroscience 2022 Jul;25(7):956-966
Studies of involvement of G-protein coupled receptor-3 in cannabidiol effects on inflammatory responses of mouse primary astrocytes and microglia.
Wu J, Chen N, Liu Y, Godlewski G, Kaplan HJ, Shrader SH, Song ZH, Shao H
PloS one 2021;16(5):e0251677
PloS one 2021;16(5):e0251677
Regionally diverse astrocyte subtypes and their heterogeneous response to EAE.
Borggrewe M, Grit C, Vainchtein ID, Brouwer N, Wesseling EM, Laman JD, Eggen BJL, Kooistra SM, Boddeke EWGM
Glia 2021 May;69(5):1140-1154
Glia 2021 May;69(5):1140-1154
Developmental Role of Adenosine Kinase in the Cerebellum.
Gebril H, Wahba A, Zhou X, Lai T, Alharfoush E, DiCicco-Bloom E, Boison D
eNeuro 2021 May-Jun;8(3)
eNeuro 2021 May-Jun;8(3)
microRNAs (miR 9, 124, 155 and 224) transdifferentiate mouse macrophages to neurons.
Challagundla N, Agrawal-Rajput R
Experimental cell research 2021 May 1;402(1):112563
Experimental cell research 2021 May 1;402(1):112563
CSF SERPINA3 Levels Are Elevated in Patients With Progressive MS.
Fissolo N, Matute-Blanch C, Osman M, Costa C, Pinteac R, Miró B, Sanchez A, Brito V, Dujmovic I, Voortman M, Khalil M, Borràs E, Sabidó E, Issazadeh-Navikas S, Montalban X, Comabella Lopez M
Neurology(R) neuroimmunology & neuroinflammation 2021 Mar;8(2)
Neurology(R) neuroimmunology & neuroinflammation 2021 Mar;8(2)
The Role of Endoplasmic Reticulum in the Differential Endurance against Redox Stress in Cortical and Spinal Astrocytes from the Newborn SOD1(G93A) Mouse Model of Amyotrophic Lateral Sclerosis.
Marini C, Cossu V, Kumar M, Milanese M, Cortese K, Bruno S, Bellese G, Carta S, Zerbo RA, Torazza C, Bauckneht M, Venturi C, Raffa S, Orengo AM, Donegani MI, Chiola S, Ravera S, Castellani P, Morbelli S, Sambuceti G, Bonanno G
Antioxidants (Basel, Switzerland) 2021 Aug 30;10(9)
Antioxidants (Basel, Switzerland) 2021 Aug 30;10(9)
Bidens pilosa Extract Administered after Symptom Onset Attenuates Glial Activation, Improves Motor Performance, and Prolongs Survival in a Mouse Model of Amyotrophic Lateral Sclerosis.
Kosuge Y, Kaneko E, Nango H, Miyagishi H, Ishige K, Ito Y
Oxidative medicine and cellular longevity 2020;2020:1020673
Oxidative medicine and cellular longevity 2020;2020:1020673
Inhibition of GSK3β and RIP1K Attenuates Glial Scar Formation Induced by Ischemic Stroke via Reduction of Inflammatory Cytokine Production.
Liu J, Zhu YM, Guo Y, Lin L, Wang ZX, Gu F, Dong XY, Zhou M, Wang YF, Zhang HL
Frontiers in pharmacology 2020;11:812
Frontiers in pharmacology 2020;11:812
Plasma Levels of Neuron- and Astrocyte-Derived Exosomal Amyloid Beta1-42, Amyloid Beta1-40, and Phosphorylated Tau Levels in Schizophrenia Patients and Non-psychiatric Comparison Subjects: Relationships With Cognitive Functioning and Psychopathology.
Lee EE, Winston-Gray C, Barlow JW, Rissman RA, Jeste DV
Frontiers in psychiatry 2020;11:532624
Frontiers in psychiatry 2020;11:532624
Oxidative stress in the retina and retinal pigment epithelium (RPE): Role of aging, and DJ-1.
Upadhyay M, Milliner C, Bell BA, Bonilha VL
Redox biology 2020 Oct;37:101623
Redox biology 2020 Oct;37:101623
Neuroprotective effect of ACTH on collagenase-induced peri-intraventricular hemorrhage in newborn male rats.
Martins CA, Neves LT, de Oliveira MMBP, Bagatini PB, Barboza R, Mestriner RG, Xavier LL, Rasia-Filho AA
Scientific reports 2020 Oct 20;10(1):17734
Scientific reports 2020 Oct 20;10(1):17734
Muscovite nanoparticles mitigate neuropathic pain by modulating the inflammatory response and neuroglial activation in the spinal cord.
Oh JY, Hwang TY, Jang JH, Park JY, Ryu Y, Lee H, Park HJ
Neural regeneration research 2020 Nov;15(11):2162-2168
Neural regeneration research 2020 Nov;15(11):2162-2168
Flow-cytometric microglial sorting coupled with quantitative proteomics identifies moesin as a highly-abundant microglial protein with relevance to Alzheimer's disease.
Rayaprolu S, Gao T, Xiao H, Ramesha S, Weinstock LD, Shah J, Duong DM, Dammer EB, Webster JA Jr, Lah JJ, Wood LB, Betarbet R, Levey AI, Seyfried NT, Rangaraju S
Molecular neurodegeneration 2020 May 7;15(1):28
Molecular neurodegeneration 2020 May 7;15(1):28
Neuronal Mitochondria Modulation of LPS-Induced Neuroinflammation.
Harland M, Torres S, Liu J, Wang X
The Journal of neuroscience : the official journal of the Society for Neuroscience 2020 Feb 19;40(8):1756-1765
The Journal of neuroscience : the official journal of the Society for Neuroscience 2020 Feb 19;40(8):1756-1765
Characterisation of the inflammatory cytokine and growth factor profile in a rabbit model of proliferative vitreoretinopathy.
Wong CW, Cheung N, Ho C, Barathi V, Storm G, Wong TT
Scientific reports 2019 Oct 28;9(1):15419
Scientific reports 2019 Oct 28;9(1):15419
Obesity-Induced Cellular Senescence Drives Anxiety and Impairs Neurogenesis.
Ogrodnik M, Zhu Y, Langhi LGP, Tchkonia T, Krüger P, Fielder E, Victorelli S, Ruswhandi RA, Giorgadze N, Pirtskhalava T, Podgorni O, Enikolopov G, Johnson KO, Xu M, Inman C, Palmer AK, Schafer M, Weigl M, Ikeno Y, Burns TC, Passos JF, von Zglinicki T, Kirkland JL, Jurk D
Cell metabolism 2019 May 7;29(5):1061-1077.e8
Cell metabolism 2019 May 7;29(5):1061-1077.e8
FGL2 promotes tumor progression in the CNS by suppressing CD103(+) dendritic cell differentiation.
Yan J, Zhao Q, Gabrusiewicz K, Kong LY, Xia X, Wang J, Ott M, Xu J, Davis RE, Huo L, Rao G, Sun SC, Watowich SS, Heimberger AB, Li S
Nature communications 2019 Jan 25;10(1):448
Nature communications 2019 Jan 25;10(1):448
CHIMERA repetitive mild traumatic brain injury induces chronic behavioural and neuropathological phenotypes in wild-type and APP/PS1 mice.
Cheng WH, Martens KM, Bashir A, Cheung H, Stukas S, Gibbs E, Namjoshi DR, Button EB, Wilkinson A, Barron CJ, Cashman NR, Cripton PA, Wellington CL
Alzheimer's research & therapy 2019 Jan 12;11(1):6
Alzheimer's research & therapy 2019 Jan 12;11(1):6
Adverse early life environment induces anxiety-like behavior and increases expression of FKBP5 mRNA splice variants in mouse brain.
Ke X, Fu Q, Majnik A, Cohen S, Liu Q, Lane R
Physiological genomics 2018 Nov 1;50(11):973-981
Physiological genomics 2018 Nov 1;50(11):973-981
Nfat/calcineurin signaling promotes oligodendrocyte differentiation and myelination by transcription factor network tuning.
Weider M, Starost LJ, Groll K, Küspert M, Sock E, Wedel M, Fröb F, Schmitt C, Baroti T, Hartwig AC, Hillgärtner S, Piefke S, Fadler T, Ehrlich M, Ehlert C, Stehling M, Albrecht S, Jabali A, Schöler HR, Winkler J, Kuhlmann T, Wegner M
Nature communications 2018 Mar 2;9(1):899
Nature communications 2018 Mar 2;9(1):899
Vitamin D receptor expression is essential during retinal vascular development and attenuation of neovascularization by 1, 25(OH)2D3.
Jamali N, Wang S, Darjatmoko SR, Sorenson CM, Sheibani N
PloS one 2017;12(12):e0190131
PloS one 2017;12(12):e0190131
Roles of Pannexin-1 Channels in Inflammatory Response through the TLRs/NF-Kappa B Signaling Pathway Following Experimental Subarachnoid Hemorrhage in Rats.
Wu LY, Ye ZN, Zhou CH, Wang CX, Xie GB, Zhang XS, Gao YY, Zhang ZH, Zhou ML, Zhuang Z, Liu JP, Hang CH, Shi JX
Frontiers in molecular neuroscience 2017;10:175
Frontiers in molecular neuroscience 2017;10:175
Depletion of microglia exacerbates postischemic inflammation and brain injury.
Jin WN, Shi SX, Li Z, Li M, Wood K, Gonzales RJ, Liu Q
Journal of cerebral blood flow and metabolism : official journal of the International Society of Cerebral Blood Flow and Metabolism 2017 Jun;37(6):2224-2236
Journal of cerebral blood flow and metabolism : official journal of the International Society of Cerebral Blood Flow and Metabolism 2017 Jun;37(6):2224-2236
Cellular Microbiology of Mycoplasma canis.
Michaels DL, Leibowitz JA, Azaiza MT, Shil PK, Shama SM, Kutish GF, Distelhorst SL, Balish MF, May MA, Brown DR
Infection and immunity 2016 Jun;84(6):1785-1795
Infection and immunity 2016 Jun;84(6):1785-1795
Estrogen receptor-α is localized to neurofibrillary tangles in Alzheimer's disease.
Wang C, Zhang F, Jiang S, Siedlak SL, Shen L, Perry G, Wang X, Tang B, Zhu X
Scientific reports 2016 Feb 3;6:20352
Scientific reports 2016 Feb 3;6:20352
Atoxic derivative of botulinum neurotoxin A as a prototype molecular vehicle for targeted delivery to the neuronal cytoplasm.
Vazquez-Cintron EJ, Vakulenko M, Band PA, Stanker LH, Johnson EA, Ichtchenko K
PloS one 2014;9(1):e85517
PloS one 2014;9(1):e85517
Learning induces sonic hedgehog signaling in the amygdala which promotes neurogenesis and long-term memory formation.
Hung HC, Hsiao YH, Gean PW
The international journal of neuropsychopharmacology 2014 Dec 13;18(3)
The international journal of neuropsychopharmacology 2014 Dec 13;18(3)
GFAP and its role in Alexander disease.
Quinlan RA, Brenner M, Goldman JE, Messing A
Experimental cell research 2007 Jun 10;313(10):2077-87
Experimental cell research 2007 Jun 10;313(10):2077-87
Immunohistochemistry of the glial fibrillary acidic protein: basic and applied considerations.
McLendon RE, Bigner DD
Brain pathology (Zurich, Switzerland) 1994 Jul;4(3):221-8
Brain pathology (Zurich, Switzerland) 1994 Jul;4(3):221-8
Neuronal modulation of Schwann cell glial fibrillary acidic protein (GFAP).
Mokuno K, Kamholz J, Behrman T, Black C, Sessa M, Feinstein D, Lee V, Pleasure D
Journal of neuroscience research 1989 Aug;23(4):396-405
Journal of neuroscience research 1989 Aug;23(4):396-405
Quantitation of glial fibrillary acidic protein in human brain tumours.
Rasmussen S, Bock E, Warecka K, Althage G
British journal of cancer 1980 Jan;41(1):113-6
British journal of cancer 1980 Jan;41(1):113-6
No comments: Submit comment
Supportive validation
- Submitted by
- Invitrogen Antibodies (provider)
- Main image
- Experimental details
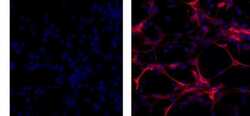
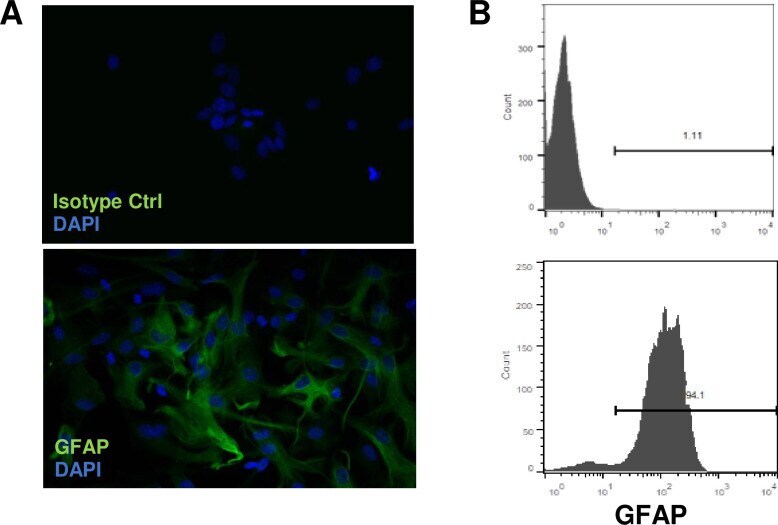
- Immunocytochemistry of fixed and permeabilized C6 cells using 1 µg/mL of Mouse IgG1 K Isotype Control Purified (Product # 14-4714-82) (left) or 1 µg/mL of Anti-GFAP Purified (right) followed by Anti-Mouse TRITC.Nuclei are counterstained with DAPI.

- Submitted by
- Invitrogen Antibodies (provider)
- Main image

- Experimental details
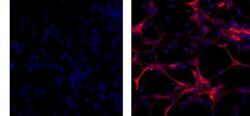
- Immunocytochemistry of fixed and permeabilized C6 cells using 1 µg/mL of Mouse IgG1 K Isotype Control Purified (Product # 14-4714-82) (left) or 1 µg/mL of Anti-GFAP Purified (right) followed by Anti-Mouse TRITC.Nuclei are counterstained with DAPI.

- Submitted by
- Invitrogen Antibodies (provider)
- Main image
- Experimental details
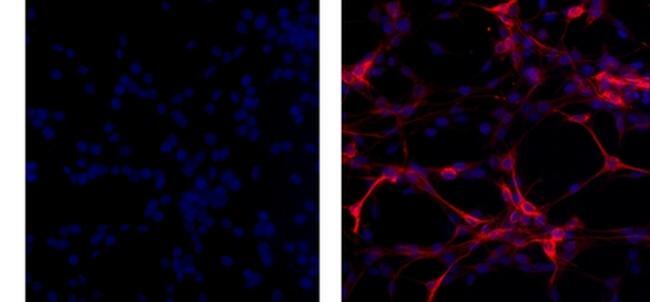
- Immunocytochemistry of fixed and permeabilized C6 cells using 1 µg/mL of Mouse IgG1 K Isotype Control Purified (Product # 14-4714-82) (left) or 1 µg/mL of Anti-GFAP Purified (right) followed by Anti-Mouse TRITC.Nuclei are counterstained with DAPI.
Supportive validation
- Submitted by
- Invitrogen Antibodies (provider)
- Main image
- Experimental details
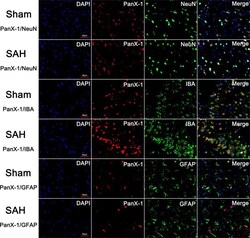
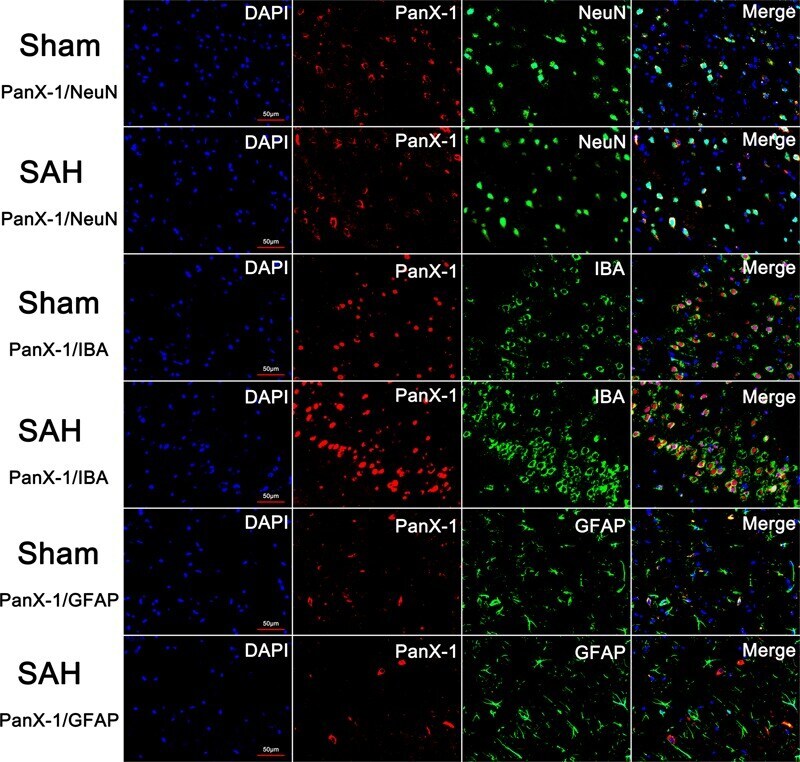
- FIGURE 4 The expression and distribution of Pannexin-1 Channels were detected by double immunofluorescent staining. Pannexin-1 Channels/NeuN, Pannexin-1 Channels/IBA and Pannexin-1 Channels/GFAP co-staining in the Sham group and SAH group (Pannexin-1 Channel = red, NeuN, IBA and GFAP = green, DAPI = blue). According to the result of immunofluorescence staining, at the cellular level, Pannexin-1 Channels were expressed mainly in neurons and microglial cells, whereas infrequently expressed in astrocytes. Data not shown.
- Submitted by
- Invitrogen Antibodies (provider)
- Main image
- Experimental details
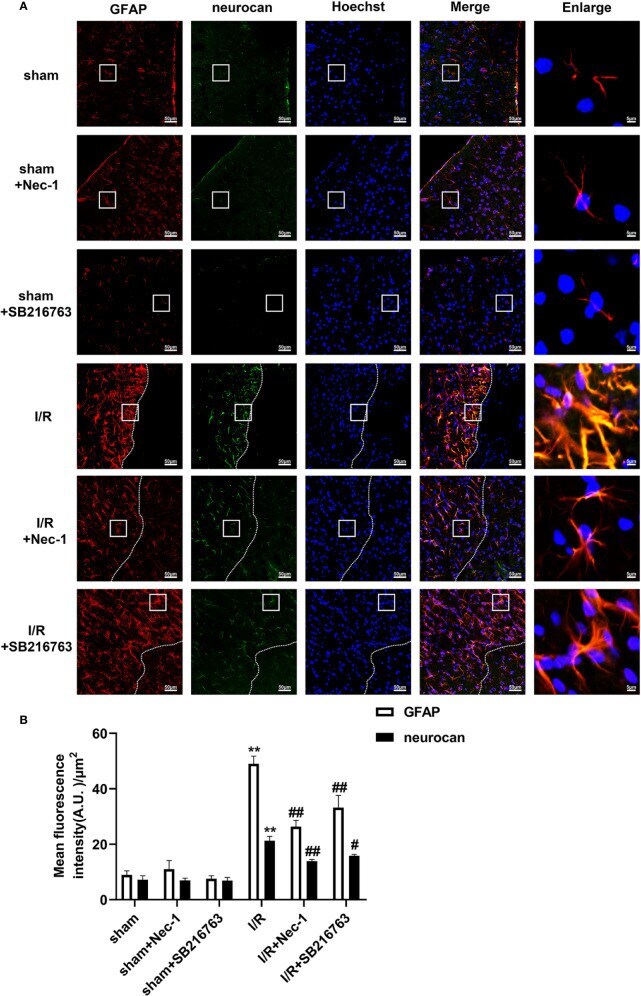
- Figure 3 SB216763 and Nec-1 reduces the fluorescence intensity of glial fibrillary acidic protein (GFAP) and neurocan in astrocytes after ischemia/reperfusion (I/R) in rats. SB216763 (400 pmol) or Nec1 (48 nmol) was intracerebroventricularly administered before ischemia. (A) Representative images of GFAP, neurocan, and Hoechst staining in the peri-infarct zones of the sham or cerebral ischemic cortex at 7 d after reperfusion following tMCAO for 90 min (GFAP: red; neurocan: green; Hoechst: blue). The white dotted line represents the edge between the infarct area and the peri-infarct zones, and the white boxes indicate the corresponding area of the enlarged images shown below. (B) Quantification of fluorescence intensity of GFAP and neurocan in panel A. Mean +- SD, n = 3. ** P < 0.01 vs. sham group; # P < 0.05, ## P < 0.01 vs. I/R group.
- Submitted by
- Invitrogen Antibodies (provider)
- Main image
- Experimental details
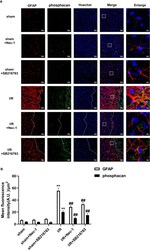
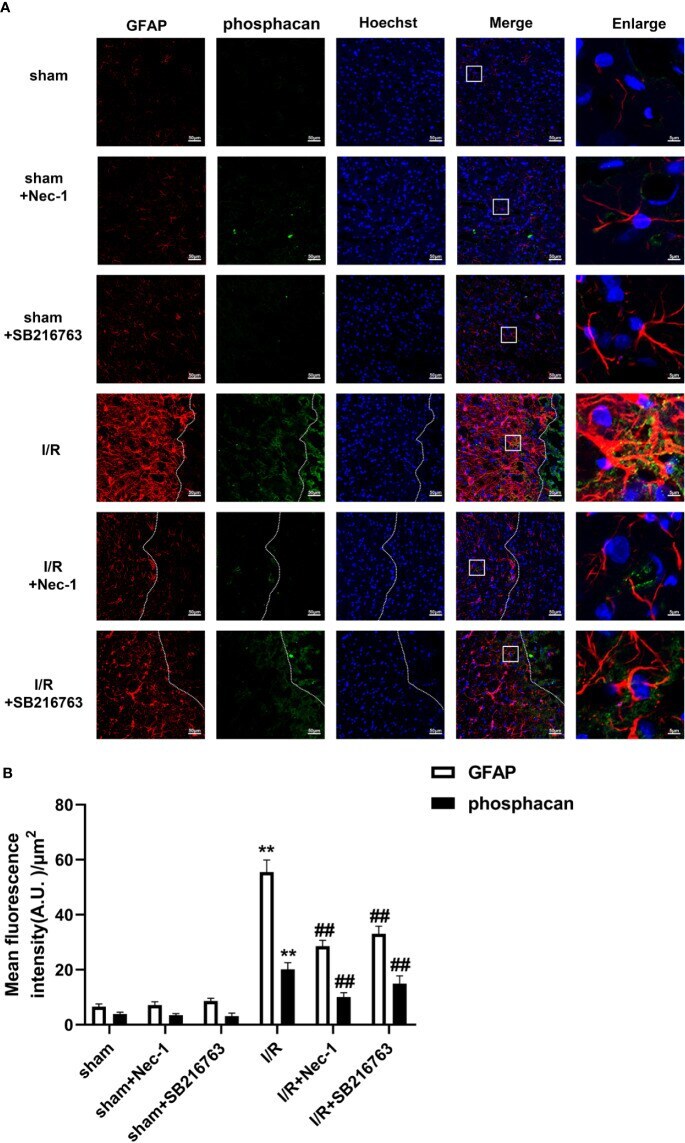
- Figure 4 SB216763 and Nec-1 reduces the fluorescence intensity of glial fibrillary acidic protein (GFAP) and phosphacan in astrocytes after ischemia/reperfusion (I/R). SB216763 (400 pmol) or Nec1 (48 nmol) was intracerebroventricularly administered before ischemia. (A) Representative images of GFAP, phosphacan, and Hoechst staining in the peri-infarct zones of the sham or cerebral ischemic cortex at 7 d after reperfusion following tMCAO for 90 min (GFAP: red; phosphacan: green; Hoechst: blue). The white dotted line represents the edge between the infarct area and the peri-infarct zones, and the white boxes indicate the corresponding area of the enlarged images shown below. (B) Quantification of fluorescence intensity of GFAP and phosphacan in panel A. Mean +- SD, n = 3. ** P < 0.01 vs. sham group; ## P < 0.01 vs. I/R group.
- Submitted by
- Invitrogen Antibodies (provider)
- Main image
- Experimental details
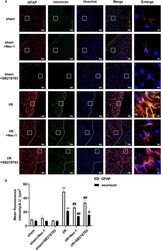
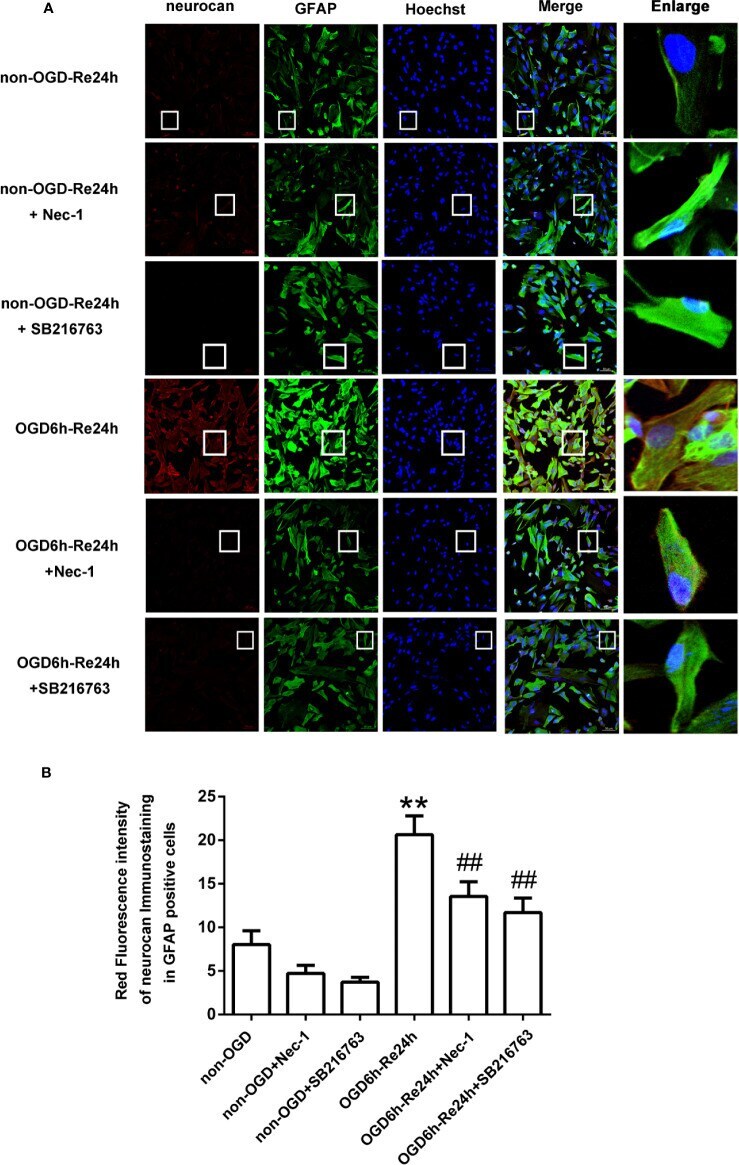
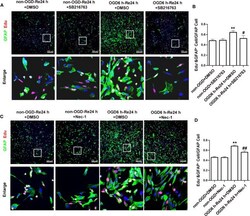
- Figure 5 SB216763 and Nec-1 reduce the fluorescence intensity of neurocan in astrocytes. (A) Fluorescent double-immunostaining of glial fibrillary acidic protein (GFAP) and neurocan in primary cultured astrocytes exposed to oxygen and glucose deprivation (OGD) for 6 h and reoxygenation for 24 h after treatment with Nec-1 (100 muM) and SB216763 (5 muM) (neurocan: red; GFAP: green; Hoechst: blue). (B) Quantification of fluorescence intensity of neurocan in panel A. Mean +- SD, n = 3. ** P < 0.01 vs. non-OGD-Re24 h group; ## P < 0.01 vs. OGD6 h-Re24 h group.
- Submitted by
- Invitrogen Antibodies (provider)
- Main image
- Experimental details
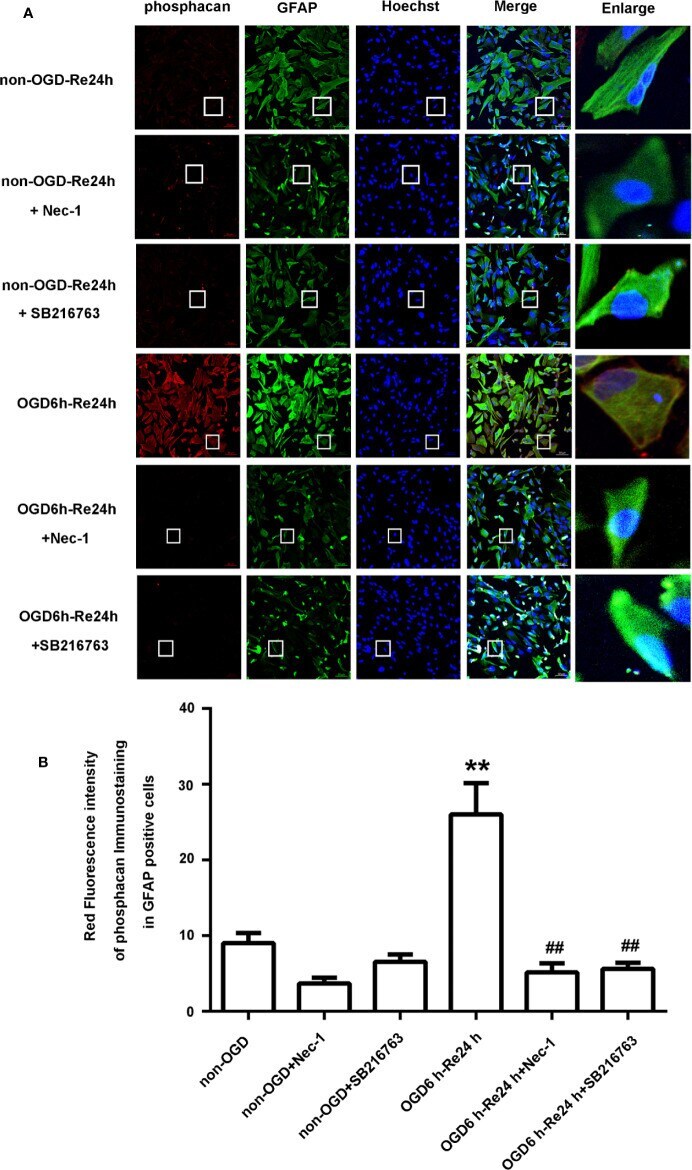
- Figure 6 SB216763 and Nec-1 reduce the fluorescence intensity of phosphacan in astrocytes. (A) Fluorescent double-immunostaining of glial fibrillary acidic protein (GFAP) and phosphacan in primary cultured astrocytes exposed to oxygen and glucose deprivation (OGD) for 6 h and reoxygenation for 24 h after treatment with Nec-1 (100 muM) and SB216763 (5 muM) (phosphacan: red; GFAP: green; Hoechst: blue). (B) Quantification of fluorescence intensity of phosphacan in panel A. Mean +- SD, n = 3. ** P < 0.05 vs. non-OGD-Re24 h group; ## P < 0.01 vs. OGD6 h-Re24 h group.
- Submitted by
- Invitrogen Antibodies (provider)
- Main image
- Experimental details
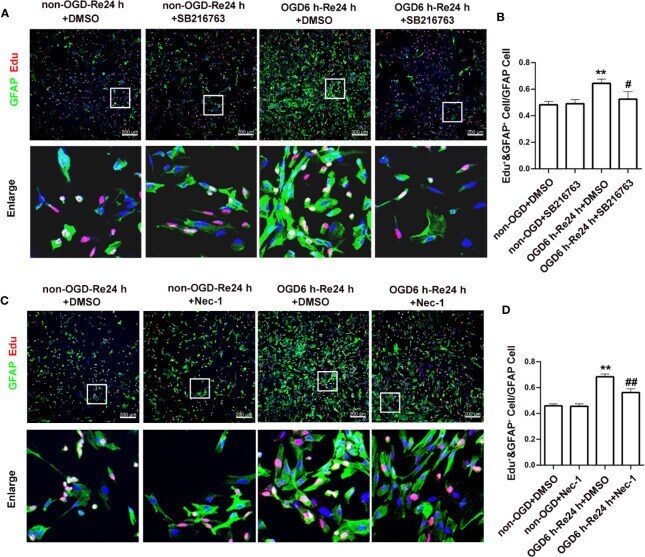
- Figure 7 SB216763 and Nec-1 inhibit astrocyte proliferation. (A, C) . Astrocyte proliferation was measured by double-staining with EdU and glial fibrillary acidic protein (GFAP). The proportion of EdU-positive cells was significantly reduced after SB216763 and Nec-1 treatment (EdU: red; GFAP: green; Hoechst: blue). (B, D) . Quantification of fluorescence intensity of EdU and GFAP double-positive cells in panels A and B. Mean +- SD, n = 3. ** P < 0.05 vs. non-OGD-Re24 h+DMSO group; # P < 0.05, ## P < 0.01 vs. OGD6 h-Re24 h+DMSO group.
- Submitted by
- Invitrogen Antibodies (provider)
- Main image
- Experimental details
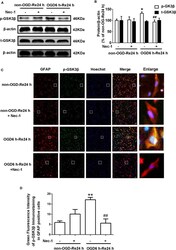
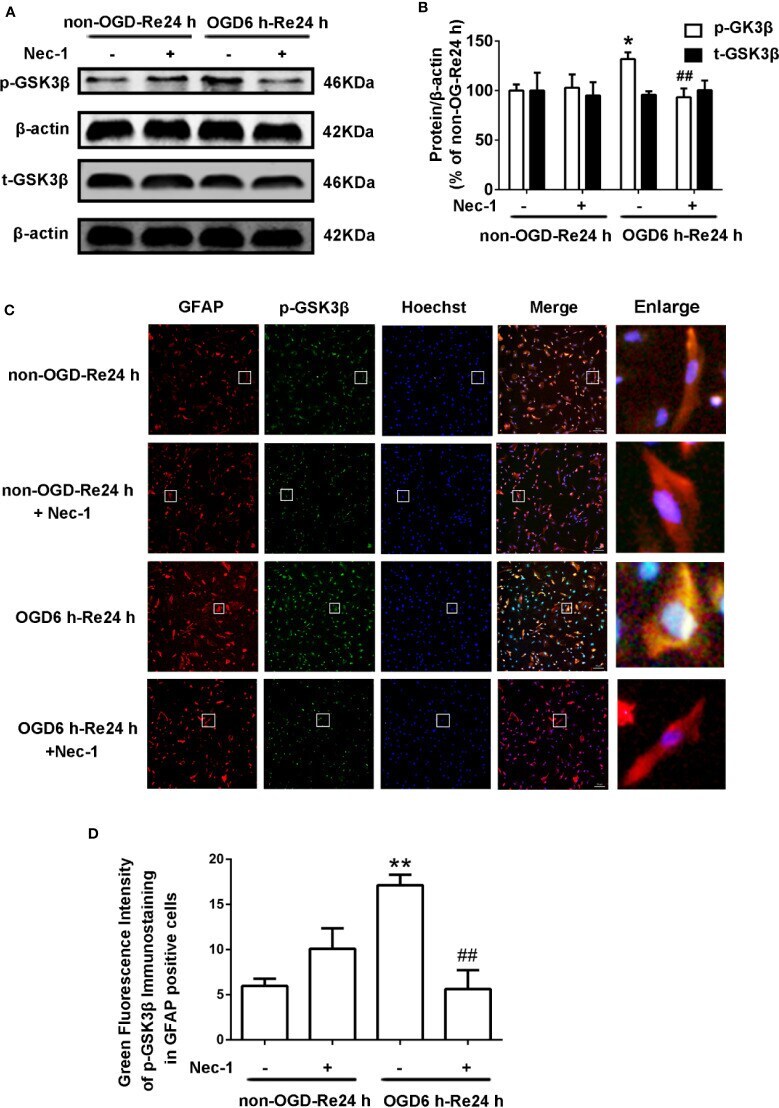
- Figure 13 Nec-1 reduces the levels of p-GSK3beta in astrocytes exposed to OGD for 6 h and reoxygenation for 24 h. Astrocytes were treated with or without Nec-1 (100 muM) during OGD and reoxygenation. (A, B) Representative images from Western blotting (WB) analysis of the p-GSK3beta and t-GSK3beta. Columns present data from the quantitative analysis of p-GSK3beta and t-GSK3beta immunoblots, respectively. beta-Actin protein was used as a loading control. Mean +- SD, n = 3. * P < 0.05 vs. non-OGD-Re24 h group; ## P < 0.01 vs. OGD6 h-Re24 h group. (C) Fluorescent double-immunostaining of glial fibrillary acidic protein (GFAP) and p-GSK3beta in primary cultured astrocytes (GFAP: red; p-GSK3beta: green; Hoechst: blue). (D) Quantification of fluorescence intensity of p-GSK3beta immunostaining in panel C. Mean +- SD, n = 3. ** P < 0.01 vs. non-OGD-Re24 h group; ## P < 0.01 vs. OGD6 h-Re24 h group.
- Submitted by
- Invitrogen Antibodies (provider)
- Main image
- Experimental details
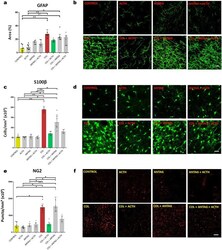
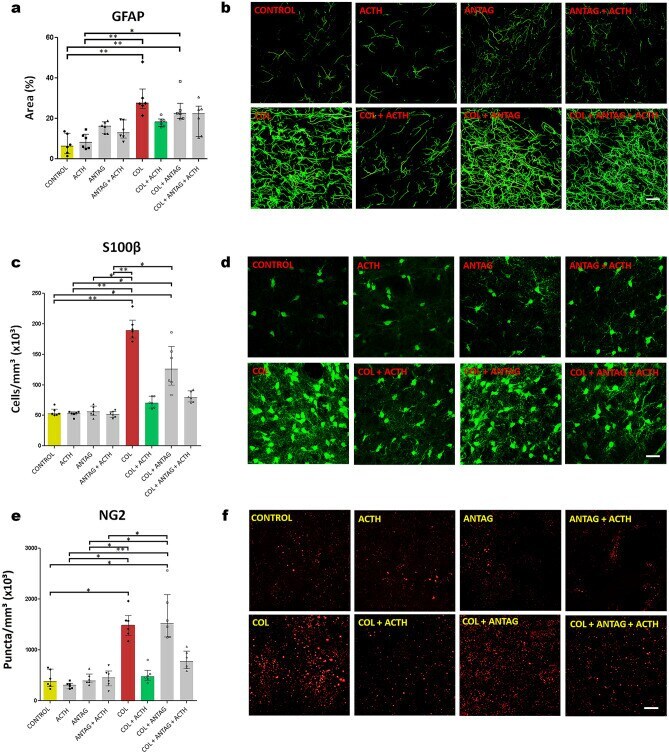
- Figure 3 Data (median and interquartile ranges) for ( a ) the area covered by GFAP fluorescent immunoreactivity and the numerical density of ( c ) S100beta cells and ( e ) NG2-glia immunoreactive puncta (n = 6 in all groups) in the right striatum adjacent to the microinjection site in the germinal matrix of newborn male rats. Symbols represent values obtained for each rat. * p < 0.05 and ** p < 0.01 in each comparison indicated. Note the control values and the effects of collagenase and collagenase plus ACTH. ( b , d , and f ) are representative images of the corresponding results in each experimental group and biomarker studied. Scale bar = 25 um.
- Submitted by
- Invitrogen Antibodies (provider)
- Main image
- Experimental details
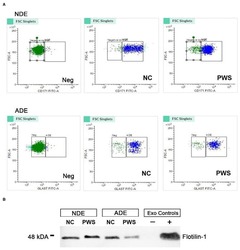
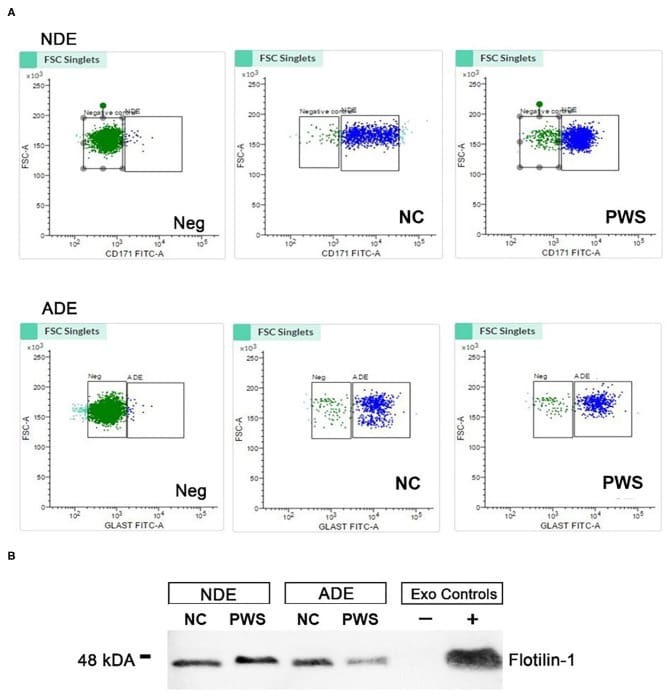
- Figure 1 Characterization of neuronal (NDE) and astrocyte derived exosomes (ADE)s. (A) FACS analysis of plasma NDEs and ADEs following the formation of bead-antibody-exosome (BAE)--FITC complexes. Streptavidin magnetic beads were incubated with exosomes isolated from non-psychiatric comparison subjects (NC) and people with schizophrenia (PWS) ( n = 60) and enriched against biotinylated anti-human CD171 biotin (L1CAM, NDE) or anti-GLAST antibody (ADE). BAE complexes are stained with FITC prior to FACS. (B) Plasma NDE and ADE preparations from NC and PWS patients were probed with exosome marker, Flotilin-1 (1:1000). Non-exosome fraction (supernant resulting from 1 h spin at 1500G) served as the negative control while total exosomes (diluted in 1x PBS prior to neuronal and astrocyte enrichment) served as the positive control. The resultant Western Blot demonstrated that NDEs are Flotillin and Neun positive and GFAP negative. However, we were not able to get a signal for the ADEs. Due to multiple freeze-thaw cycles, the integrity of the samples used in the current study had diminished significantly.
- Submitted by
- Invitrogen Antibodies (provider)
- Main image
- Experimental details
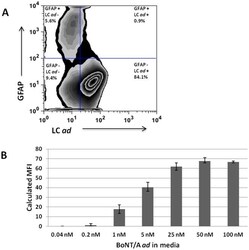
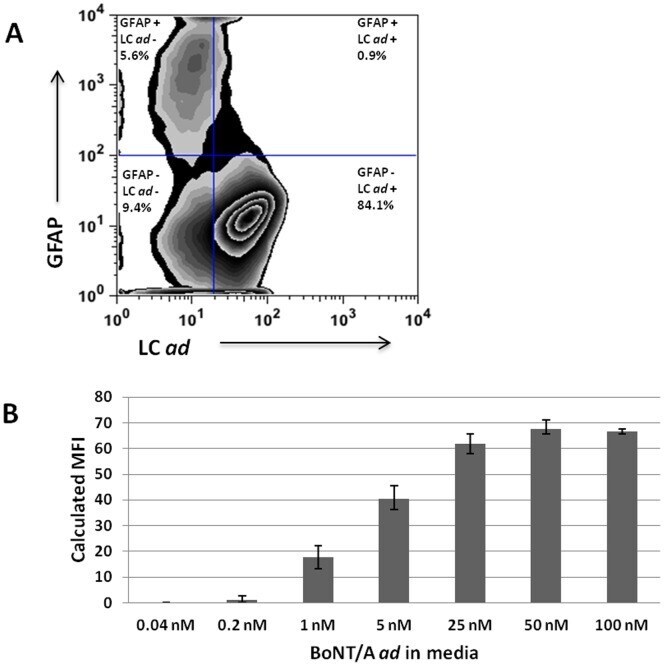
- Figure 2 Neuronal uptake of BoNT/A ad . E19 rat hippocampal neurons were cultured in maintenance medium for 10/A ad for 24 hours at 37degC. Cells were analyzed by flow cytometry. Panel A: Cells were exposed to 25 nM BoNT/A ad . Plot shows cells stained with F1-40 mAb to detect BoNT/A ad light chain (X-axis) and with anti-GFAP mAb to detect glia (Y-axis). Numbers in each quadrant represent the percentage of cells in that population. Panel B: Calculated median fluorescent intensity (MFI) from cell cultures exposed for 24 hr at 37degC to indicated concentrations of BoNT/A ad .
- Submitted by
- Invitrogen Antibodies (provider)
- Main image
- Experimental details
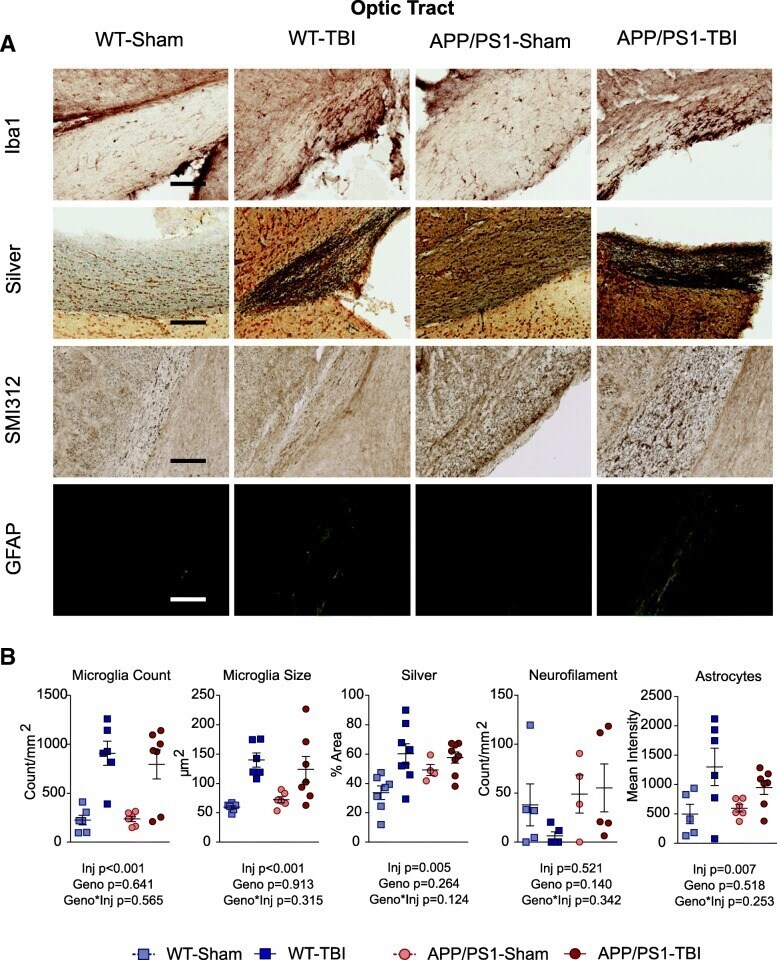
- Fig. 4 White matter pathology in the optic tract. a At 8 M post-TBI, histopathological analyses were performed on the optic tract, using Iba1 (microglia), NeuroSilver (axonal injury), SMI312 (neurofilament), and GFAP (astrocytes). Representative images for each stain are shown. Scale bar represents 200 mum. b Quantification of ( a ) was plotted by reporting the density and size of microglia, the stain area of NeuroSilver, the density of neurofilament-positive axonal bulbs, and GFAP immunofluorescence intensity of astrocytes. Data are plotted as mean +- SE with an overlaid scatterplot of individual animals
- Submitted by
- Invitrogen Antibodies (provider)
- Main image
- Experimental details
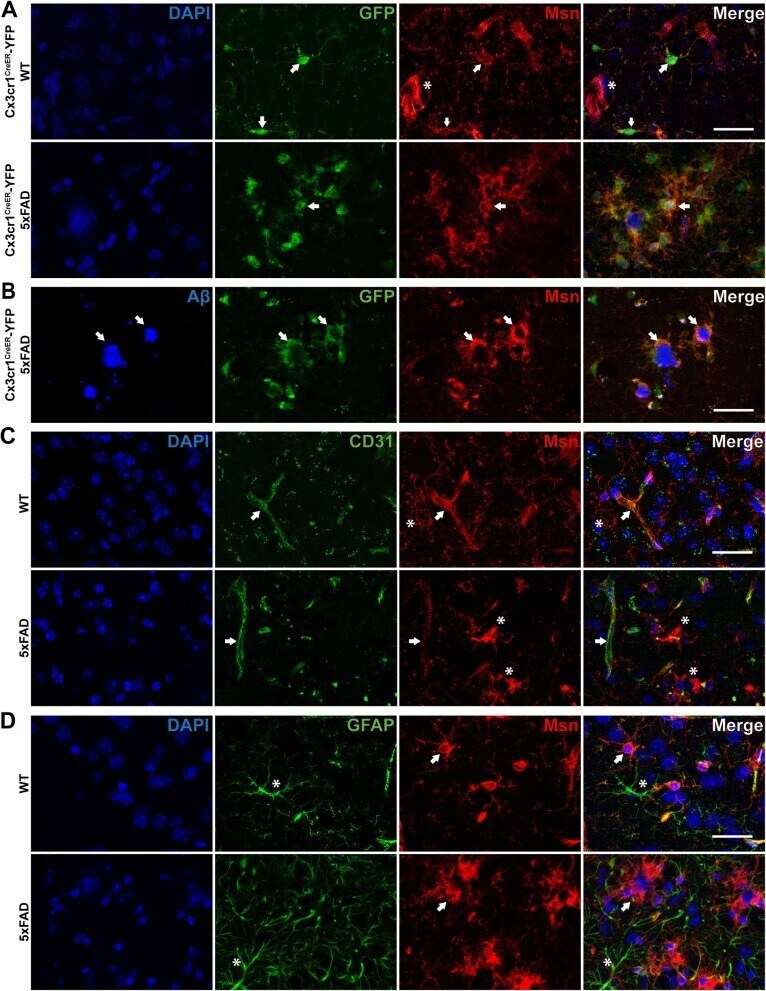
- Fig. 3 Moesin is expressed by microglia and endothelial cells in mouse brain. a Representative immunofluorescence images of Cx3cr1 CreER-YFP -WT ( N = 4) and Cx3cr1 CreER-YFP -5xFAD ( N = 6) mouse cortex stained for microglia (GFP) and Msn. Arrow indicates microglia immunopositive for GFP and Msn. Asterisk indicates cells immunopositive for Msn only. b Representative immunofluorescence images of Cx3cr1 CreER-YFP -5xFAD ( N = 6) mouse cortex stained for amyloid-beta (Abeta), microglia (GFP), and Msn. Arrow indicates Abeta plaque as well as microglia immunopositive for GFP and Msn. c Representative immunofluorescence images of WT ( N = 3) and 5xFAD ( N = 4) mouse cortex stained for endothelial cells (CD31) and Msn. Arrow indicates endothelial cells immunopositive for CD31 and Msn. Asterisk indicates cells immunopostive for Msn only. d Representative immunofluorescence images of WT ( N = 3) and 5xFAD ( N = 4) mouse cortex stained for astrocytes (GFAP) and Msn. Arrow indicates cells immunopositive for Msn only. Asterisk indicates astroctyes immunopostive for GFAP only. Scale bar = 30 mum
- Submitted by
- Invitrogen Antibodies (provider)
- Main image
- Experimental details
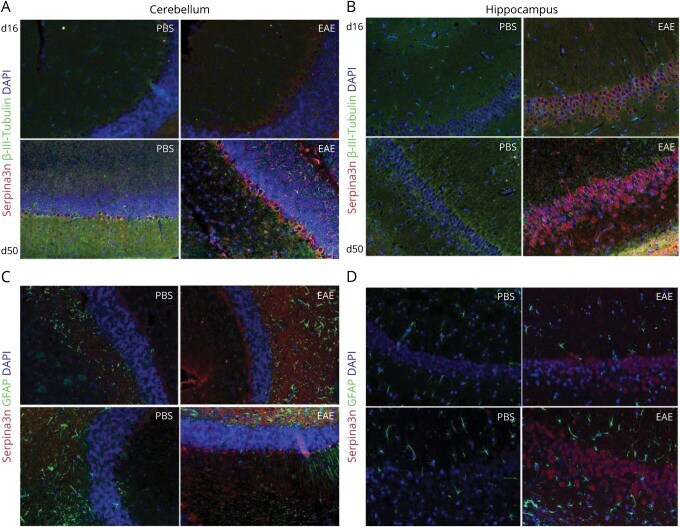
- Figure 3 Serpina3n Expression Is Restricted to Neurons During EAE Representative images of Serpina3n expression in neurons (A-B) and astrocytes (C-D) of PBS (controls) or EAE mice at d16 and d50 postimmunization. Tissues were stained for Serpina3n (red), beta-III-Tubulin (neuronal marker, green), and DAPI (blue) (A-B). Colocalization of Serpina3n in astrocytes was evaluated by staining for Serpina3n (red), GFAP (astrocyte marker, green), and DAPI (blue) (C-D). EAE = experimental autoimmune encephalomyelitis; GFAP = glial fibrillary acid protein.
- Submitted by
- Invitrogen Antibodies (provider)
- Main image
- Experimental details
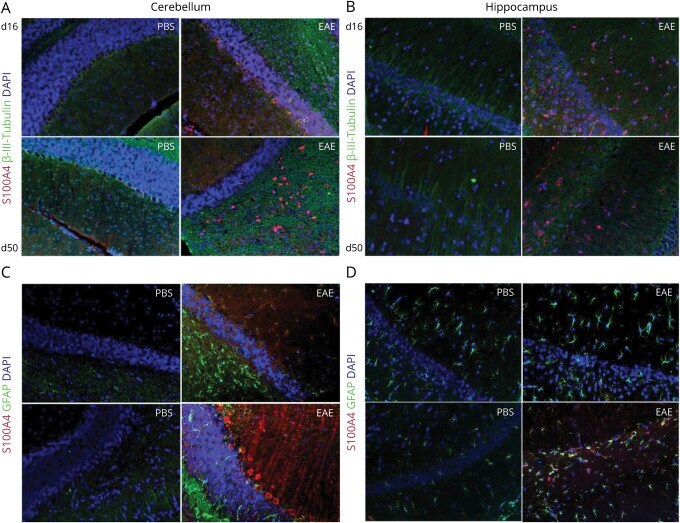
- Figure 4 S1004A Expression in CNS Tissue During EAE Representative images are shown for S100A4 expression in neurons (A-B) and astrocytes (C-D) of PBS (controls) or EAE mice at d16 and d50 postimmunization. Tissues were stained for S100A4 (red), beta-III-Tubulin (neuronal marker, green), and DAPI (blue) (A-B). Colocalization of S100A4 in astrocytes was evaluated by staining for S100A4 (red), GFAP (astrocyte marker, green), and DAPI (blue) (C-D). EAE = experimental autoimmune encephalomyelitis; GFAP = glial fibrillary acid protein.
- Submitted by
- Invitrogen Antibodies (provider)
- Main image
- Experimental details
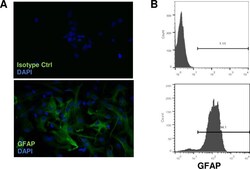
- Fig 1 Characterization of brain astrocytes. Astrocytes from B6 mice were isolated as described in Materials and Methods. Before use, astrocytes were stained with mAb against GFAP (green) and nuclei with DAPI (blue) followed by immunofluorescence microscopy (A, 20 magnifications) and flow cytometry (B).
- Submitted by
- Invitrogen Antibodies (provider)
- Main image
- Experimental details
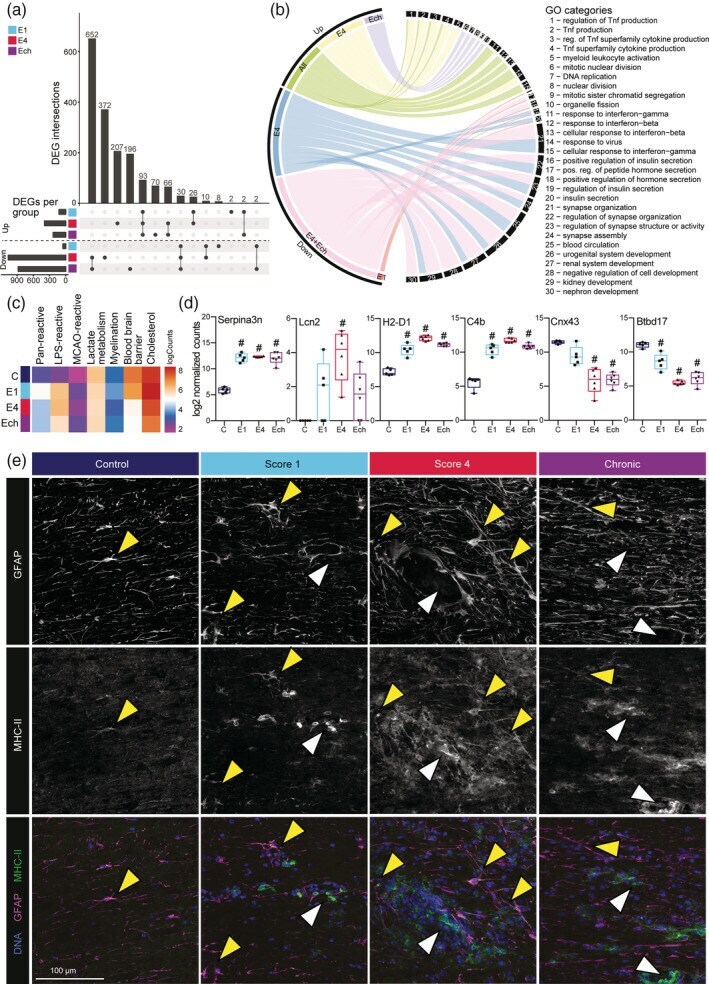
- FIGURE 4 Reactivity of spinal cord astrocytes is most pronounced during acute stage of EAE. (a) Upset diagram depicting the number and overlap of DEGs comparing each EAE stage to unimmunized control. Bars show number of enriched and depleted genes (bottom-left). Overlapping DEGs are illustrated by interconnected dots between groups (bottom-right) and the number of DEGs are depicted in in bar graph (top). (b) Circos plot depicting GO annotations of up- and down-regulated genes per EAE stage compared to astrocytes from unimmunized control mice. (c) Mean log expression of pan-reactive, LPS-reactive, and MCAO-reactive astrocyte markers, and genes involved in lactate metabolism, myelination, blood brain barrier, and cholesterol synthesis. For a list of genes see supplemental file Table S1 ( n = 4-6). (d) Normalized expression of selected reactive astrocyte markers Serpina3n , H2-D1 , and Lcn2 and of C4b , Cxn43 , and Btbd17 . Significantly different expression compared to unimmunized control is indicated (#). Boxes show 25th to 75th percentiles and median, and whiskers indicate min/max ( n = 4-6). (e) Representative images of MHC-II (green) and GFAP (magenta) co-expression in mouse spinal cord during EAE disease progression. Yellow arrows indicate co-expression; white arrows indicated MHC-II expression in GFAP neg structures ( n = 3)
- Submitted by
- Invitrogen Antibodies (provider)
- Main image
- Experimental details
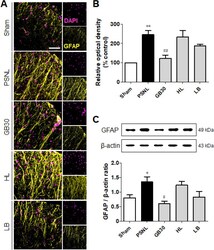
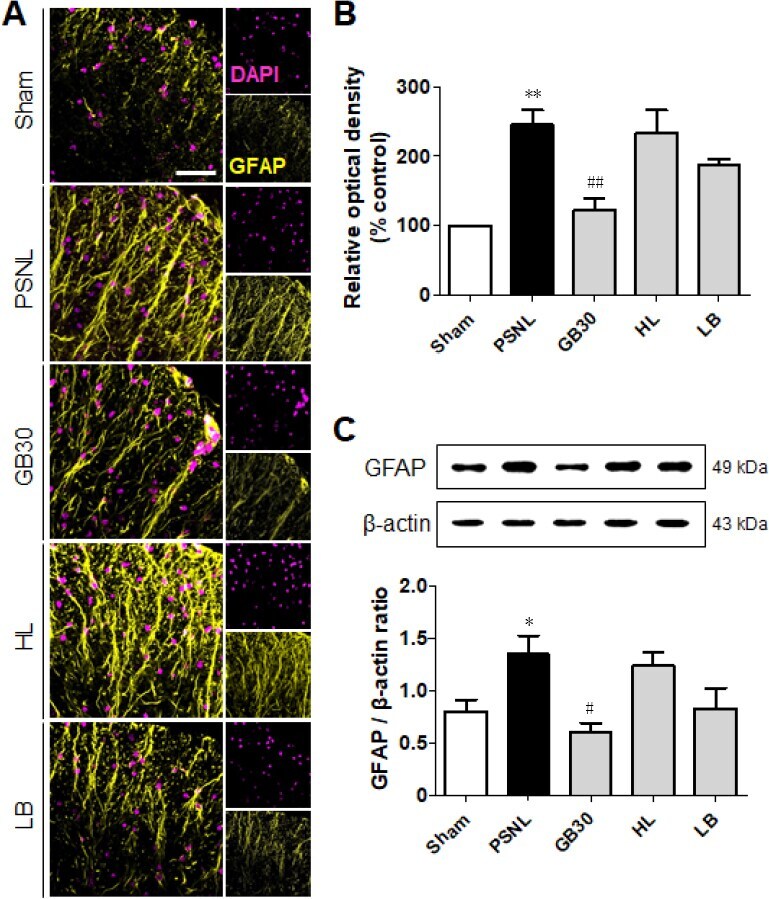
- Figure 5 Regulation of muscovite in activated astrocytes. (A, B) Immunofluorescence staining demonstrates that GFAP is regulated for muscovite injection. (C) Western blot assay confirming GFAP expression after muscovite injection. beta-Actin was used as the loading control. Scale bar: 100 um. Data are expressed as the mean +- SEM ( n = 3/group). * P < 0.05, ** P < 0.01, vs . sham group; # P < 0.05, ## P < 0.01, vs . PSNL group (one-way analysis of variance followed by the Student-Newman-Keuls test). DAPI: 4',6-Diamidino-2-phenylindole; GFAP: glial fibrillary acidic protein; HL: hindlimb (BL25); LB: lumbar (GB34); PSNL: partial sciatic nerve ligation. Figure 5
- Submitted by
- Invitrogen Antibodies (provider)
- Main image

- Experimental details
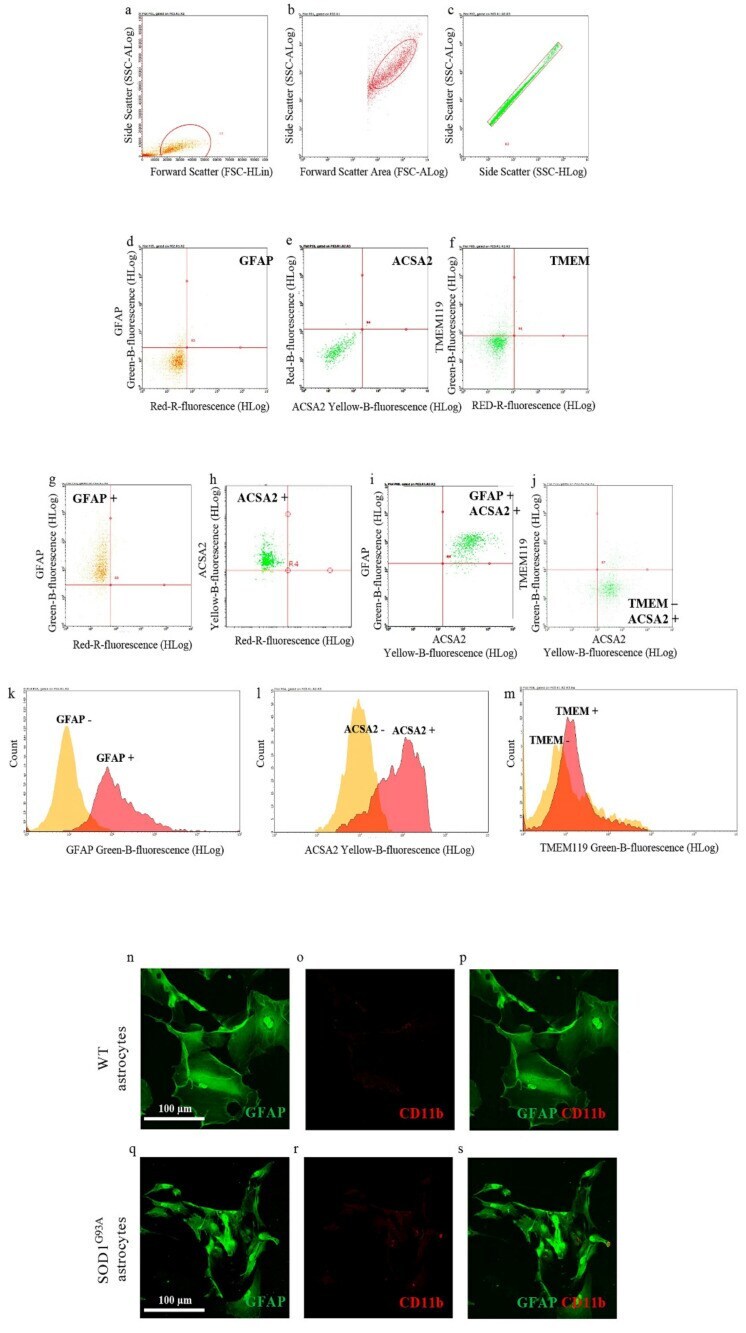
- Figure 1 Astrocyte cell culture purity. Spinal cord neonatal astrocyte primary cell cultures were prepared from WT and SOD1 G93A P2 pups, and their purity has been verified by flow cytometry ( a - m ) and immunofluorescence ( n - s ). ( a - c ) Representative flow cytometry dot plots of SOD1 G93A astrocytes showing the cell population gated by ( a ) side scatter (SSC-ALog) vs. forward scatter (FSC-HLin), ( b ) SSC-ALog vs. forward scatter (FSC-ALog) and ( c ) SSC-Alog vs. side scatter (SSC-HLog). ( d - f ) Representative dot plots of SOD1 G93A unstained SOD1 G93A astrocytes. ( g - j ) Representative dot plots of SOD1 G93A astrocytes after incubation with fluorophore-conjugated antibodies for ( g ) GFAP (astrocyte marker; green fluorescence), ( h , i ) ACSA2 (astrocyte marker; yellow fluorescence) and ( j ) TMEM119 (microglia marker; green fluorescence). ( k - m ) Representative flow cytometry histogram plots of SOD1 G93A astrocytes showing the expression of ( k ) GFAP, ( l ) ACSA2 and ( m ) TMEM, compared to the respective unstained controls. For quantization, n = 4 biological replicates per group were analyzed. ( m - r ) Representative confocal microscopy images of WT and SOD1 G93A spinal cord neonatal astrocyte primary cell cultures stained with selective antibodies for ( n , q ) GFAP (green fluorescence) and ( o , r ) CD11b (specific microglia marker; red fluorescence); ( p , s ) merge panels. For quantization, n = 3 biological replicates per group were analyzed, with each
- Submitted by
- Invitrogen Antibodies (provider)
- Main image
- Experimental details
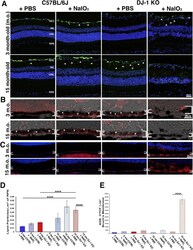
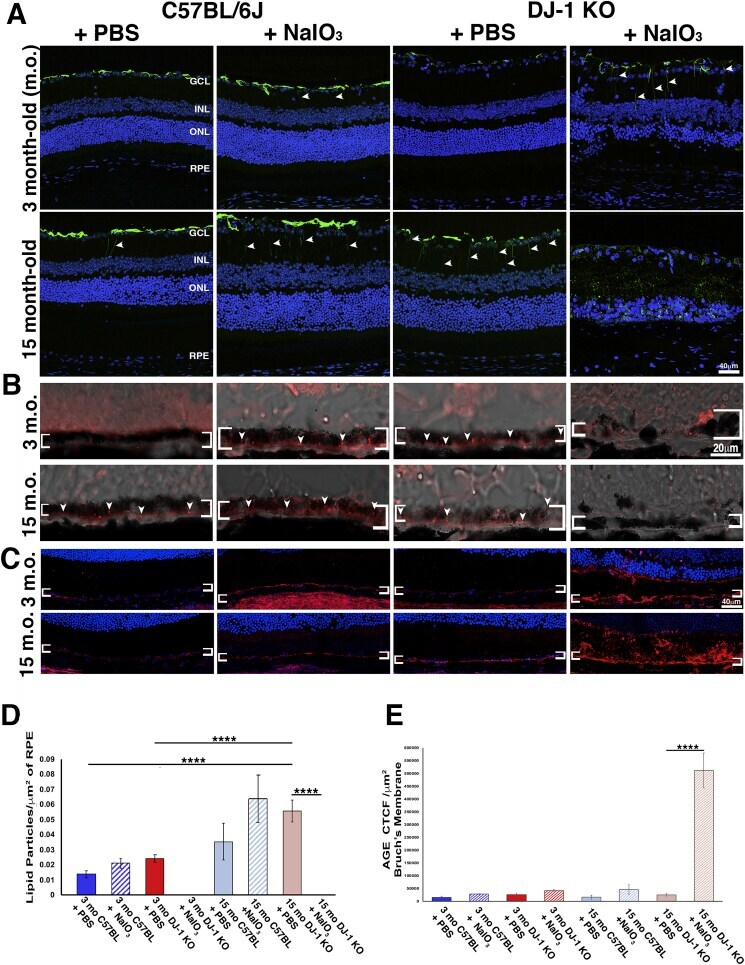
- Fig. 2 Expression of retinal markers during aging and under low-level oxidative stress (10 mg/kg NaIO 3 ) . Representative images of young and old retinas from WT and DJ-1 KO mice injected with PBS or NaIO 3 and stained for anti-glial fibrillary acidic protein (GFAP) ( A ), Nile Red dye for neutral lipids ( B ) and advanced glycation end products (AGEs) ( C ). Quantification of Nile Red stained neutral lipid droplets in RPE ( D ) and AGEs in Bruch's membrane ( E ) of young and old WT and DJ-1 KO mice. The apical and basal borders of the RPE is highlighted by brackets in B and C . Data are represented as mean +- SEM; n = 3-4 mice per group. Two-way Anova with Tukey's multiple comparisons test was performed; ****p
- Submitted by
- Invitrogen Antibodies (provider)
- Main image
- Experimental details
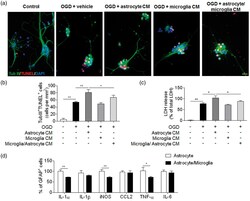
- Figure 6. Microglia restricted ischemia-induced astrocyte response and neural injury. Primary cortical neurons were subjected to 5 min OGD. Immediately after OGD, culture media was replaced with regular neurobasal medium mixed with equal volume of glia-conditioned medium for 24 h. Glia-conditioned medium was obtained from cultured microglia, astrocytes or mixed microglia and astrocytes (microglia&solastrocyte) at 24 h after 30 min OGD. (a) Representative images show staining of beta III Tubulin (green), DAPI (blue) and TUNEL (red) in primary cortical neurons exposed to OGD and glia-conditioned medium as indicated. Primary cortical neurons without exposure to OGD or glia-conditioned medium were used as controls. Scale bars: 20 um. (b) Quantification of TUNEL &plus cells after exposure to indicated treatment. CM: conditional medium. (c) Bar graphs show the level of released LDH from primary cortical neurons after exposure to indicated treatment. LDH release was expressed by normalizing the released LDH in the medium to the total LDH (released &plus intracellular). CM: conditional medium. (d) Primary astrocytes were cultured separately or together with microglia (microglia&solastrocyte). After 30 min OGD and subsequent 24 h recovery, intracellular staining of GFAP and indicated cytokines was performed and analyzed by flow cytometry. Bar graphs show the percentage of GFAP &plus cells expressing IL-1&agr, IL-1&bgr, iNOS, CCL2, TNF-&agr and IL-6. Error bars represent SD. ; &ast P
- Submitted by
- Invitrogen Antibodies (provider)
- Main image
- Experimental details
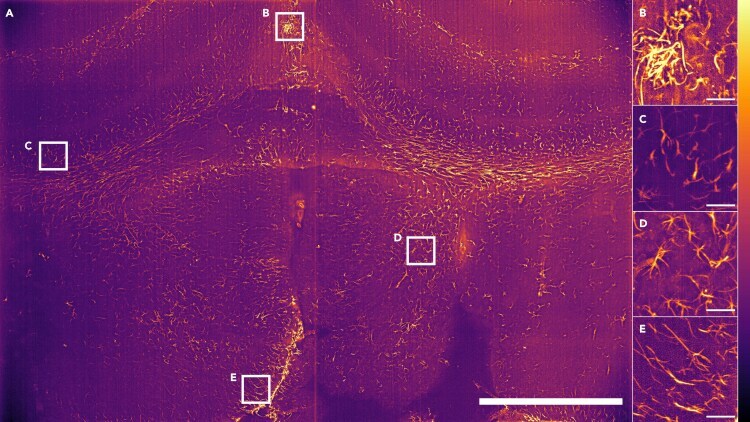
- Airy light-sheet Mesolens imaging of cleared coronal section of the mouse forebrain (A) A maximum intensity projection of 100 Airy light-sheet images of mouse brain stained with anti-GFAP mouse monoclonal antibody coupled with Alexa Fluor 488 and cleared using CUBIC-R, shown after deconvolution. A z-step size of 1.5 mum was used; therefore, spanning a total specimen thickness of 150 mum. Digitally zoomed regions (B) and (E) show both sub-cellular resolution of astrocytes and ependymal cells, and (C) and (D) show GFAP reactive astrocytes only. The regions shown in the image correspond to the commissure of the cingulate cortex (B), external capsule and caudoputamen (C and D), and 3rd ventricle (E). The look-up table for (A-E) is mpl-inferno, and the images were converted to 8-bit values (0-255). Scale bar: (A) 1000 mum, (B-E) 50 mum. The vertical line is not indicative of stitching: this is an artifact of the imaging sensor.
- Submitted by
- Invitrogen Antibodies (provider)
- Main image

- Experimental details
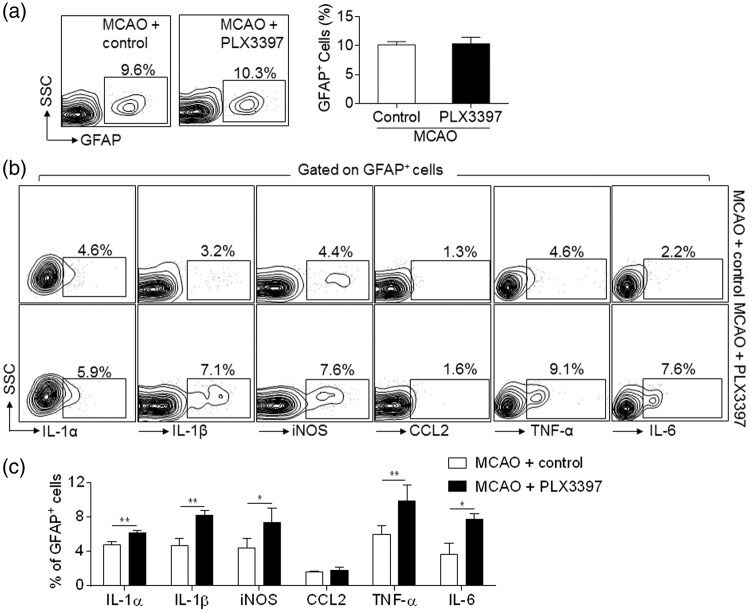
- Figure 5. Depletion of microglia enhanced astrocyte response after brain ischemia. C57BL/6 mice were fed with PLX3397 or control diet for 21 days prior to MCAO. At 24 h after ischemia and reperfusion, single cell suspensions were prepared from brain or spleen tissues of MCAO mice receiving PLX3397 or control diet. (a) Representative flow cytometry plots and bar graph show astrocytes (GFAP + ) in MCAO mice receiving PLX3397 or control diet, at 24 h after ischemia and reperfusion. (b)-(c) Representative plots (b) and bar graphs (c) of flow cytometry analysis show the expression of IL-1alpha, IL-1beta, iNOS, CCL2, TNF-alpha, IL-6 in astrocytes obtained at 24 h after MCAO from mice receiving PLX3397 or control diet. n = 15 mice per group. Error bars represent SD; * P < 0.05; ** P < 0.01.
- Submitted by
- Invitrogen Antibodies (provider)
- Main image

- Experimental details
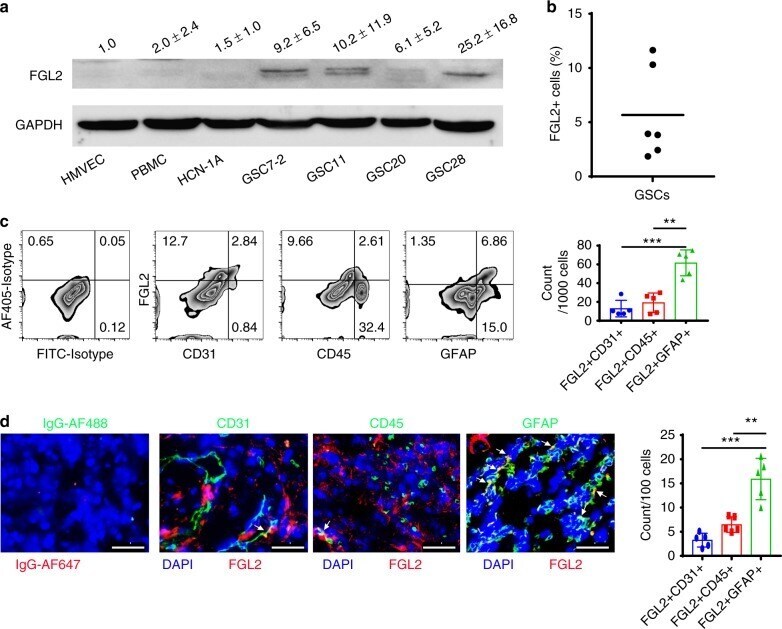
- Fig. 1 FGL2 is expressed by glioma cells. a FGL2 protein levels were detected by western blot in human peripheral blood monocytes (PBMCs) from healthy donors, normal endothelial cells (HMVECs), normal neurons (HCN-1A), and four glioma stem cell lines (GSC7-2, GSC11, GSC20, and GSC28). Western blots shown are representative, and quantities are summarized as ratio changes from three independent experiments. Glyceraldehyde 3-phosphate dehydrogenase (GAPDH) was used as a protein-loading control. b Percentage of FGL2 + cells in cultured human GSCs. c Representative flow cytometry plots of FGL2 expression on CD45 + , CD31 + , or GFAP + cells from tumors of patients with newly diagnosed GBM. Data ( n = 5) are presented as the mean +- S.D. and analyzed by one-way ANOVA. d Sections of clinical GBM samples were double stained for co-expression of FGL2 (red) and GFAP (green), or of FGL2 (red) and CD45 (green), or of FGL2 (red) and CD31 (green). Nuclei were counterstained with DAPI (blue). White arrows point to co-localization. Scale bars, 50 mum. Data are presented as the mean +- S.D., and representative images are shown ( n = 5). A one-way ANOVA was used to calculate the two-sided P values. Significant results were presented as ** P < 0.01, *** P < 0.001
- Submitted by
- Invitrogen Antibodies (provider)
- Main image
- Experimental details
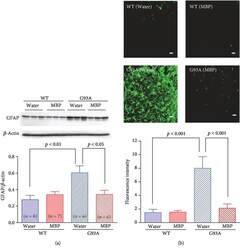
- Figure 5 MBP attenuates morphological changes in astrocytes in G93A mice. Mice were orally administered with injection water (vehicle) or MBP, starting at a late symptomatic stage (15 weeks old). Three weeks after the start of the treatment, the lumbar spinal cords were analysed by western blot and the histopathology was imaged. (a) Photographs depict a representative western blot of GFAP, an astrocyte marker, in the lumbar spinal cord of male G93A mice and WT mice. Equal amounts of cell lysates (10 mu g) were analysed, with beta -actin as an internal marker. The graph shows the relative density of each band on the blots estimated quantitatively using Scion imaging software. Quantitative data are expressed as the ratio of the band intensity of GFAP to the band intensity of beta -actin. Each value represents the mean +- SD. Statistical significance was determined by using one-way ANOVA followed by Tukey's post hoc test ( n = 6-7). (b) Photographs show representative confocal images of immunofluorescence staining for GFAP in the lumbar spinal cord sections from the indicated groups of mice at 18 weeks old. Representative data from four separate experiments are presented. Scale bar indicates 20 mu m. The graph shows semiquantitative analysis of changes in GFAP immunoreactivity in motor neurons. The fluorescence intensity of GFAP immunoreactivity was analysed quantitatively using Scion imaging software. Values represent the mean +- SEM. Statistical significance was determi
