Explore
 Validate
 Learn
Learn Western blot
 Immunocytochemistry
Antibody data
- Antibody Data
- Antigen structure
- References [1]
- Comments [0]
- Validations
- Immunocytochemistry [2]
- Immunohistochemistry [1]
- Flow cytometry [5]
- Other assay [2]
Submit
Validation data
Reference
Comment
Report error
- Product number
- MA1-80878 - Provider product page

- Provider
- Invitrogen Antibodies
- Product name
- Myeloperoxidase Monoclonal Antibody (2C7)
- Antibody type
- Monoclonal
- Antigen
- Other
- Description
- This antibody does not react with rat. Non-reducing conditions are recommended for Western blot applications. A suggested positive control for immunohistochemical applications is bone marrow. Mouse anti Human myeloperoxidase antibody, clone 2C7 recognizes human myeloperoxidase (MPO).
- Reactivity
- Human
- Host
- Mouse
- Isotype
- IgG
- Antibody clone number
- 2C7
- Vial size
- 200 μg
- Concentration
- 1 mg/mL
- Storage
- Store at 4°C short term. For long term storage, store at -20°C, avoiding freeze/thaw cycles.
Submitted references Moraxella catarrhalis evades neutrophil oxidative stress responses providing a safer niche for nontypeable Haemophilus influenzae.
Nicchi S, Giusti F, Carello S, Utrio Lanfaloni S, Tavarini S, Frigimelica E, Ferlenghi I, Rossi Paccani S, Merola M, Delany I, Scarlato V, Maione D, Brettoni C
iScience 2022 Mar 18;25(3):103931
iScience 2022 Mar 18;25(3):103931
No comments: Submit comment
Supportive validation
- Submitted by
- Invitrogen Antibodies (provider)
- Main image

- Experimental details
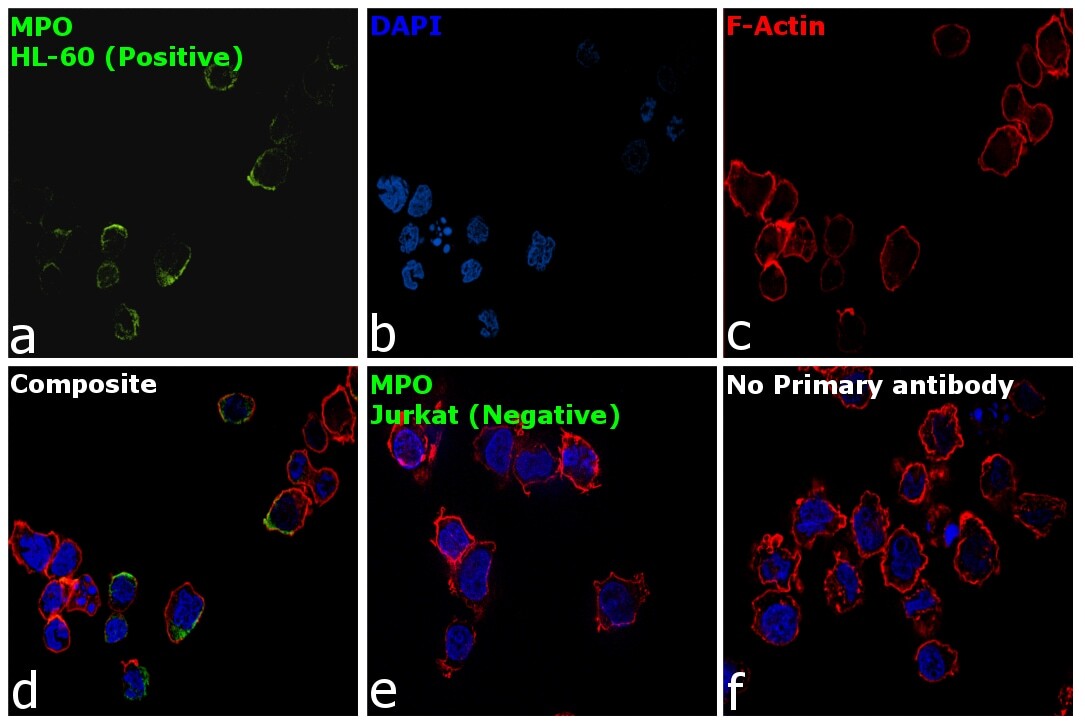
- Immunofluorescence analysis of MPO was performed using HL-60 and Jurkat cells. The cells were fixed with 4% paraformaldehyde for 10 minutes, permeabilized with 0.1% Triton™ X-100 for 15 minutes, and blocked with 2% BSA for 1 hour at room temperature. HL-60 and Jurkat cells were labeled with Myeloperoxidase Monoclonal Antibody (2C7) (Product # MA1-80878) at 1:100 dilution in 0.1% BSA, incubated at 4 degree Celsius overnight and then labeled with Goat anti-Mouse IgG (H+L), Superclonal™ Recombinant Secondary Antibody, Alexa Fluor 488 conjugate (Product # A28175) at a dilution of 1:2000 for 45 minutes at room temperature (Panel a: green). Nuclei (Panel b: blue) were stained with ProLong™ Diamond Antifade Mountant with DAPI (Product # P36962). F-actin (Panel c: red) was stained with Rhodamine Phalloidin (Product # R415). Panel d represents the merged image of HL-60 showing membranous localization. Panel e represents the merged image of Jurkat cells showing no expression for MPO protein. Panel f represents control cells with no primary antibody to assess background. The images were captured at 60X magnification.
- Submitted by
- Invitrogen Antibodies (provider)
- Main image
- Experimental details
- Immunofluorescence analysis of MPO was performed using HL-60 and Jurkat cells. The cells were fixed with 4% paraformaldehyde for 10 minutes, permeabilized with 0.1% Triton™ X-100 for 15 minutes, and blocked with 2% BSA for 1 hour at room temperature. HL-60 and Jurkat cells were labeled with Myeloperoxidase Monoclonal Antibody (2C7) (Product # MA1-80878) at 1:100 dilution in 0.1% BSA, incubated at 4 degree Celsius overnight and then labeled with Goat anti-Mouse IgG (H+L), Superclonal™ Recombinant Secondary Antibody, Alexa Fluor 488 conjugate (Product # A28175) at a dilution of 1:2000 for 45 minutes at room temperature (Panel a: green). Nuclei (Panel b: blue) were stained with ProLong™ Diamond Antifade Mountant with DAPI (Product # P36962). F-actin (Panel c: red) was stained with Rhodamine Phalloidin (Product # R415). Panel d represents the merged image of HL-60 showing membranous localization. Panel e represents the merged image of Jurkat cells showing no expression for MPO protein. Panel f represents control cells with no primary antibody to assess background. The images were captured at 60X magnification.

Supportive validation
- Submitted by
- Invitrogen Antibodies (provider)
- Main image

- Experimental details
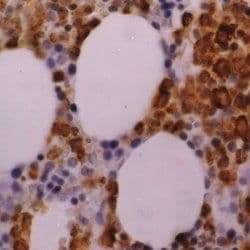
- Immunohistochemical staining of human bone marrow. Formalin fixed, paraffin processed tissue using a Myeloperoxidase monoclonal antibody (Product # MA1-80878)
Supportive validation
- Submitted by
- Invitrogen Antibodies (provider)
- Main image

- Experimental details
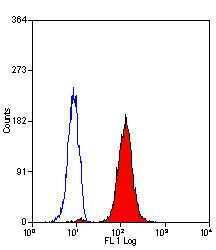
- Flow cytometric analysis of human peripheral blood granulocytes using a Myeloperoxidase monoclonal antibody (Product # MA1-80878)

- Submitted by
- Invitrogen Antibodies (provider)
- Main image

- Experimental details
- Flow cytometric analysis of human peripheral blood granulocytes using a Myeloperoxidase monoclonal antibody (Product # MA1-80878)
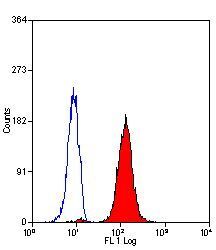
- Submitted by
- Invitrogen Antibodies (provider)
- Main image
- Experimental details
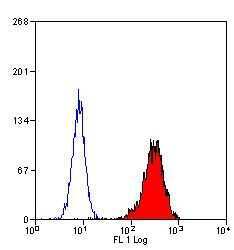
- Flow cytometric analysis of permeabilized human peripheral blood granulocytes using a Myeloperoxidase monoclonal antibody (Product # MA1-80878)

- Submitted by
- Invitrogen Antibodies (provider)
- Main image
- Experimental details
- Flow cytometric analysis of permeabilized human peripheral blood granulocytes using a Myeloperoxidase monoclonal antibody (Product # MA1-80878)
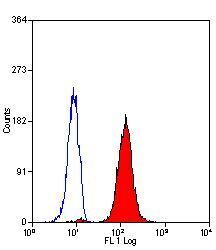
- Submitted by
- Invitrogen Antibodies (provider)
- Main image

- Experimental details
- Flow cytometric analysis of human peripheral blood granulocytes using a Myeloperoxidase monoclonal antibody (Product # MA1-80878)

Supportive validation
- Submitted by
- Invitrogen Antibodies (provider)
- Main image
- Experimental details
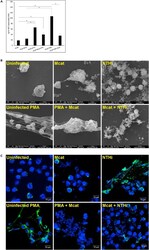
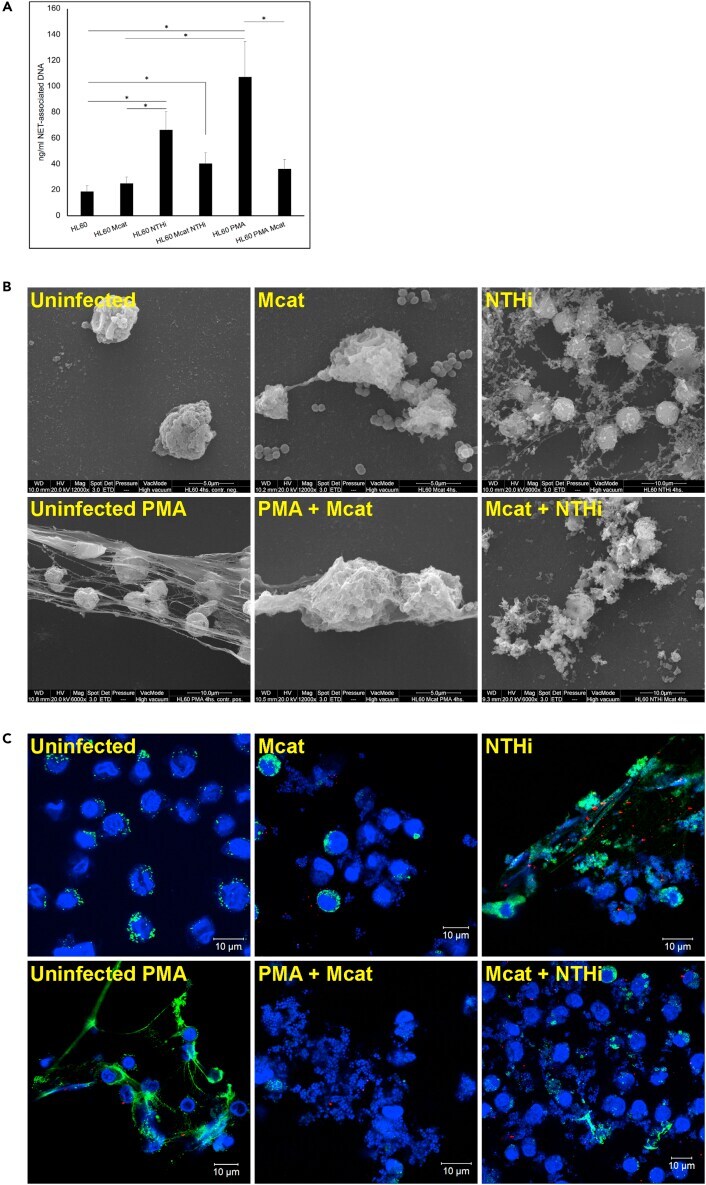
- Figure 4 NET generation is differently modulated by NTHi and M. catarrhalis dHL-60 cells were left untreated, or either infected singly with M. catarrhalis (MOI 50) or NTHi (MOI 50), or with a combination of the two bacteria (MOI 25 each). dHL-60 were also treated with a known inducer of NETs (PMA) and infected or not with M. catarrhalis (MOI 50). The reaction was allowed to proceed for 4h. (A) Samples were centrifuged, nuclease-treated and the amount of DNA in the supernatant was quantified using PicoGreen (Invitrogen) staining and the fluorescence was detected at 530 nm using a TECAN Infinite 200 plate reader. Lambda DNA at known concentrations was used as standard. Each sample was processed in triplicate to avoid any bias in the reading. From a standard curve obtained by using known concentration of lambda DNA, the ng/ml of NET-associated DNA was determined. The resulting graph is obtained from seven independent experiments. Bars represent means +-SE *p < 0.05. (B) Samples were fixed and analyzed by scanning electron microscopy. Scale bars, 5- or 10 mum. (C) dHL-60 cells were fixed with 4% paraformaldehyde and stained for DNA (DAPI, blue) or myeloperoxidase (MPO, green) The stained cells were analyzed by immunofluorescence microscopy. Scale bars, 10 mum.
- Submitted by
- Invitrogen Antibodies (provider)
- Main image
- Experimental details
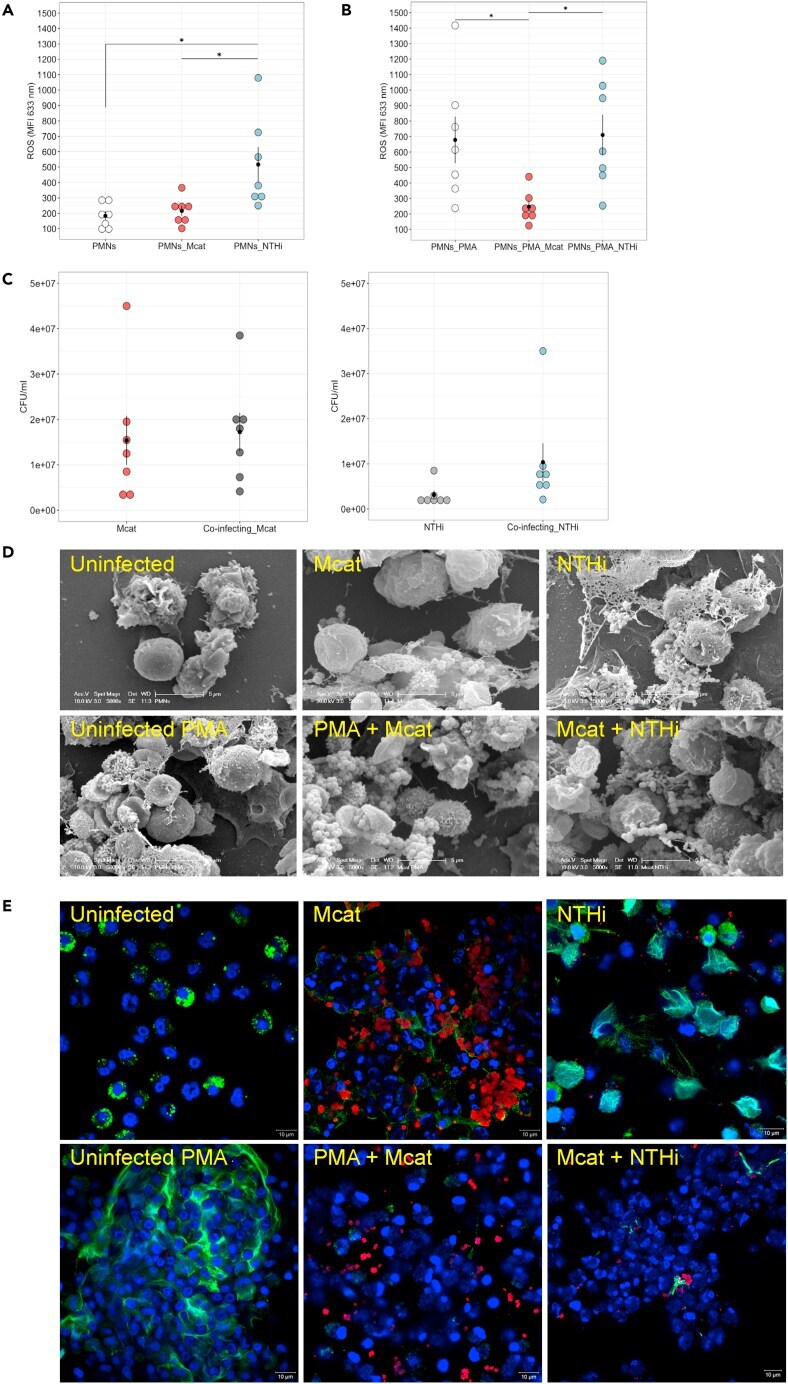
- Mcat and NTHi behaviors in primary cells strongly reflect those observed in dHL-60 cells (A and B) PMNs (A) unstimulated or (B) PMA-activated were left uninfected (white spots) or infected with the M. catarrhalis BBH18 (red spots) or NTHi 658 (blue spots) at MOI 50 and ROS production at 2 h post-infection was monitored using CellRox (intracellular ROS). MFI at 633 nm from seven donors was determined by flow cytometry. Bars represent means +- SE. MFI, Mean fluorescence intensity. The MFI obtain for each donor is represented by a spot. *p < 0.05. (C) PMNs were infected by only M. catarrhalis (red bars) or NTHi (blue bars) at MOI 50 (single infection), or with both the bacteria (co-infection with MOI 50 each bacterium, black and gray bars). By dilution plating onto BHI or HAE2 plates, the number of colonies obtained per condition was calculated to plot CFU/ml and to determine the microbial interplay (ratio co/single infection) of M. catarrhalis and NTHi, respectively. Bars represent means +- SE and the CFU/ml obtained for each donor is represented by a spot. (D and E) Visualization of NET structures. (D) Samples were fixed and analyzed by scanning electron microscopy. (E) Samples were fixed and stained for DNA (blue), myeloperoxidase (green) and adherent bacteria (red). Bacteria were detected by staining for UspA2 (rabbit polyclonal antibodies) and for whole bacteria for M. catarrhalis and NTHi, respectively. The stained cells were analyzed by immunofluorescence microscopy. Scal