Explore
 Validate
 Learn
Learn Western blot
 Immunocytochemistry
Antibody data
- Antibody Data
- Antigen structure
- References [1]
- Comments [0]
- Validations
- Immunocytochemistry [2]
- Immunohistochemistry [1]
- Other assay [2]
Submit
Validation data
Reference
Comment
Report error
- Product number
- PA5-31066 - Provider product page

- Provider
- Invitrogen Antibodies
- Product name
- eIF6 Polyclonal Antibody
- Antibody type
- Polyclonal
- Antigen
- Recombinant full-length protein
- Description
- Recommended positive controls: A549, HeLa, HepG2, HCT116. Predicted reactivity: Mouse (99%), Rat (99%), Zebrafish (92%), Drosophila (82%), Xenopus laevis (91%), Pig (98%), Chicken (94%), Sheep (99%), Bovine (97%). Store product as a concentrated solution. Centrifuge briefly prior to opening the vial.
- Reactivity
- Human
- Host
- Rabbit
- Isotype
- IgG
- Vial size
- 100 μL
- Concentration
- 1.2 mg/mL
- Storage
- Store at 4°C short term. For long term storage, store at -20°C, avoiding freeze/thaw cycles.
Submitted references Eukaryotic translation initiation factor 6 overexpression plays a major role in the translational control of gallbladder cancer.
Golob-Schwarzl N, Wodlej C, Kleinegger F, Gogg-Kamerer M, Birkl-Toeglhofer AM, Petzold J, Aigelsreiter A, Thalhammer M, Park YN, Haybaeck J
Journal of cancer research and clinical oncology 2019 Nov;145(11):2699-2711
Journal of cancer research and clinical oncology 2019 Nov;145(11):2699-2711
No comments: Submit comment
Supportive validation
- Submitted by
- Invitrogen Antibodies (provider)
- Main image

- Experimental details
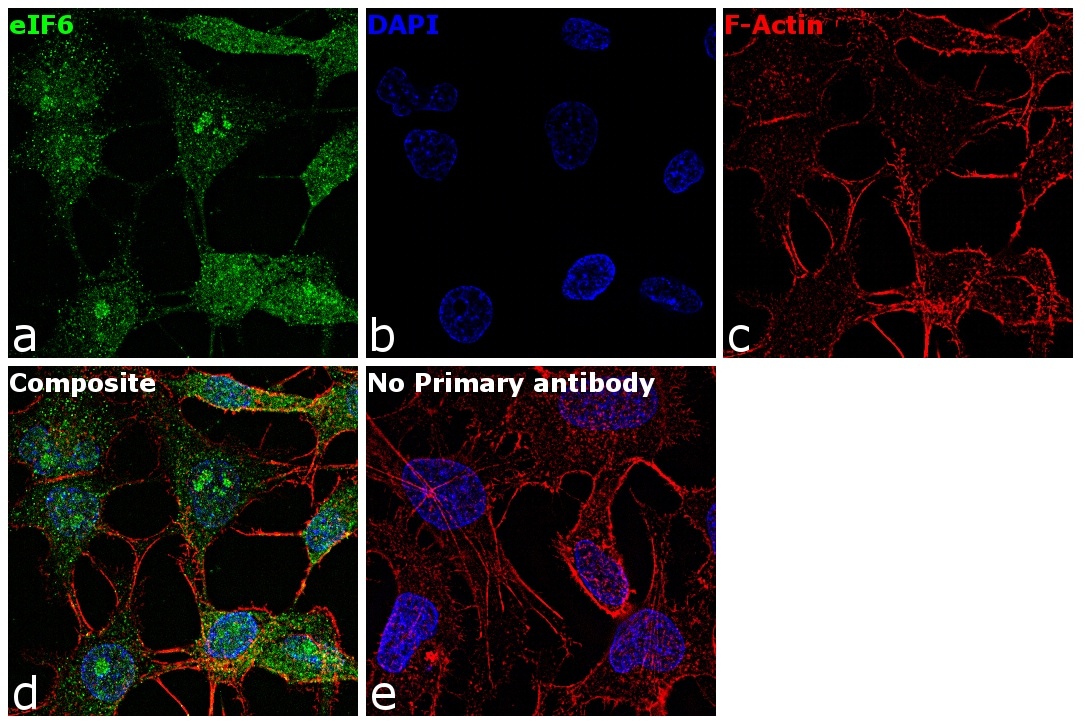
- Immunofluorescence analysis of eIF6 was performed using 70% confluent log phase Hep G2 cells. The cells were fixed with 4% paraformaldehyde for 10 minutes, permeabilized with 0.1% Triton™ X-100 for 15 minutes, and blocked with 1% BSA for 1 hour at room temperature. The cells were labeled with eIF6 Rabbit Polyclonal Antibody(Product # PA5-31066) at 5 µg/mL in 0.1% BSA, incubated at 4 degree Celsius overnight and then labeled with Goat anti-Rabbit IgG (H+L) Superclonal™ Secondary Antibody, Alexa Fluor® 488 conjugate (Product # A27034) at a dilution of 1:2000 for 45 minutes at room temperature (Panel a: green). Nuclei (Panel b: blue) were stained with ProLong™ Diamond Antifade Mountant with DAPI (Product # P36962). F-actin (Panel c: red) was stained with Rhodamine Phalloidin (Product # R415, 1:300). Panel d represents the merged image showing Nucleus, Nucleolus and cytoplasmic localization. Panel e represents control cells with no primary antibody to assess background. The images were captured at 60X magnification.
- Submitted by
- Invitrogen Antibodies (provider)
- Main image
- Experimental details
- Immunofluorescence analysis of eIF6 was performed using 70% confluent log phase Hep G2 cells. The cells were fixed with 4% paraformaldehyde for 10 minutes, permeabilized with 0.1% Triton™ X-100 for 15 minutes, and blocked with 1% BSA for 1 hour at room temperature. The cells were labeled with eIF6 Rabbit Polyclonal Antibody(Product # PA5-31066) at 5 µg/mL in 0.1% BSA, incubated at 4 degree Celsius overnight and then labeled with Goat anti-Rabbit IgG (Heavy Chain) Superclonal™ Secondary Antibody, Alexa Fluor® 488 conjugate (Product # A27034) at a dilution of 1:2000 for 45 minutes at room temperature (Panel a: green). Nuclei (Panel b: blue) were stained with ProLong™ Diamond Antifade Mountant with DAPI (Product # P36962). F-actin (Panel c: red) was stained with Rhodamine Phalloidin (Product # R415, 1:300). Panel d represents the merged image showing Nucleus, Nucleolus and cytoplasmic localization. Panel e represents control cells with no primary antibody to assess background. The images were captured at 60X magnification.

Supportive validation
- Submitted by
- Invitrogen Antibodies (provider)
- Main image
- Experimental details
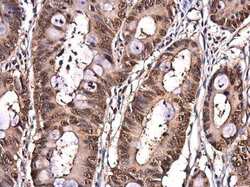
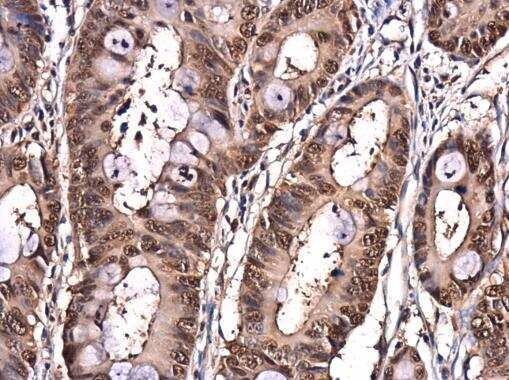
- Immunohistochemistry (Paraffin) analysis of eIF6 was performed in paraffin-embedded human colon tissue using eIF6 Polyclonal Antibody (Product # PA5-31066) at a dilution of 1:500.
Supportive validation
- Submitted by
- Invitrogen Antibodies (provider)
- Main image
- Experimental details
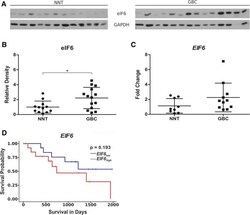
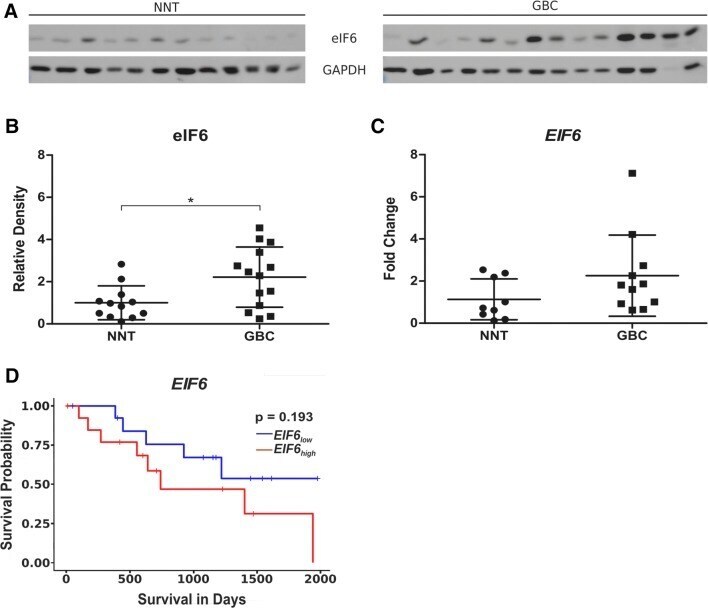
- Fig. 2 eIF6 expression is increased in GBC compared to NNT. a Representative immunoblots of eIF6 protein expression in fresh frozen GBC samples compared to NNT. b Densitometrical analysis of fresh frozen GBCs ( n = 14) proved the significantly increased expression of eIF6 in tumor tissue compared to NNT (* p < 0.05). The intensity of the bands was normalized to GAPDH, which served as loading control. Due to Gaussian distribution of data, Student's t test was performed for statistical analysis. c qRT-PCR of EIF6 mRNA was performed in fresh frozen 11 GBC and fresh frozen 9 NNT samples. Fold change values of EIF6 normalized to GAPDH as housekeeping gene are depicted. Bars represent mean +- SD. * p < 0.05, ** p < 0.01, *** p < 0.001. Statistical analysis: Mann-Whitney U test. d High expression is highlighted in red and low expression in blue. Kaplan-Meier curves represent the correlation between EIF6 gene expression and survival of BTC patients based on TCGA database an in silico analysis stratified by the median. Statistical analysis: log-rank test ( p = 0.193)
- Submitted by
- Invitrogen Antibodies (provider)
- Main image
- Experimental details
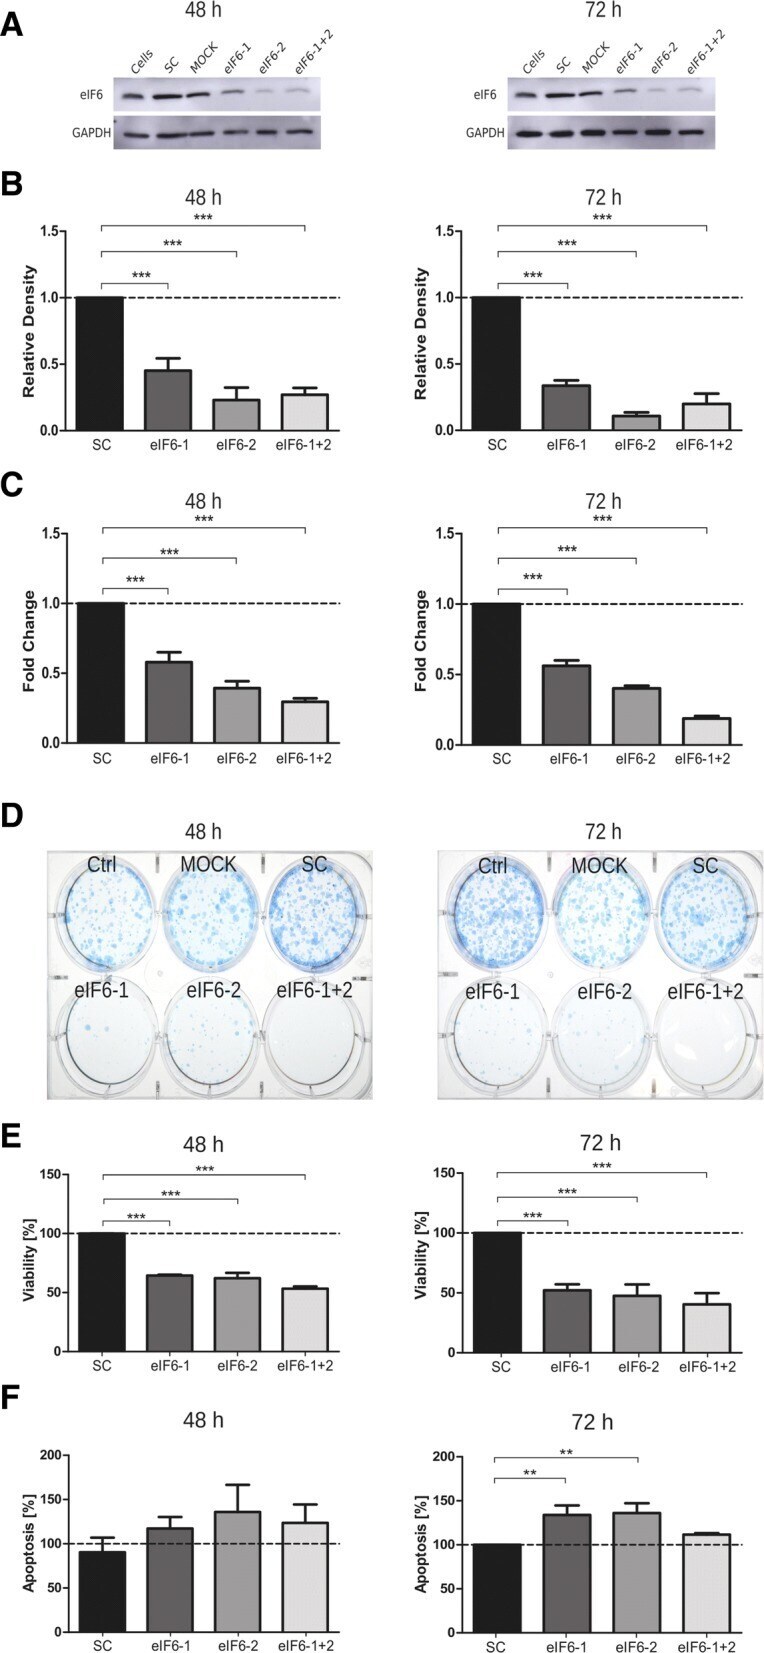
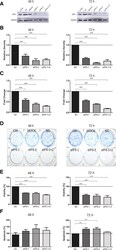
- Fig. 4 Knockdown of eIF6 in TFK-1 cell line. a Representative immunoblots of successful knockdown of eIF6 with siRNA after 48 and 72 h in TFK-1 cell line. b Densitometrical analysis of eIF6 signals normalized to GAPDH, which served as loading control. In TFK-1 cells, eIF6 protein levels are decreased after 48 and 72 h post-transfection, compared to scrambled siRNA-transfected condition. c mRNA levels of EIF6 in transfected TFK-1 cells analyzed by qRT-PCR and normalized to GAPDH mRNA levels. Three independent experiments were carried out. Bars represent mean +- SD. * p < 0.05, ** p < 0.01, *** p < 0.001. Statistical analysis: one-way ANOVA with Bonferroni post-test. d Representative colony formation assay of eIF6 knockdown induced 48 h and 72 h post-transfection in TFK-1 cell line. e Cell viability of TFK-1 cells transfected with eIF6 siRNA after 48 h and 72 h (*** p < 0.001). f Graphs show apoptosis rates after eIF6 knockdown compared to SC after 48 h and 72 h (** p < 0.001). Three independent experiments were carried out. Bars represent mean +- SD. * p < 0.05, ** p < 0.01, *** p < 0.001. Statistical analysis: two-way ANOVA with Bonferroni post-test