Explore
 Validate
 Learn
Learn Western blot
 Immunocytochemistry
Antibody data
- Antibody Data
- Antigen structure
- References [6]
- Comments [0]
- Validations
- Immunocytochemistry [1]
- Other assay [9]
Submit
Validation data
Reference
Comment
Report error
- Product number
- 14-9869-37 - Provider product page

- Provider
- Invitrogen Antibodies
- Product name
- Fibronectin Monoclonal Antibody (FN-3), eBioscience™
- Antibody type
- Monoclonal
- Antigen
- Other
- Description
- Description: The FN-3 monoclonal antibody recognizes human fibronectin, a component of the extracellular matrix. This high molecular weight protein (almost 400 kDa) exists as an extracellular and a soluble plasma form. Fibronectin functions in cell adhesion and migration via integrins present on the interacting cell. Fibronectin also associates with collagen, actin and fibrins. In malignancies, fibronectin protein levels can be altered. In lung carninomas, expression is decreased. The FN-3 antibody recognizes a determinant on human cellular but not plasma fibronectin; this recognition is not lost upon trypsin treatment. Furthermore, FN-3 antibody has been shown to crossreact to bovine fibronectin. Applications Reported: This FN-3 antibody has been reported for use in immunohistochemical staining of formalin-fixed paraffin embedded (FFPE) tissue sections and immunoblotting. Applications Tested: This FN-3 antibody has been tested by immunohistochemistry on FFPE human placenta (with IHC Antigen Retrieval Solution - Low pH (Product # 00-4955-58) and can be used at less than or equal to 10 µg/mL. Is is recommended that the antibody be carefully titrated for optimal performance in the assay of interest. Purity: Greater than 90%, as determined by SDS-PAGE. Aggregation: Less than 10%, as determined by HPLC. Filtration: 0.2 µm post-manufacturing filtered.
- Reactivity
- Human
- Host
- Mouse
- Isotype
- IgG
- Antibody clone number
- FN-3
- Vial size
- 2 mg
- Concentration
- 0.5 mg/mL
- Storage
- 4° C
Submitted references Increased Stiffness Downregulates Focal Adhesion Kinase Expression in Pancreatic Cancer Cells Cultured in 3D Self-Assembling Peptide Scaffolds.
3D Extracellular Matrix Regulates the Activity of T Cells and Cancer Associated Fibroblasts in Breast Cancer.
Application of a High-Content Screening Assay Utilizing Primary Human Lung Fibroblasts to Identify Antifibrotic Drugs for Rapid Repurposing in COVID-19 Patients.
Spontaneous Extracellular Matrix Accumulation in a Human in vitro Model of Renal Fibrosis Is Mediated by αV Integrins.
A high content, phenotypic 'scar-in-a-jar' assay for rapid quantification of collagen fibrillogenesis using disease-derived pulmonary fibroblasts.
PEGylated pUR4/FUD peptide inhibitor of fibronectin fibrillogenesis decreases fibrosis in murine Unilateral Ureteral Obstruction model of kidney disease.
Betriu N, Andreeva A, Alonso A, Semino CE
Biomedicines 2022 Jul 29;10(8)
Biomedicines 2022 Jul 29;10(8)
3D Extracellular Matrix Regulates the Activity of T Cells and Cancer Associated Fibroblasts in Breast Cancer.
Gao H, Tian Q, Zhu L, Feng J, Zhou Y, Yang J
Frontiers in oncology 2021;11:764204
Frontiers in oncology 2021;11:764204
Application of a High-Content Screening Assay Utilizing Primary Human Lung Fibroblasts to Identify Antifibrotic Drugs for Rapid Repurposing in COVID-19 Patients.
Marwick JA, Elliott RJR, Longden J, Makda A, Hirani N, Dhaliwal K, Dawson JC, Carragher NO
SLAS discovery : advancing life sciences R & D 2021 Oct;26(9):1091-1106
SLAS discovery : advancing life sciences R & D 2021 Oct;26(9):1091-1106
Spontaneous Extracellular Matrix Accumulation in a Human in vitro Model of Renal Fibrosis Is Mediated by αV Integrins.
Bon H, Hales P, Lumb S, Holdsworth G, Johnson T, Qureshi O, Twomey BM
Nephron 2019;142(4):328-350
Nephron 2019;142(4):328-350
A high content, phenotypic 'scar-in-a-jar' assay for rapid quantification of collagen fibrillogenesis using disease-derived pulmonary fibroblasts.
Good RB, Eley JD, Gower E, Butt G, Blanchard AD, Fisher AJ, Nanthakumar CB
BMC biomedical engineering 2019;1:14
BMC biomedical engineering 2019;1:14
PEGylated pUR4/FUD peptide inhibitor of fibronectin fibrillogenesis decreases fibrosis in murine Unilateral Ureteral Obstruction model of kidney disease.
Tomasini-Johansson BR, Zbyszynski PW, Toraason I, Peters DM, Kwon GS
PloS one 2018;13(10):e0205360
PloS one 2018;13(10):e0205360
No comments: Submit comment
Supportive validation
- Submitted by
- Invitrogen Antibodies (provider)
- Main image

- Experimental details
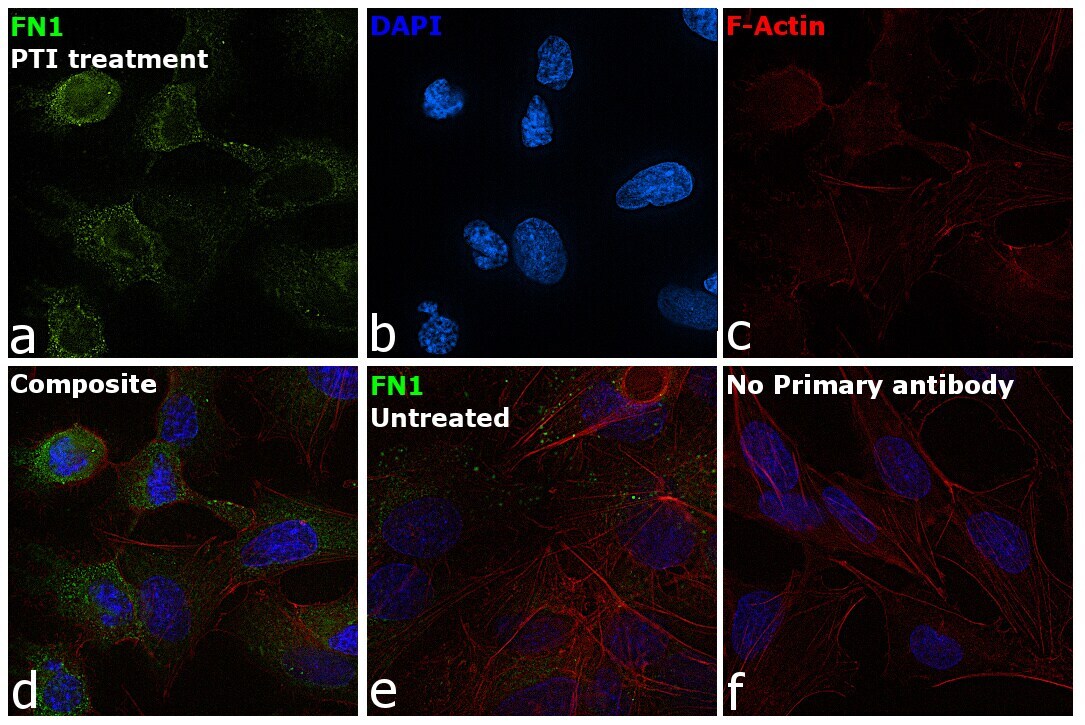
- Immunofluorescence analysis of Fibronectin was performed using 70% confluent log phase Hep G2 cells treated with 1X PTI for 4h. The cells were fixed with 4% paraformaldehyde for 10 minutes, permeabilized with 0.1% Triton™ X-100 for 15 minutes, and blocked with 2% BSA for 45 minutes at room temperature. The cells were labeled with Fibronectin Monoclonal Antibody (FN-3), eBioscience™ (Product # 14-9869-82) at 0.025 µg/mL in 0.1% BSA, incubated at 4 degree celsius overnight and then labeled with Donkey anti-Mouse IgG (H+L) Highly Cross-Adsorbed Secondary Antibody, Alexa Fluor Plus 488 (Product # A32766), (1:2000), for 45 minutes at room temperature (Panel a: Green). Nuclei (Panel b:Blue) were stained with ProLong™ Diamond Antifade Mountant with DAPI (Product # P36962). F-actin (Panel c: Red) was stained with Rhodamine Phalloidin (Product # R415, 1:300). Panel d represents the merged image showing Cytosolic localization. Panel e represents HepG2 cells with no PTI treatment. Panel f represents control cells with no primary antibody to assess background. The images were captured at 60X magnification.
Supportive validation
- Submitted by
- Invitrogen Antibodies (provider)
- Main image
- Experimental details
- NULL
- Submitted by
- Invitrogen Antibodies (provider)
- Main image
- Experimental details
- NULL
- Submitted by
- Invitrogen Antibodies (provider)
- Main image
- Experimental details
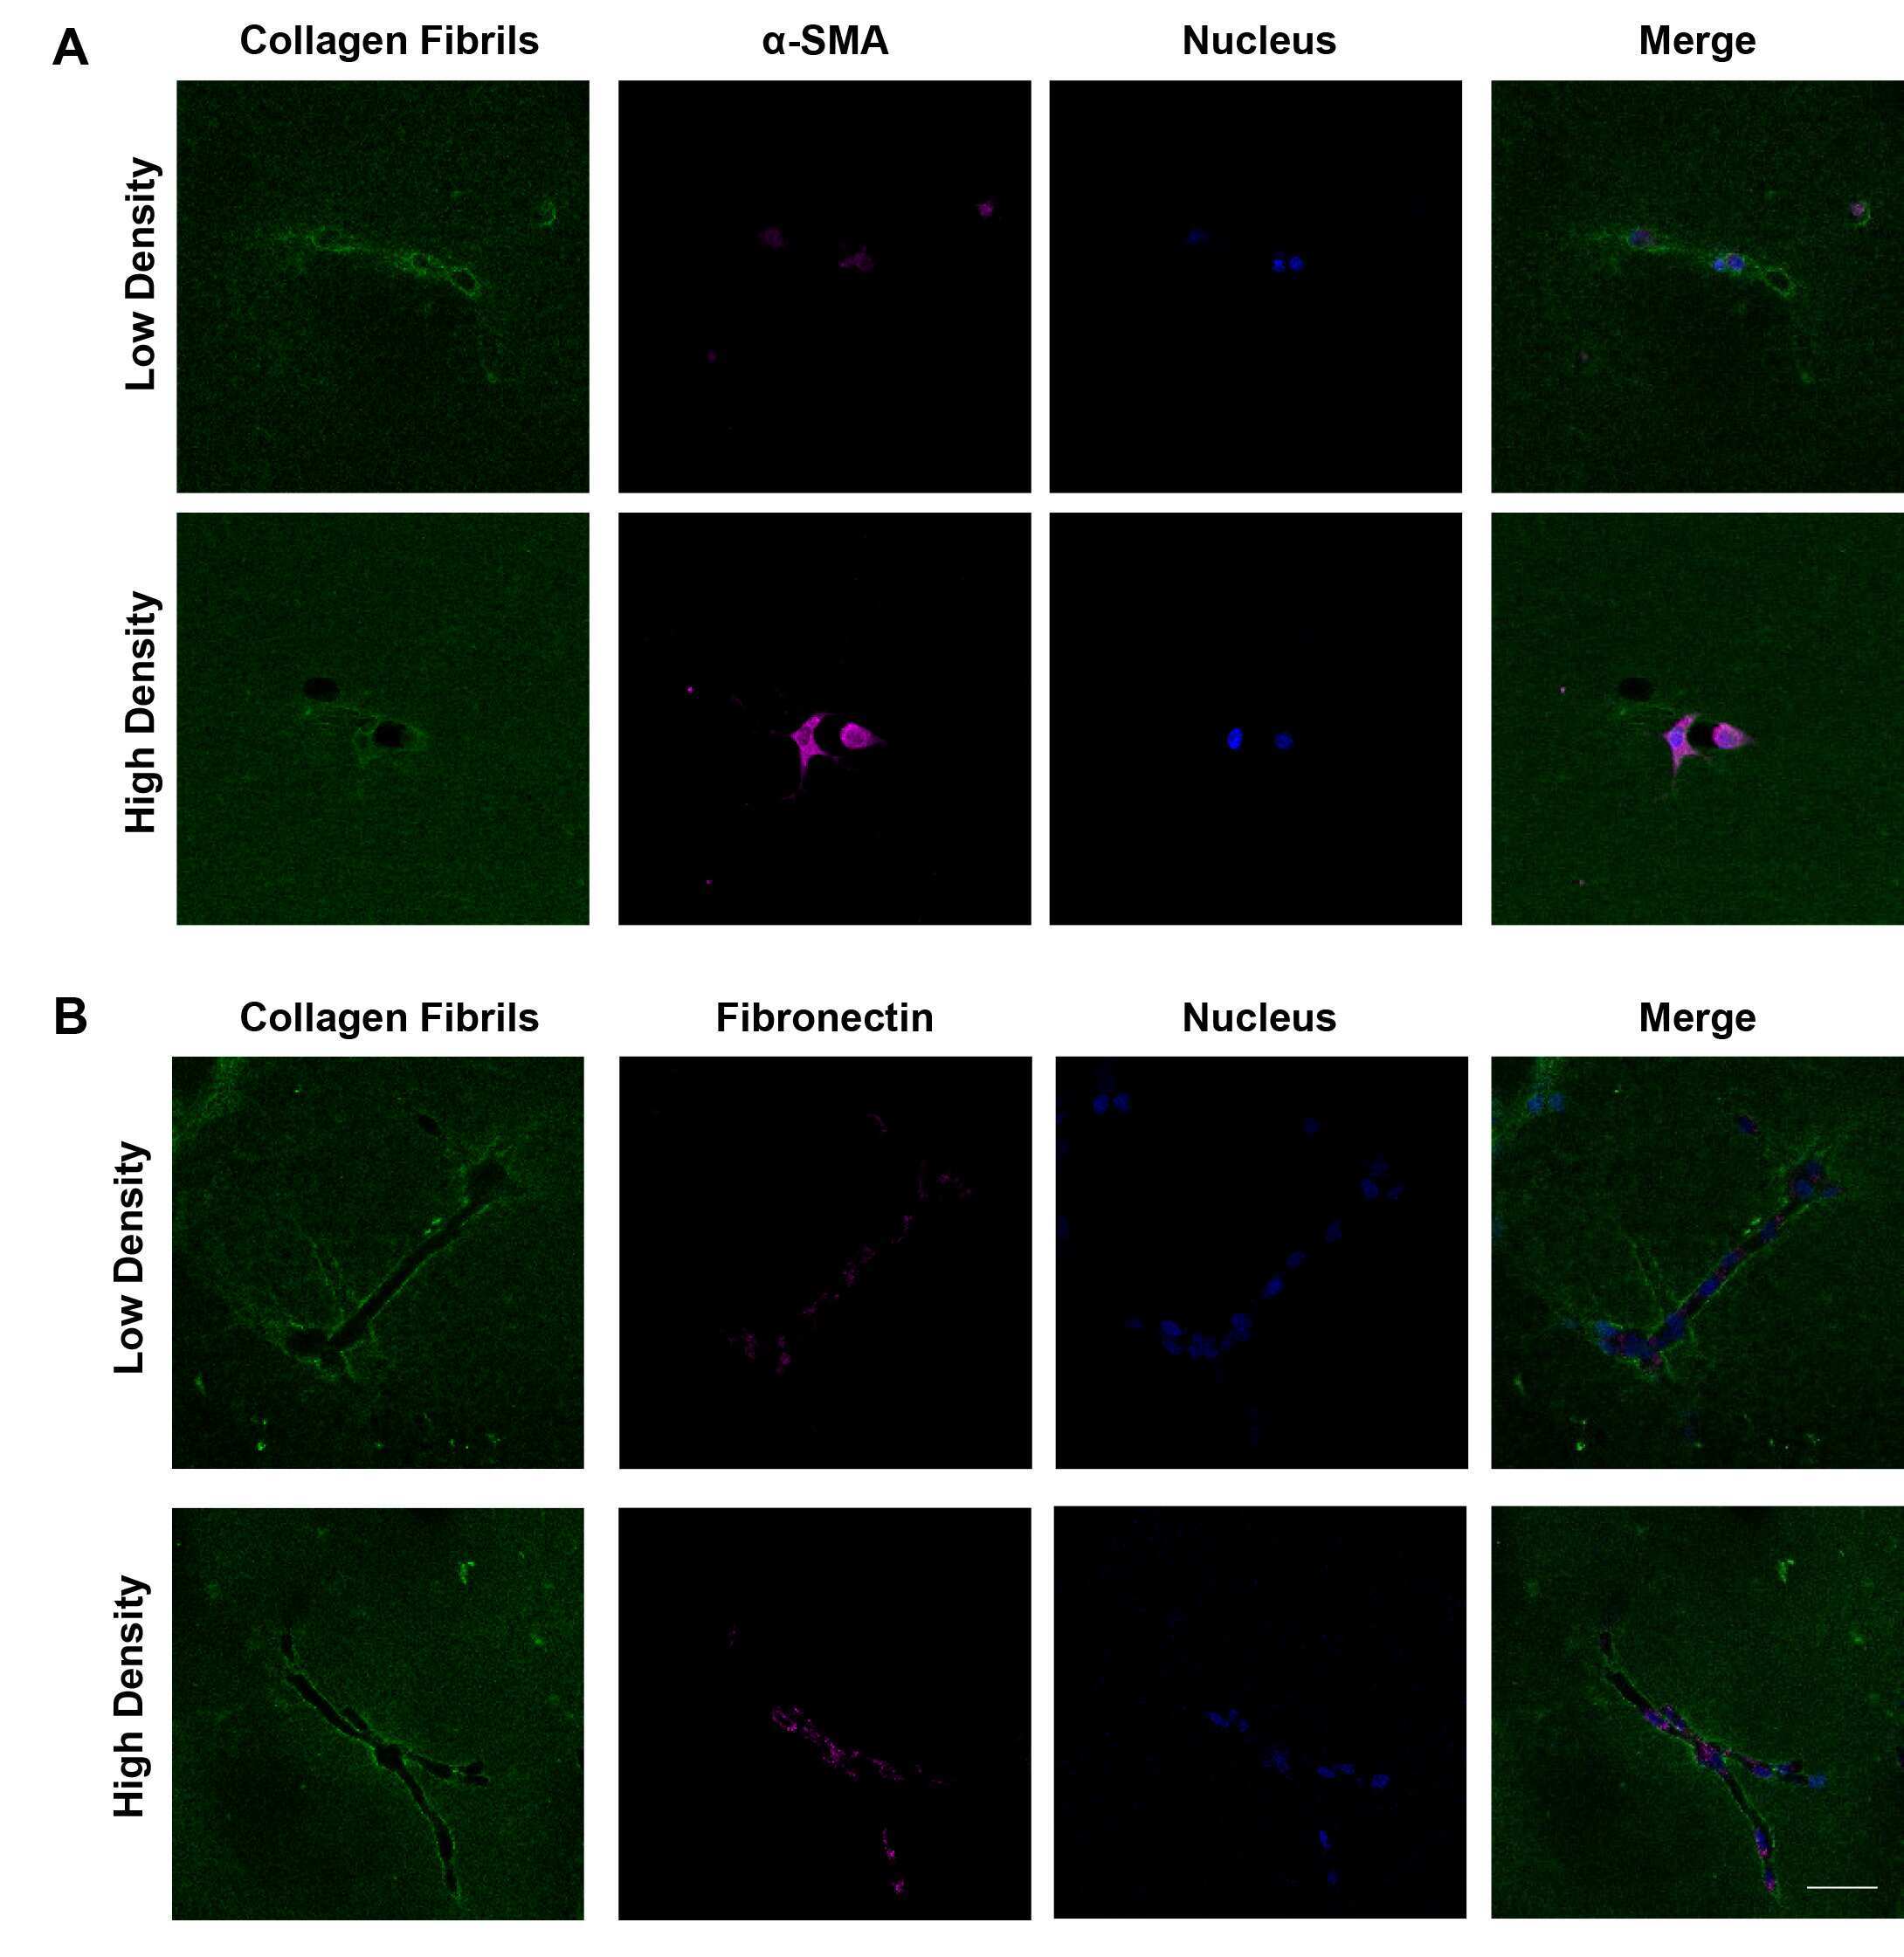
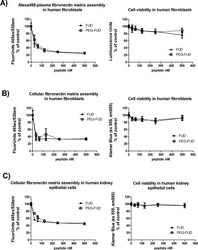
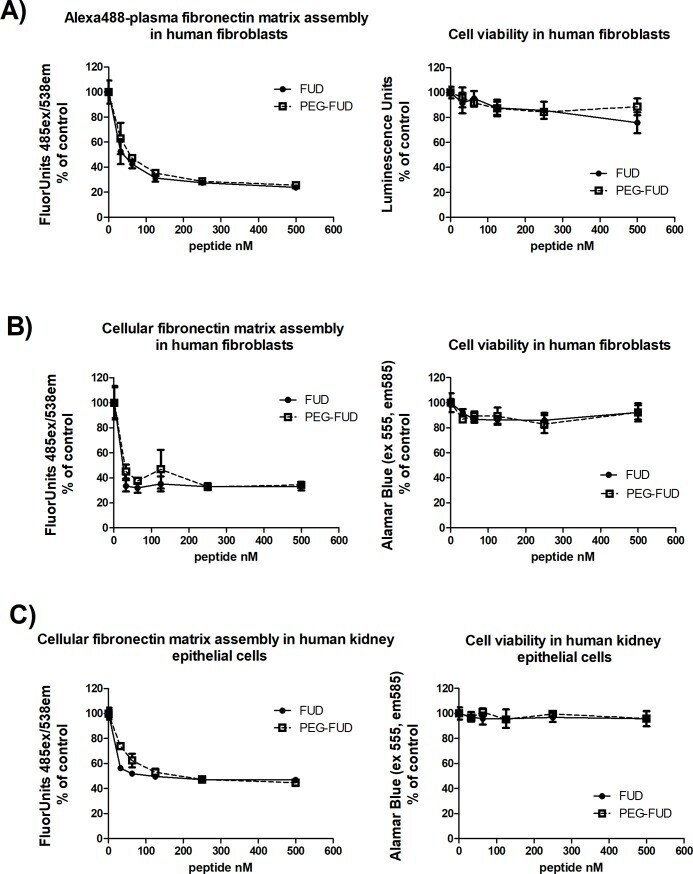
- Fig 1 PEGylated FUD retains the ability of FUD to inhibit plasma and cellular fibronectin fibrillogenesis by human fibroblasts and proximal tubular epithelial cells in vitro. Microtiter assays measuring fluorescence associated with incorporation of fibronectin into ECM (left panels) and corresponding cell viability (right panels) following doses of FUD and PEG-FUD up to 500 nM. A) Human fibroblast incorporation of A488-plasma fibronectin; B) human fibroblast and C) human proximal tubular epithelial cell incorporation of cellular fibronectin recognized with A488-anti-EDA mAb. Data were collected in triplicate per dose and is depicted as mean +/- SD.
- Submitted by
- Invitrogen Antibodies (provider)
- Main image
- Experimental details
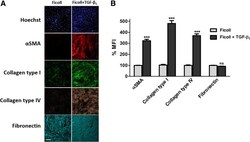
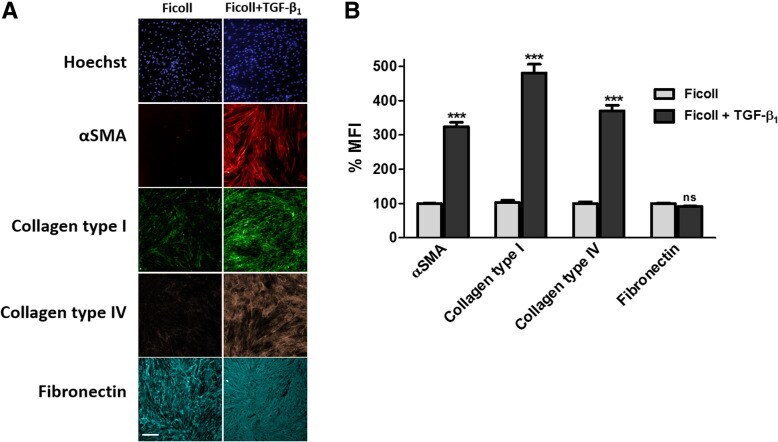
- Fig. 5 Markers of myofibroblast activation and extracellular matrix deposition. a Immunocytochemical analysis of fibroblast activation (alpha-SMA) and ECM deposition (collagen type I, collagen type IV and fibronectin) in response to TGF-beta 1 stimulation [1 ng/ml] for 72 h. Images are representative of n = 3 independent experiments at 10x magnification. Scale bars represent 200 mum. b mean fluorescent intensity of markers in (A) expressed as percent mean fluorescent intensity (MFI) normalised to ficoll treated-vehicle control. Histogram represents mean +- SEM. ***P
- Submitted by
- Invitrogen Antibodies (provider)
- Main image
- Experimental details
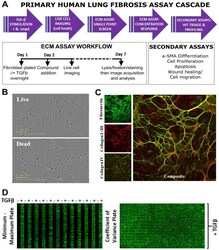
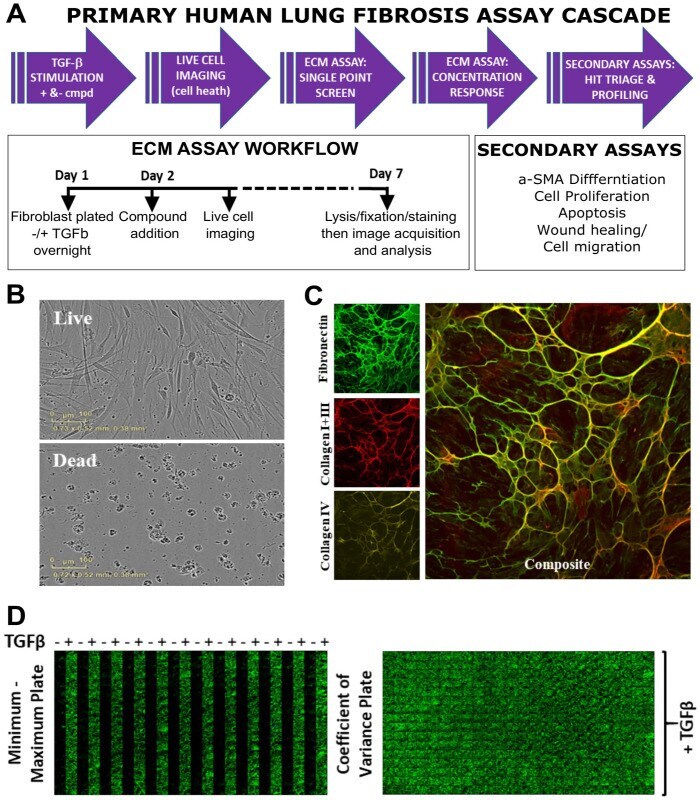
- Figure 1. ECM and triage assay workflow. ( A ) Workflow for screening compounds through the ECM and triage assays. ( B ) Representative images from live cell imaging showing viable cells (top) and cell death (bottom) induced by compound cytotoxicity. ( C ) Representative high-content images of fibronectin, collagen I+III, and collagen IV staining with composite image. ( D ) Representative full-plate montage images showing fibronectin staining with or without TGFbeta (5 ng/mL) to assess the assay window between minimum and maximum ECM deposition (left) and TGFbeta (5 ng/mL)-induced fibronectin staining across a full 384-well plate for coefficient of variance assessment (right).
- Submitted by
- Invitrogen Antibodies (provider)
- Main image

- Experimental details
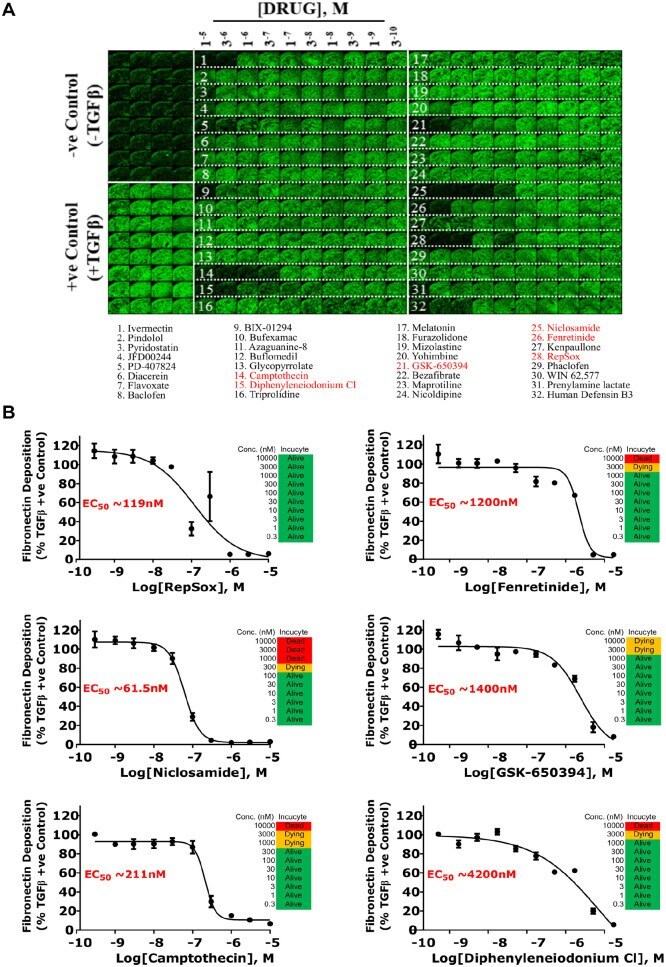
- Figure 3. Selected hit compound 10-point concentration response in ECM assay. ( A ) Full-plate montage of fibronectin staining showing 10-point concentration response of 32 compound hits selected from the primary screen. Compound names listed, with the most active compounds highlighted in red. ( B ) Concentration responses of fibronectin deposition and cytotoxicity for the six compounds that reduced ECM deposition in a concentrated-related manner (see Suppl. Figs. S1-S3 for collagen I+III and IV data). Conc., concentration.
- Submitted by
- Invitrogen Antibodies (provider)
- Main image
- Experimental details
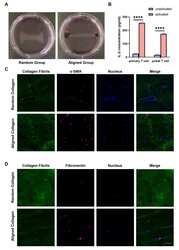
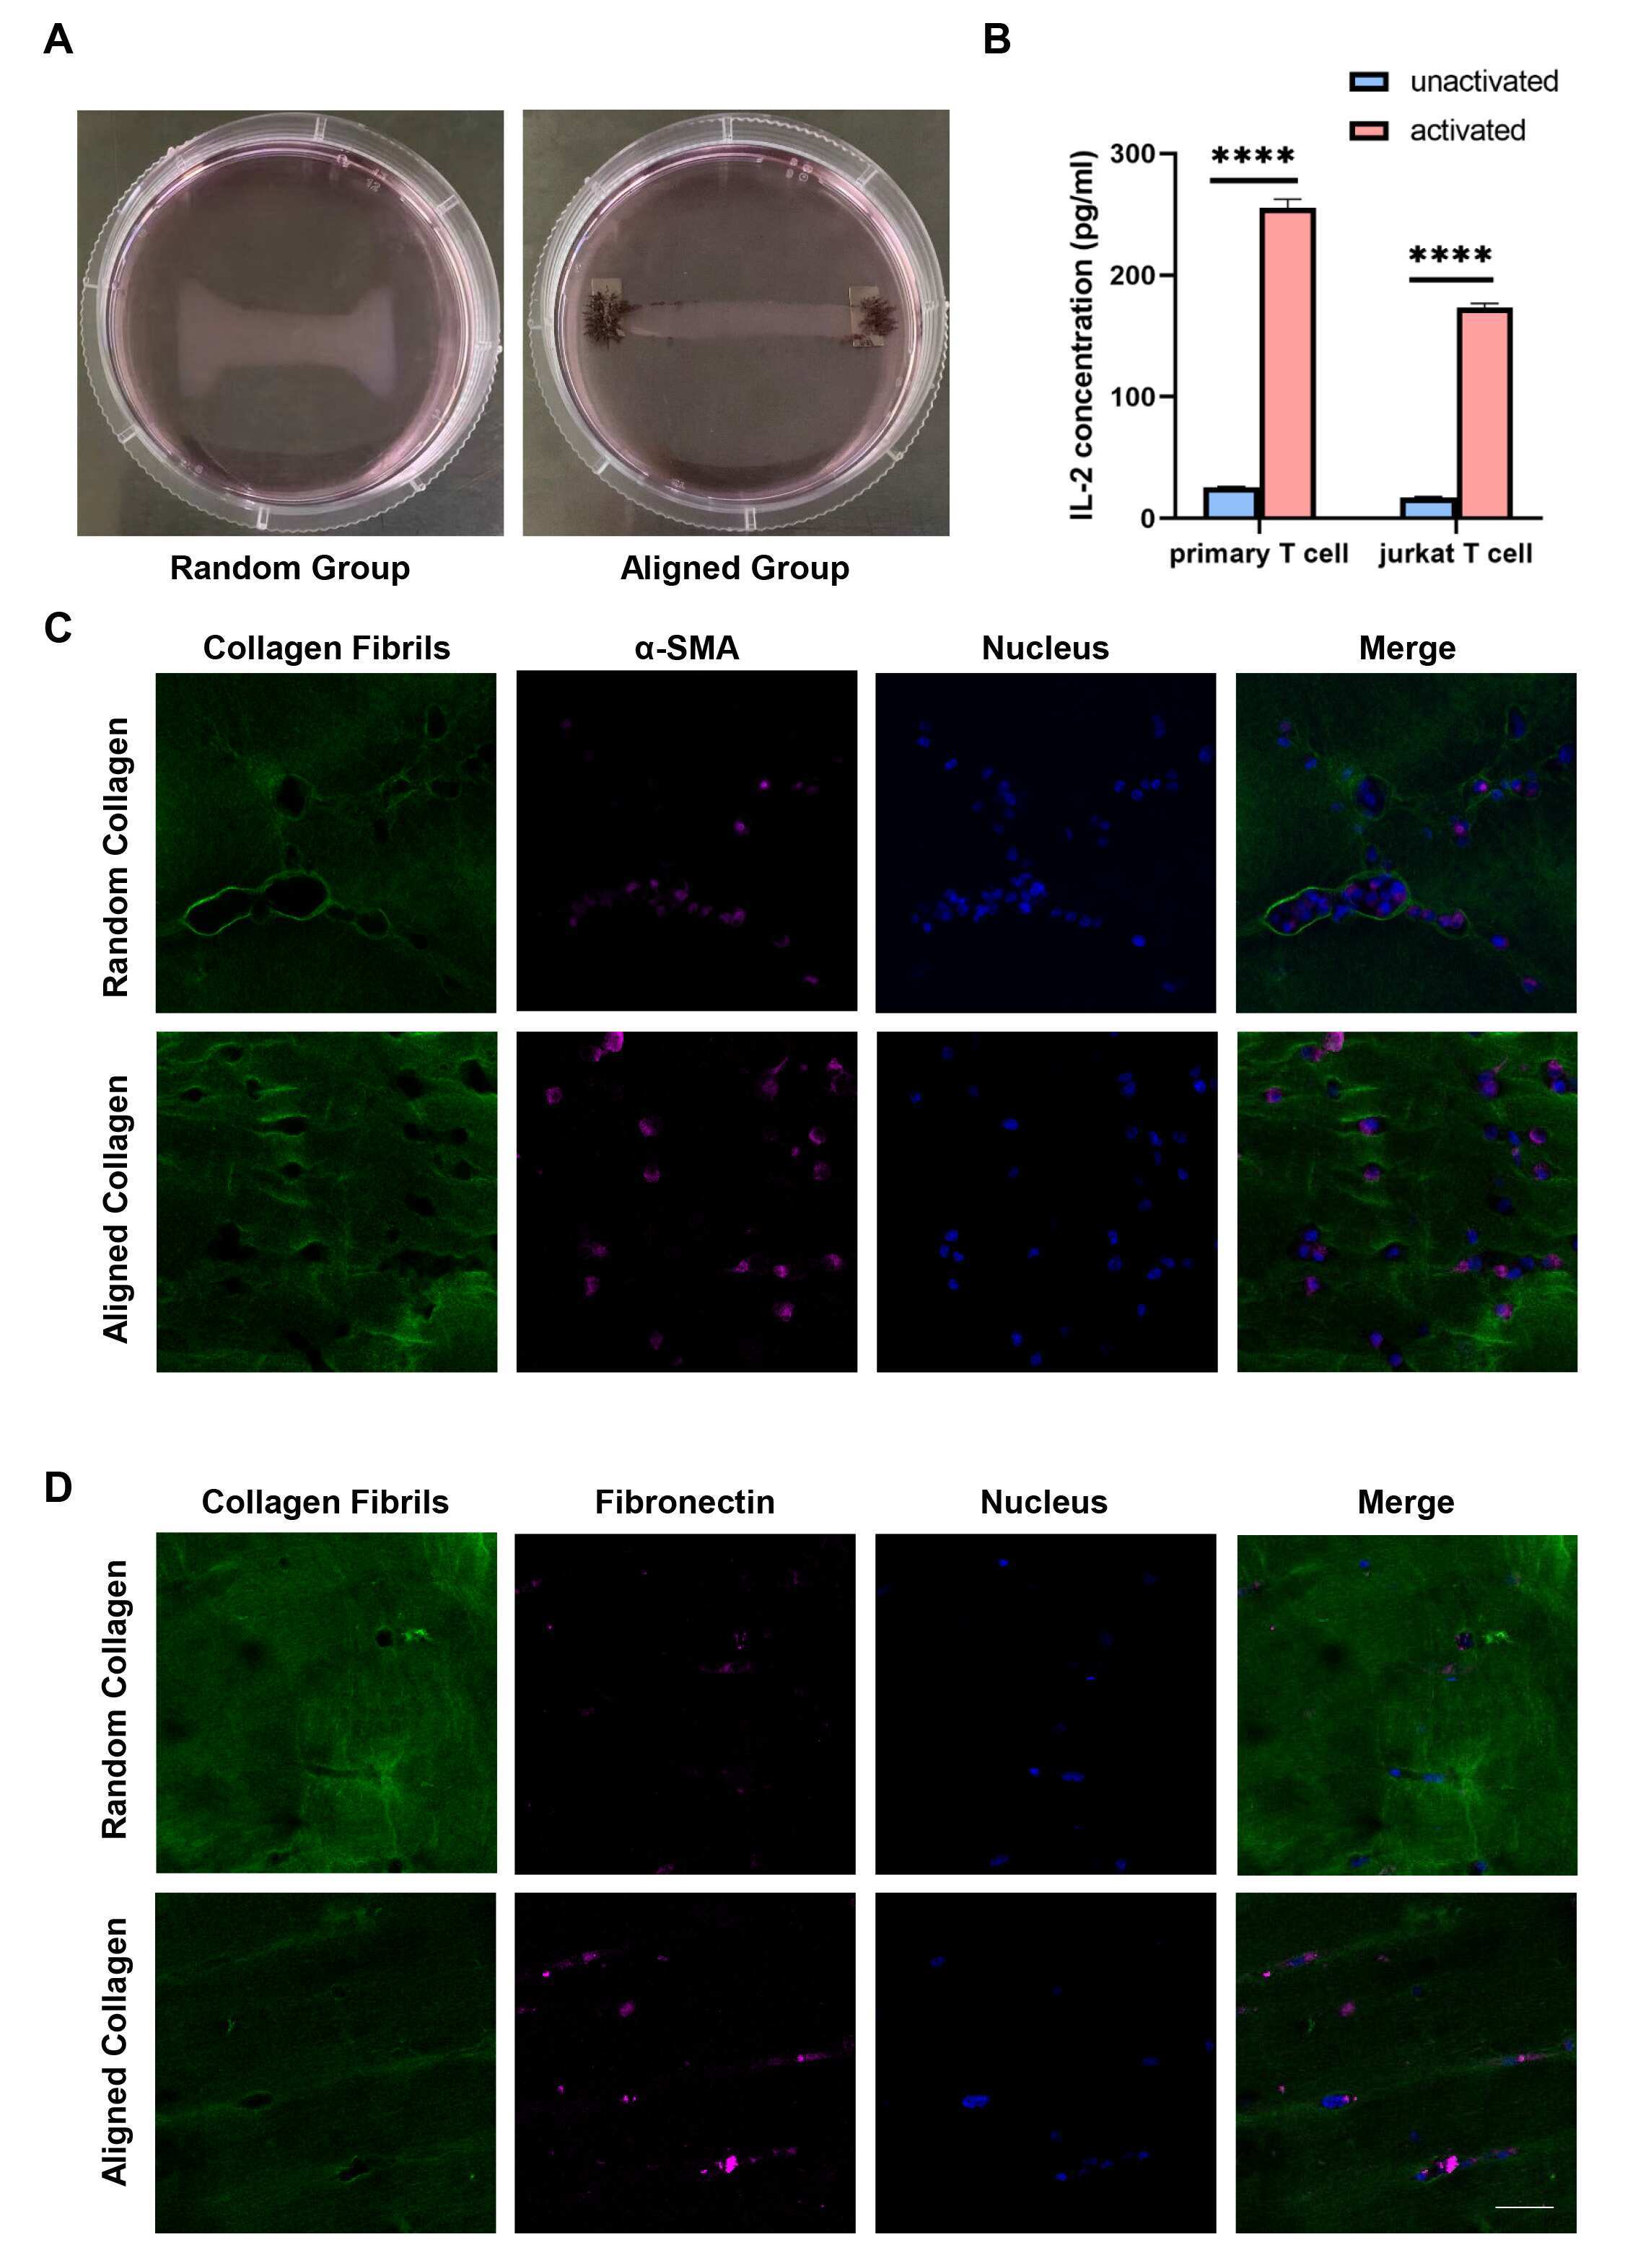
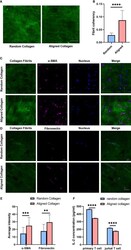
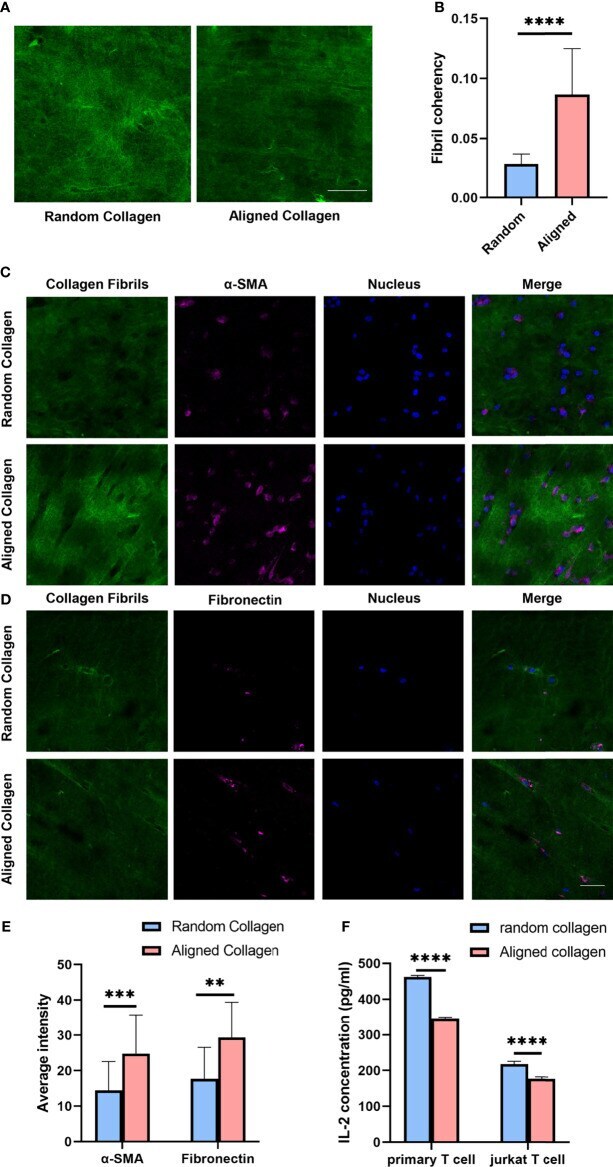
- Figure 6 Aligned collagen matrix enhances CAF induction and inhibit T cell activation. (A) Random and aligned collagen fibrils were successfully conducted by magnetic stretching. (B) Fibril coherency between the random and aligned groups. (C) Immunofluorescence staining of alpha-SMA of MRC-5 cells encapsulated in random and aligned collagen fibrils. (D) Immunofluorescence staining of fibronectin of MRC-5 cells encapsulated in random and aligned collagen fibrils. (E) Average fluorescence intensity of alpha-SMA and fibronectin between random and aligned groups. (F) IL-2 levels of activated primary T cells and Jurkat T cells encapsulated in random and aligned collagen fibrils. (scale bar, 50 mum). ** P < 0.01; *** P < 0.001, **** P < 0.0001.
- Submitted by
- Invitrogen Antibodies (provider)
- Main image
- Experimental details
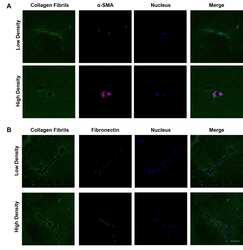
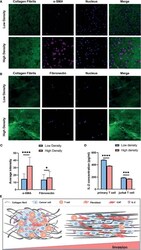
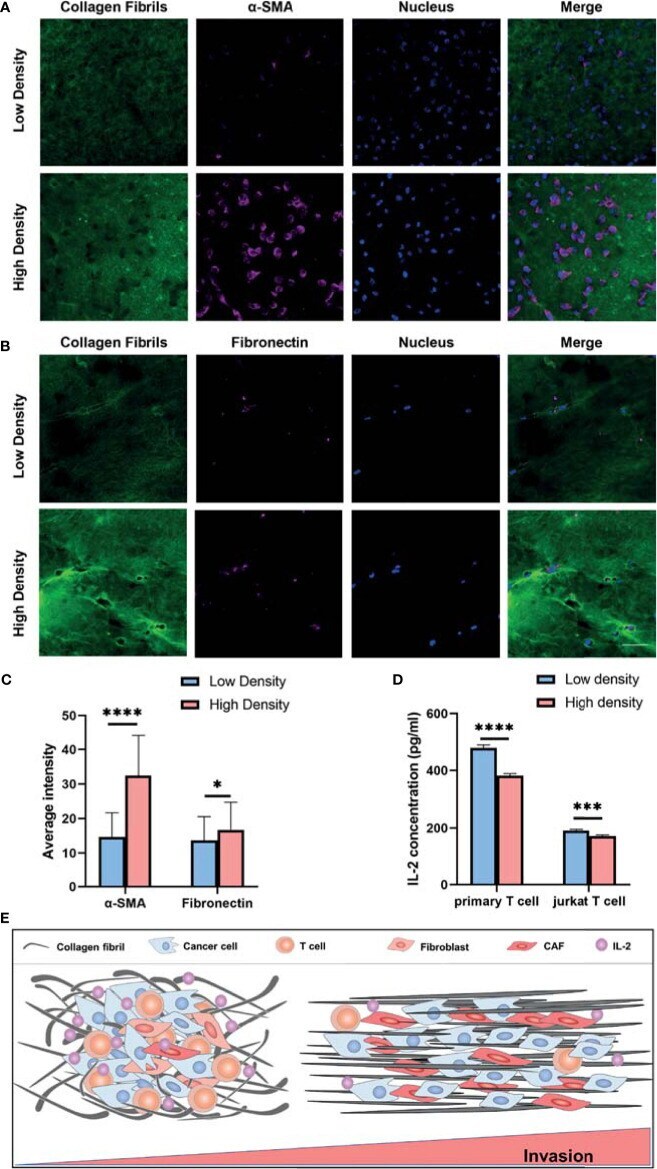
- Figure 7 Collagen density modulates the CAF induction and T cell activation. (A) Immunofluorescence staining of alpha-SMA of MRC-5 cells encapsulated in low and high density of collagen fibrils. (B) Immunofluorescence staining of fibronectin of MRC-5 cells encapsulated in low and high density of collagen fibrils. (C) Average fluorescence intensity of alpha-SMA and fibronectin between different collagen density groups. (D) IL-2 levels of activated primary T cells and Jurkat T cells encapsulated in low and high density collagen fibrils. (E) High invasive breast cancer subtypes exhibit increased ECM density and alignment consistency, which promotes tumor invasion due to immunosuppression of T cells as well as CAF activation. ns, not significant; (scale bar, 50 mum). * P < 0.05; *** P < 0.001, **** P < 0.0001.
- Submitted by
- Invitrogen Antibodies (provider)
- Main image
- Experimental details
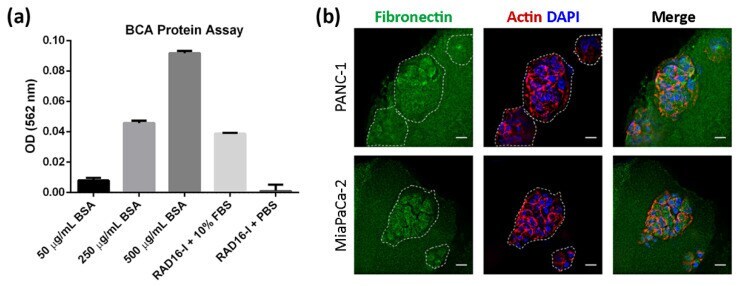
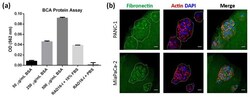
- Protein adsorbing into RAD16-I hydrogels. ( a ) BCA protein assay of RAD16-I gels. The graph shows the OD values obtained for known concentrations of protein (50 mug/mL-500 mug/mL BSA) and RAD16-I hydrogels assembled with 10% FBS or PBS; ( b ) fibronectin (green) immunofluorescence of PANC-1 and MiaPaCa-2 cells in RAD16-I 3D culture counterstained with phalloidin (red) and DAPI (blue). Scale bars represent 20 um.