Explore
 Validate
 Learn
Learn Western blot
Antibody data
- Antibody Data
- Antigen structure
- References [5]
- Comments [0]
- Validations
- Western blot [1]
- Immunocytochemistry [2]
- Flow cytometry [2]
- Chromatin Immunoprecipitation [1]
- Other assay [1]
Submit
Validation data
Reference
Comment
Report error
- Product number
- 700439 - Provider product page

- Provider
- Invitrogen Antibodies
- Product name
- Phospho-p53 (Ser15) Recombinant Rabbit Monoclonal Antibody (14H61L24)
- Antibody type
- Monoclonal
- Antigen
- Synthetic peptide
- Description
- This antibody is predicted to react with chimpanzee, guinea pig, porcine, ovine, bovine, equine, feline, Rhesus monkey and Xenopus based on sequence homology.
- Antibody clone number
- 14H61L24
- Concentration
- 0.5 mg/mL
Submitted references Molecular Consequences of Depression Treatment: A Potential In Vitro Mechanism for Antidepressants-Induced Reprotoxic Side Effects.
A small-molecule ICMT inhibitor delays senescence of Hutchinson-Gilford progeria syndrome cells.
Protective role of klotho protein on epithelial cells upon co-culture with activated or senescent monocytes.
Automated quantitative analysis of tissue microarray of 443 patients with colorectal adenocarcinoma: low expression of Bcl-2 predicts poor survival.
Profiling dose-dependent activation of p53-mediated signaling pathways by chemicals with distinct mechanisms of DNA damage.
Sołek P, Mytych J, Tabęcka-Łonczyńska A, Koziorowski M
International journal of molecular sciences 2021 Nov 1;22(21)
International journal of molecular sciences 2021 Nov 1;22(21)
A small-molecule ICMT inhibitor delays senescence of Hutchinson-Gilford progeria syndrome cells.
Chen X, Yao H, Kashif M, Revêchon G, Eriksson M, Hu J, Wang T, Liu Y, Tüksammel E, Strömblad S, Ahearn IM, Philips MR, Wiel C, Ibrahim MX, Bergo MO
eLife 2021 Feb 2;10
eLife 2021 Feb 2;10
Protective role of klotho protein on epithelial cells upon co-culture with activated or senescent monocytes.
Mytych J, Wos I, Solek P, Koziorowski M
Experimental cell research 2017 Jan 15;350(2):358-367
Experimental cell research 2017 Jan 15;350(2):358-367
Automated quantitative analysis of tissue microarray of 443 patients with colorectal adenocarcinoma: low expression of Bcl-2 predicts poor survival.
Nicholson AD, Guo X, Sullivan CA, Cha CH
Journal of the American College of Surgeons 2014 Nov;219(5):977-87
Journal of the American College of Surgeons 2014 Nov;219(5):977-87
Profiling dose-dependent activation of p53-mediated signaling pathways by chemicals with distinct mechanisms of DNA damage.
Clewell RA, Sun B, Adeleye Y, Carmichael P, Efremenko A, McMullen PD, Pendse S, Trask OJ, White A, Andersen ME
Toxicological sciences : an official journal of the Society of Toxicology 2014 Nov;142(1):56-73
Toxicological sciences : an official journal of the Society of Toxicology 2014 Nov;142(1):56-73
No comments: Submit comment
Supportive validation
- Submitted by
- Invitrogen Antibodies (provider)
- Main image
- Experimental details
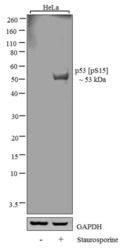
- Western blot analysis of p53 (pS15) was performed by loading 20 µg of HeLa (lane1) and HeLa treated overnight with 20 µM of Staurosporine (lane2) cell lysate using NuPAGE® Novex® 4-12% Bis-Tris gel (Product # NP0322BOX), XCell SureLock Electrophoresis System (Product # EI0002), Novex® Sharp Pre-Stained Protein Standard (Product # LC5800), and iBlot® Dry Blotting System (Product # IB21001). Proteins were transferred to a nitrocellulose membrane and blocked with 5% skim milk for 1 hour at room temperature. p53 (pS15) was detected at ~53 kDa using p53 (pS15) Recombinant Rabbit Monoclonal Antibody (Product # 700439) at 0.1-0.5 µg/mL in 2.5% skim milk at 4°C overnight on a rocking platform. Goat anti-Rabbit IgG - HRP Secondary Antibody (Product # G-21234) at 1:5000 dilution was used and chemiluminescent detection was performed using Pierce™ ECL Western blotting Substrate (Product # 32106).

Supportive validation
- Submitted by
- Invitrogen Antibodies (provider)
- Main image
- Experimental details
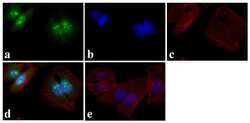
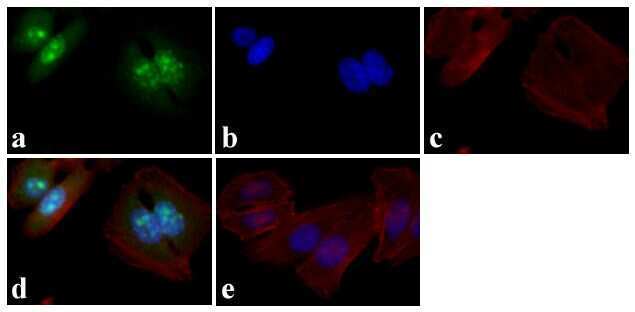
- Immunofluorescent analysis of p53 (pS15) was done on 70% confluent log phase HeLa cells. The cells were fixed with 4% paraformaldehyde for 15 minutes, permeabilized with 0.25% Triton X-100 for 10 minutes, and blocked with 5% BSA for 1 hour at room temperature. The cells were labeled with p53 (pS15) Recombinant Rabbit Monoclonal Antibody (Product # 700439) at 2 µg/mL and incubated for 3 hours at room temperature and then labeled with Alexa Fluor 488 Goat anti-Rabbit IgG Secondary Antibody (Product # A-11008) at a dilution of 1:400 for 30 minutes at room temperature (Panel a: green). Nuclei (Panel b: blue) were stained with SlowFade® Gold Antifade Mountant with DAPI (Product # S36938). F-actin (Panel c: red) was stained with Alexa Fluor 594 Phalloidin (Product # A12381). Panel d is a merged image showing nuclear and cytoplasmic localization. Panel e shows no primary antibody control. The images were captured at 20X magnification.
- Submitted by
- Invitrogen Antibodies (provider)
- Main image
- Experimental details
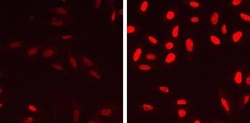
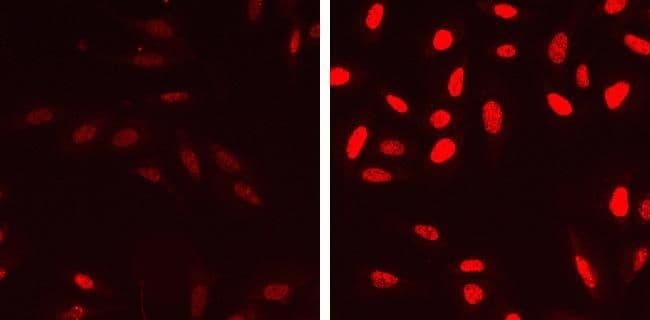
- Immunofluorescent analysis of Phospho-p53 pSer15 in U2OS cells treated with 0.25 µg/mL Camptothecin (right) and untreated cells (left) using a Phospho-p53 pSer15 recombinant rabbit monoclonal antibody (Product # 700439) at a dilution of 1 µg/mL followed by detection using an Alexa Fluor 488-conjugated goat anti-rabbit secondary antibody at a dilution of 1:1000.
Supportive validation
- Submitted by
- Invitrogen Antibodies (provider)
- Main image

- Experimental details
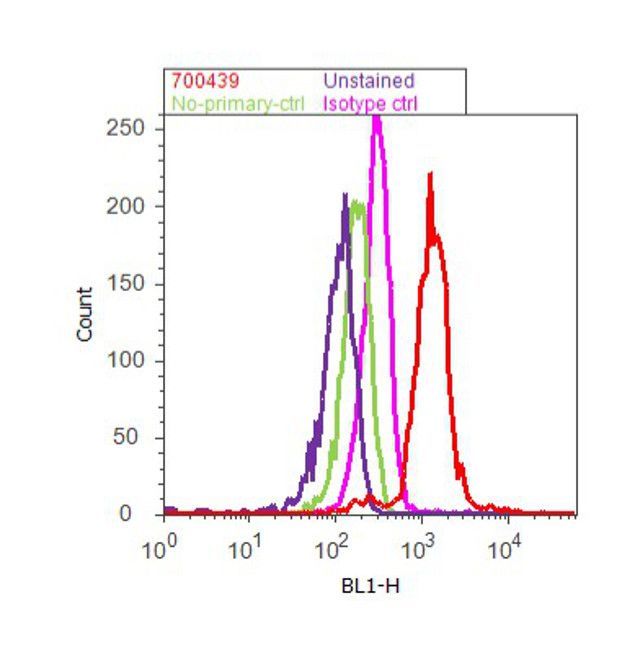
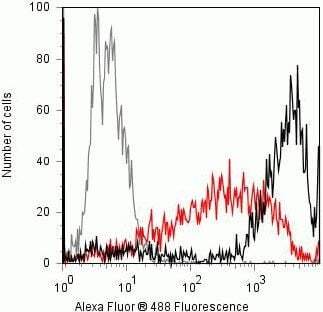
- Flow cytometry analysis of p53 [pS15] was done on HeLa cells. Cells were fixed with 70% ethanol for 10 minutes, permeabilized with 0.25% Triton™ X-100 for 20 minutes, and blocked with 5% BSA for 30 minutes at room temperature. Cells were labeled with ABfinity™ p53 [pS15] Recombinant Rabbit Monoclonal Antibody (700439, red histogram) or with rabbit isotype control (pink histogram) at 3-5 µg/million cells in 2.5% BSA. After incubation at room temperature for 2-3 hours, the cells were labeled with Alexa Fluor® 488 Goat Anti-Rabbit Secondary Antibody (A11008) at a dilution of 1:400 for 30 minutes at room temperature. The representative 10,000 cells were acquired and analyzed for each sample using an Attune® Acoustic Focusing Cytometer. The purple histogram represents unstained control cells and the green histogram represents no-primary-antibody control.
- Submitted by
- Invitrogen Antibodies (provider)
- Main image
- Experimental details
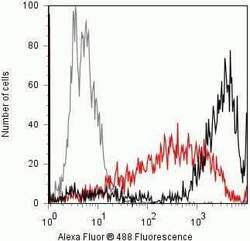
- Flow cytometry analysis of Phospho-p53 pSer15 in U2OS cells incubated with 5uM camptothecin for 4hr (black) or untreated (red) using a Phospho-p53 pSer15 recombinant rabbit monoclonal antibody (Product # 700439) at a dilution of 0.5 µg. Cells were fixed and permeabilized using FIX & PERM (Product # GAS-004) reagent, and detection was performed using an Alexa Fluor 488 goat anti-rabbit IgG compared to a control without primary antibody (gray).
Supportive validation
- Submitted by
- Invitrogen Antibodies (provider)
- Main image
- Experimental details
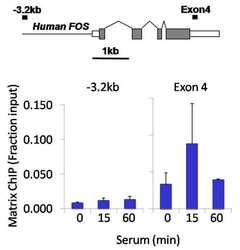
- Chromatin immunoprecipitation analysis of Phoshpo-p53 (pSer15) was performed using cross-linked chromatin from 1 x 10^6 HCT116 human colon carcinoma cells treated with serum for 0, 15, and 60 minutes. Immunoprecipitation was performed using a multiplex microplate Matrix ChIP assay (see reference for Matrix ChIP protocol: http://www.ncbi.nlm.nih.gov/pubmed/22098709) with 1.0 µL/100 µL well volume of a Phoshpo-p53 (pSer15) rabbit monoclonal antibody (Product # 700439). Chromatin aliquots from ~1 x 10^5 cells were used per ChIP pull-down. Quantitative PCR data were done in quadruplicate using 1 µL of eluted DNA in 2 µL SYBR real-time PCR reactions containing primers to amplify -3.2kb upstream of the human FOS gene, or exon-4 of human FOS. PCR calibration curves were generated for each primer pair from a dilution series of sheared total genomic DNA. Quantitation of immunoprecipitated chromatin is presented as signal relative to the total amount of input chromatin. Results represent the mean +/- SEM for three experiments. A schematic representation of the FOS locus is shown above the data where boxes represent exons (grey boxes = translated regions, white boxes = untranslated regions), the zigzag lines represent introns, and the straight line represents upstream sequence. Regions amplified by FOS primers are represented by black bars. Data courtesy of the Innovators Program.

Supportive validation
- Submitted by
- Invitrogen Antibodies (provider)
- Main image
- Experimental details
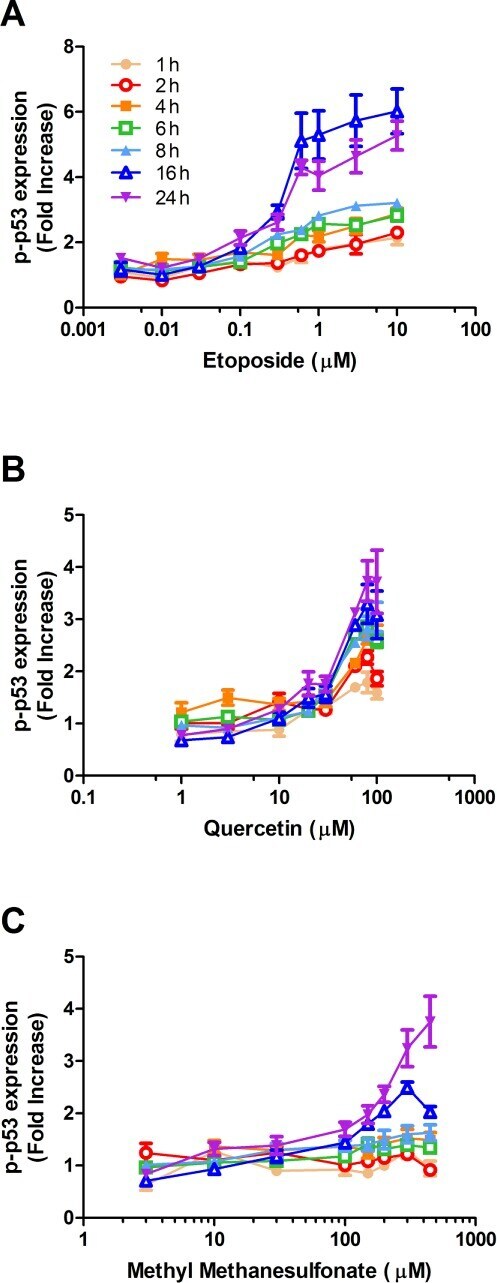
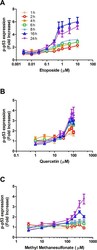
- FIG. 5. Time- and concentration-dependent response for p-p53(ser15) induction in HT1080 cells following exposure to (A) etoposide, (B) quercetin, and (C) methyl methanesulfonate. Cells were treated with DMSO (0.1%), etoposide, quercetin, or methyl methanesulfonate for 1, 2, 4, 6, 8, 16, or 24 h and analyzed for p-p53 using flow cytometry. Circles and triangles represent the mean of three independent experiments (three biological replicates, each with three technical replicates). Bars represent the standard error of the mean (SEM).