Explore
 Validate
 Learn
LearnPA5-47039
antibody from Invitrogen Antibodies
Targeting: IL1RAPL2
IL-1R9, IL1R9, IL1RAPL-2, TIGIRR-1
 Western blot
 Immunohistochemistry
 Flow cytometry
Antibody data
- Antibody Data
- Antigen structure
- References [1]
- Comments [0]
- Validations
- Flow cytometry [4]
- Other assay [1]
Submit
Validation data
Reference
Comment
Report error
- Product number
- PA5-47039 - Provider product page

- Provider
- Invitrogen Antibodies
- Product name
- IL1RAPL2 Polyclonal Antibody
- Antibody type
- Polyclonal
- Antigen
- Recombinant full-length protein
- Description
- In direct ELISAs, approximately 35% cross-reactivity with recombinant mouse IL-1 RAPL2/IL-1 R9 is observed. In Western blots, approximately 5% cross-reactivity with recombinant human (rh) IL-1 R7 is observed and less than 1% cross-reactivity with rhIL-1 R2 and rhIL-1 R8 is observed. Reconstitute at 0.2 mg/mL in sterile PBS.
- Reactivity
- Human
- Host
- Goat
- Isotype
- IgG
- Vial size
- 100 μg
- Concentration
- 0.2 mg/mL
- Storage
- -20°C, Avoid Freeze/Thaw Cycles
Submitted references Gene-expression correlates of the oscillatory signatures supporting human episodic memory encoding.
Berto S, Fontenot MR, Seger S, Ayhan F, Caglayan E, Kulkarni A, Douglas C, Tamminga CA, Lega BC, Konopka G
Nature neuroscience 2021 Apr;24(4):554-564
Nature neuroscience 2021 Apr;24(4):554-564
No comments: Submit comment
Supportive validation
- Submitted by
- Invitrogen Antibodies (provider)
- Main image
- Experimental details
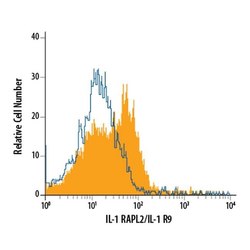
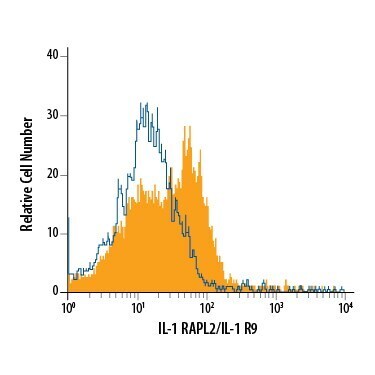
- Flow cytometric analysis of HepG2 human hepatocellular carcinoma cell line was stained with Goat Anti-human IL-1 RAPL2/IL-1 R9 Antigen Affinity-purified Polyclonal Antibody (Product # PA5-47039, filled histogram) or control antibody (open histogram), followed by Allophycocyanin-conjugated Anti-Goat IgG Secondary Antibody.
- Submitted by
- Invitrogen Antibodies (provider)
- Main image

- Experimental details
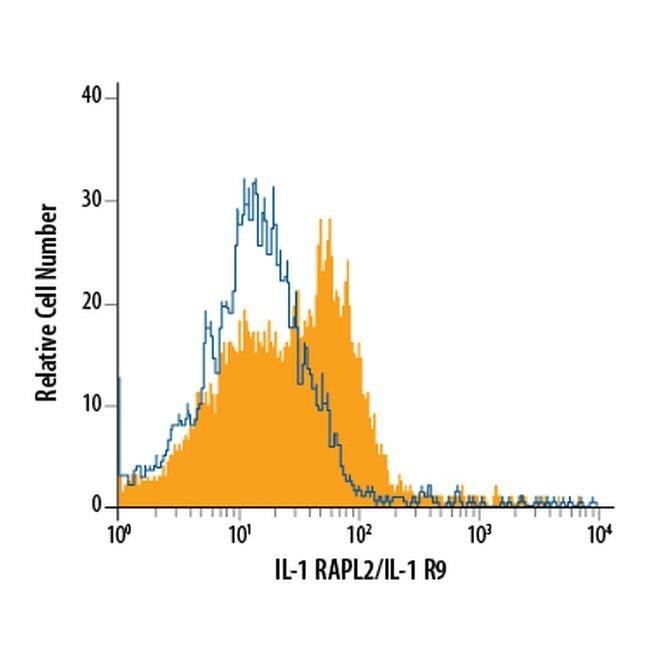
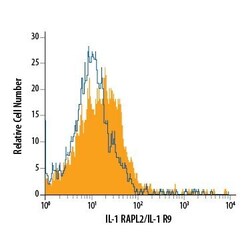
- Flow cytometry of IL1RAPL2 in Hepa 1‚6 mouse hepatoma cell line. Samples were incubated in IL1RAPL2 polyclonal antibody (Product # PA5-47039) or control antibody followed by Allophycocyanin-conjugated Anti-Goat IgG Secondary Antibody.

- Submitted by
- Invitrogen Antibodies (provider)
- Main image
- Experimental details
- Flow cytometry of IL1RAPL2 in HepG2 human hepatocellular carcinoma cell line. Samples were incubated in IL1RAPL2 polyclonal antibody (Product # PA5-47039) or control antibody followed by Allophycocyanin-conjugated Anti-Goat IgG Secondary Antibody.
- Submitted by
- Invitrogen Antibodies (provider)
- Main image
- Experimental details
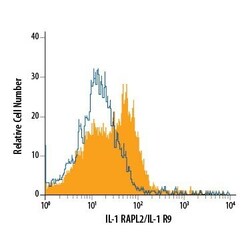
- Flow cytometry of IL1RAPL2 in Hepa 1‚6 mouse hepatoma cell line. Samples were incubated in IL1RAPL2 polyclonal antibody (Product # PA5-47039) or control antibody followed by Allophycocyanin-conjugated Anti-Goat IgG Secondary Antibody.

Supportive validation
- Submitted by
- Invitrogen Antibodies (provider)
- Main image
- Experimental details
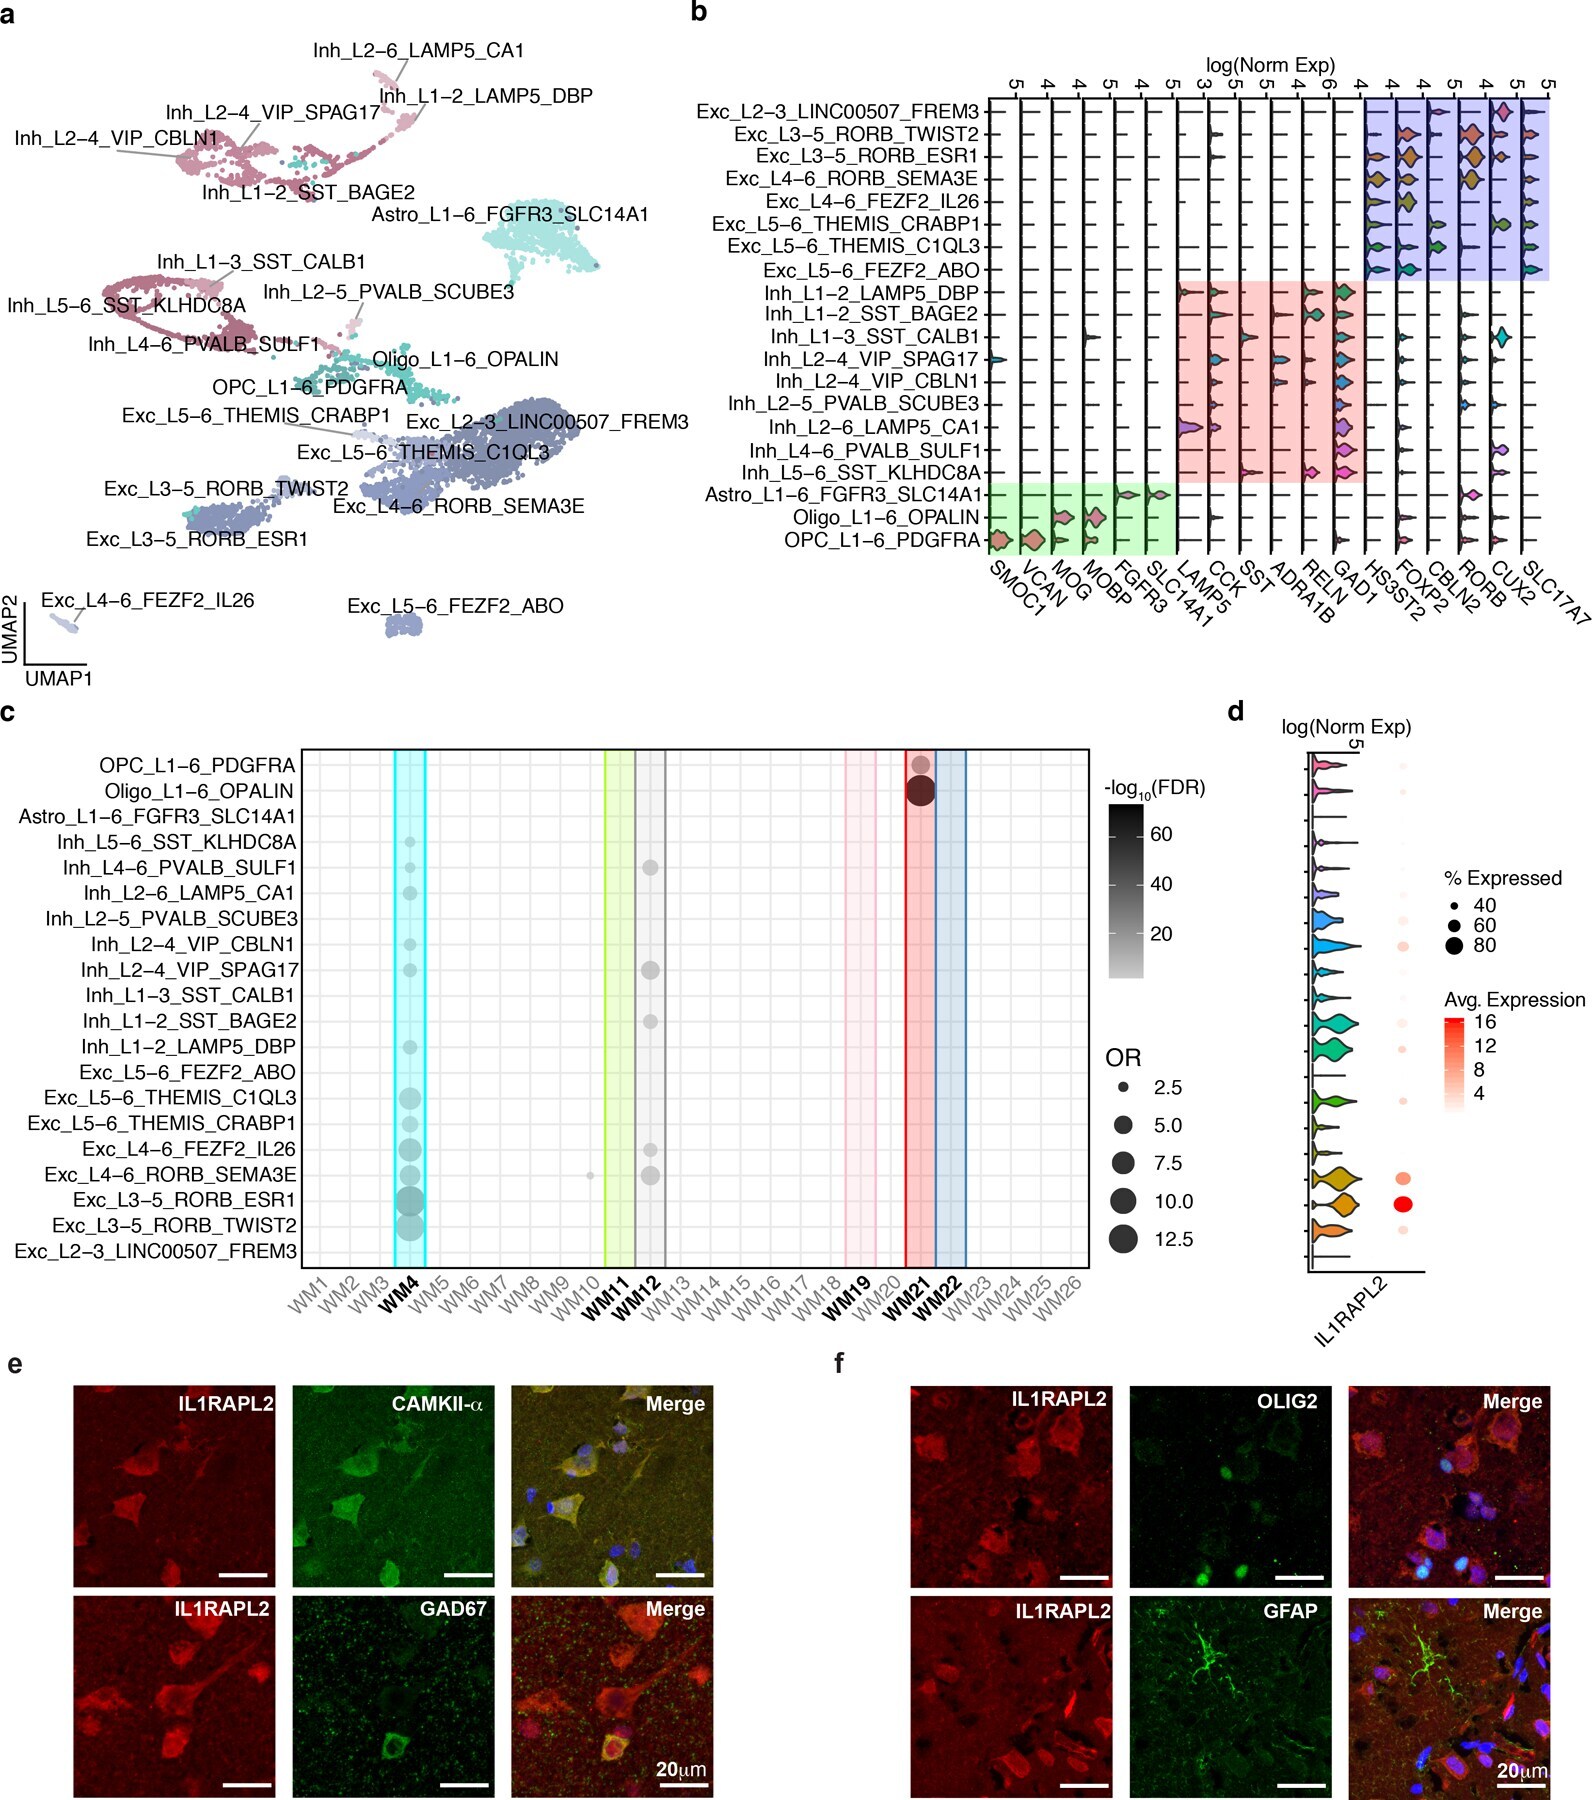
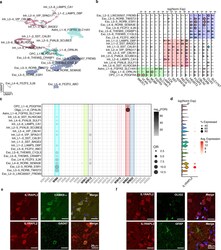
- Fig. 5: SME-specific modules are enriched for excitatory and inhibitory neurons. a, Uniform manifold approximation and projection (UMAP) representation of the 20 classes of cell-types using the BA38 snRNA-seq. Each dot represents a nucleus. Excitatory neurons are highlighted in blue gradient, the inhibitory neurons in red gradient, and the non-neuronal cells in light blue gradient. Cell-types were annotated using a publicly available single cell data. A Fisher's exact enrichment test between cell markers of the two datasets was performed. Major cell types tend to cluster near one another. b, Violin-plots representing gene markers for the major cell-types detected. Y-axis represents the log normalized expression (log(Norm Exp)) of each marker gene in each cluster. The markers for excitatory neurons (e.g. CUX, RORB ) are highlighted in blue. The markers for inhibitory neurons (e.g. GAD1, RELN ) are highlighted in red. The markers for non-neuronal cells (e.g. FGFR3, MOBP, VCAN ) are highlighted in green. c, Bubble-chart showing the enrichment of the SME modules for cell-type markers defined by Seurat. Color gradient represents the -log 10 (FDR) and bubble size represent the odds ratio (OR) from a Fisher's exact enrichment test of genes in modules from this study with genes expressed in specific cell types defined by our snRNA-seq data. X-axis represents the SME-specific modules. Y-axis represents the cell classes of the present study. Boldface type indicates the six modules sign