Explore
 Validate
 Learn
Learn50-9326-42
antibody from Invitrogen Antibodies
Targeting: EPCAM
17-1A, 323/A3, CD326, CO-17A, EGP-2, EGP34, EGP40, Ep-CAM, ESA, GA733-2, HEA125, KS1/4, KSA, Ly74, M4S1, MH99, MIC18, MK-1, MOC31, TACST-1, TACSTD1, TROP1
 Immunocytochemistry
Antibody data
- Antibody Data
- Antigen structure
- References [19]
- Comments [0]
- Validations
- Immunocytochemistry [1]
- Flow cytometry [2]
- Other assay [20]
Submit
Validation data
Reference
Comment
Report error
- Product number
- 50-9326-42 - Provider product page

- Provider
- Invitrogen Antibodies
- Product name
- CD326 (EpCAM) Monoclonal Antibody (1B7), eFluor™ 660, eBioscience™
- Antibody type
- Monoclonal
- Antigen
- Other
- Description
- Description: EpCAM (Epithelial cell adhesion molecule, CD326, KSA, TROP1) is a 40 kD cell-surface adhesion molecule participating in homophilic, calcium-independent cell-cell interactions. EpCAM is a type-I transmembrane protein, and is expressed primarily on the basolateral surface of most epithelia. Although normal epithelia express low levels of EpCAM, increased expression has been correlated with increased proliferation and progression to a mesenchymal phenotype. EpCAM has also been used as a diagnostic marker on circulating metastatic carcinoma cells, while cancer cells of non-epithelial origin do not express EpCAM. Applications Reported: This 1B7 antibody has been reported for use in flow cytometric analysis. Applications Tested: This 1B7 antibody has been pre-titrated and tested by flow cytometric analysis of human A549 cell line. This can be used at 5 µL (0.06 µg) per test. A test is defined as the amount (µg) of antibody that will stain a cell sample in a final volume of 100 µL. Cell number should be determined empirically but can range from 10^5 to 10^8 cells/test. eFluor® 660 is a replacement for Alexa Fluor® 647. eFluor® 660 emits at 659 nm and is excited with the red laser (633 nm). Please make sure that your instrument is capable of detecting this fluorochome. Excitation: 633-647 nm; Emission: 668 nm; Laser: Red Laser. Filtration: 0.2 µm post-manufacturing filtered.
- Reactivity
- Human
- Host
- Mouse
- Isotype
- IgG
- Antibody clone number
- 1B7
- Vial size
- 100 Tests
- Concentration
- 5 µL/Test
- Storage
- 4°C, store in dark, DO NOT FREEZE!
Submitted references The sodium/glucose cotransporters as potential therapeutic targets for CF lung diseases revealed by human lung organoid swelling assay.
Parathyroid Hormone-Related Protein Inhibition Blocks Triple-Negative Breast Cancer Expansion in Bone Through Epithelial to Mesenchymal Transition Reversal.
EMP3 negatively modulates breast cancer cell DNA replication, DNA damage repair, and stem-like properties.
Chemotherapeutic Stress Influences Epithelial-Mesenchymal Transition and Stemness in Cancer Stem Cells of Triple-Negative Breast Cancer.
Helicobacter pylori promote inflammation and host defense through the cagA-dependent activation of mTORC1.
FZD5 contributes to TNBC proliferation, DNA damage repair and stemness.
Profiling human breast epithelial cells using single cell RNA sequencing identifies cell diversity.
KDM4 Inhibition Targets Breast Cancer Stem-like Cells.
Evidence of In Vitro Preservation of Human Nephrogenesis at the Single-Cell Level.
TGF-β1 secreted by Tregs in lymph nodes promotes breast cancer malignancy via up-regulation of IL-17RB.
Epithelia Use Butyrophilin-like Molecules to Shape Organ-Specific γδ T Cell Compartments.
The isolation and characterization of CTC subsets related to breast cancer dormancy.
Clostridium perfringens enterotoxin C-terminal domain labeled to fluorescent dyes for in vivo visualization of micrometastatic chemotherapy-resistant ovarian cancer.
NDY1/KDM2B functions as a master regulator of polycomb complexes and controls self-renewal of breast cancer stem cells.
GATA3 suppresses metastasis and modulates the tumour microenvironment by regulating microRNA-29b expression.
Estrogen and progesterone together expand murine endometrial epithelial progenitor cells.
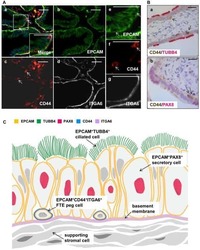
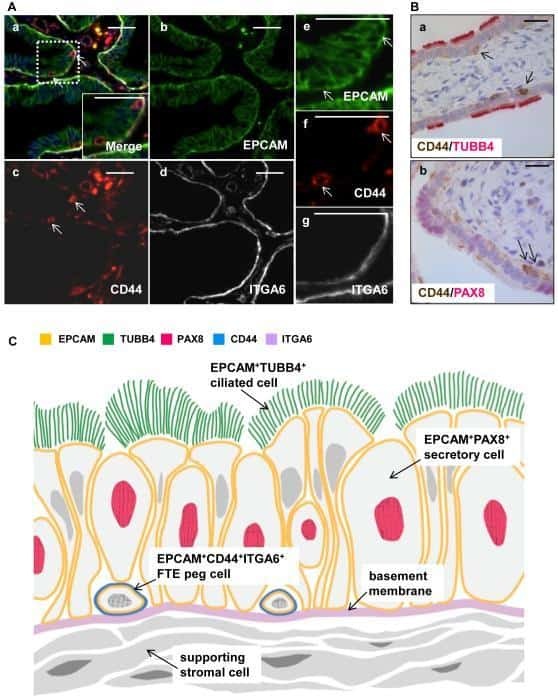
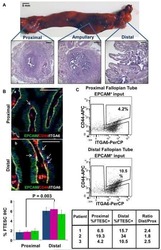
Stem-like epithelial cells are concentrated in the distal end of the fallopian tube: a site for injury and serous cancer initiation.
Slow-cycling therapy-resistant cancer cells.
Exploration of target molecules for prostate cancer gene therapy.
Hirai H, Liang X, Sun Y, Zhang Y, Zhang J, Chen YE, Mou H, Zhao Y, Xu J
Molecular therapy. Methods & clinical development 2022 Mar 10;24:11-19
Molecular therapy. Methods & clinical development 2022 Mar 10;24:11-19
Parathyroid Hormone-Related Protein Inhibition Blocks Triple-Negative Breast Cancer Expansion in Bone Through Epithelial to Mesenchymal Transition Reversal.
Li J, Camirand A, Zakikhani M, Sellin K, Guo Y, Luan X, Mihalcioiu C, Kremer R
JBMR plus 2022 Jun;6(6):e10587
JBMR plus 2022 Jun;6(6):e10587
EMP3 negatively modulates breast cancer cell DNA replication, DNA damage repair, and stem-like properties.
Zhou K, Sun Y, Dong D, Zhao C, Wang W
Cell death & disease 2021 Sep 12;12(9):844
Cell death & disease 2021 Sep 12;12(9):844
Chemotherapeutic Stress Influences Epithelial-Mesenchymal Transition and Stemness in Cancer Stem Cells of Triple-Negative Breast Cancer.
Li X, Strietz J, Bleilevens A, Stickeler E, Maurer J
International journal of molecular sciences 2020 Jan 8;21(2)
International journal of molecular sciences 2020 Jan 8;21(2)
Helicobacter pylori promote inflammation and host defense through the cagA-dependent activation of mTORC1.
Feng GJ, Chen Y, Li K
Journal of cellular physiology 2020 Dec;235(12):10094-10108
Journal of cellular physiology 2020 Dec;235(12):10094-10108
FZD5 contributes to TNBC proliferation, DNA damage repair and stemness.
Sun Y, Wang Z, Na L, Dong D, Wang W, Zhao C
Cell death & disease 2020 Dec 12;11(12):1060
Cell death & disease 2020 Dec 12;11(12):1060
Profiling human breast epithelial cells using single cell RNA sequencing identifies cell diversity.
Nguyen QH, Pervolarakis N, Blake K, Ma D, Davis RT, James N, Phung AT, Willey E, Kumar R, Jabart E, Driver I, Rock J, Goga A, Khan SA, Lawson DA, Werb Z, Kessenbrock K
Nature communications 2018 May 23;9(1):2028
Nature communications 2018 May 23;9(1):2028
KDM4 Inhibition Targets Breast Cancer Stem-like Cells.
Metzger E, Stepputtis SS, Strietz J, Preca BT, Urban S, Willmann D, Allen A, Zenk F, Iovino N, Bronsert P, Proske A, Follo M, Boerries M, Stickeler E, Xu J, Wallace MB, Stafford JA, Kanouni T, Maurer J, Schüle R
Cancer research 2017 Nov 1;77(21):5900-5912
Cancer research 2017 Nov 1;77(21):5900-5912
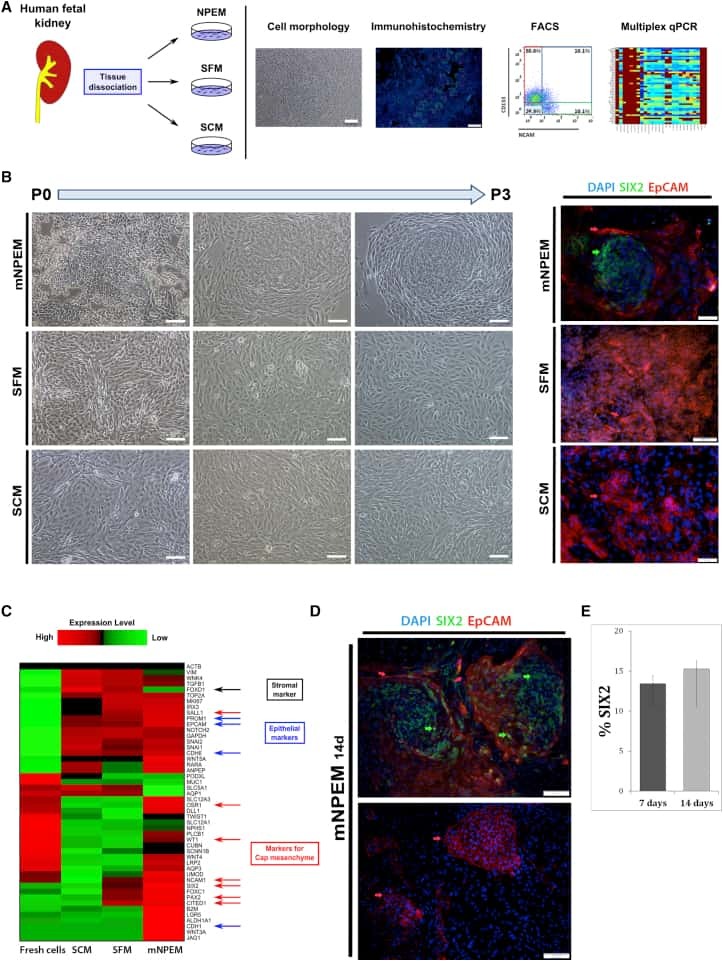
Evidence of In Vitro Preservation of Human Nephrogenesis at the Single-Cell Level.
Pode-Shakked N, Gershon R, Tam G, Omer D, Gnatek Y, Kanter I, Oriel S, Katz G, Harari-Steinberg O, Kalisky T, Dekel B
Stem cell reports 2017 Jul 11;9(1):279-291
Stem cell reports 2017 Jul 11;9(1):279-291
TGF-β1 secreted by Tregs in lymph nodes promotes breast cancer malignancy via up-regulation of IL-17RB.
Huang SC, Wei PC, Hwang-Verslues WW, Kuo WH, Jeng YM, Hu CM, Shew JY, Huang CS, Chang KJ, Lee EY, Lee WH
EMBO molecular medicine 2017 Dec;9(12):1660-1680
EMBO molecular medicine 2017 Dec;9(12):1660-1680
Epithelia Use Butyrophilin-like Molecules to Shape Organ-Specific γδ T Cell Compartments.
Di Marco Barros R, Roberts NA, Dart RJ, Vantourout P, Jandke A, Nussbaumer O, Deban L, Cipolat S, Hart R, Iannitto ML, Laing A, Spencer-Dene B, East P, Gibbons D, Irving PM, Pereira P, Steinhoff U, Hayday A
Cell 2016 Sep 22;167(1):203-218.e17
Cell 2016 Sep 22;167(1):203-218.e17
The isolation and characterization of CTC subsets related to breast cancer dormancy.
Vishnoi M, Peddibhotla S, Yin W, T Scamardo A, George GC, Hong DS, Marchetti D
Scientific reports 2015 Dec 3;5:17533
Scientific reports 2015 Dec 3;5:17533
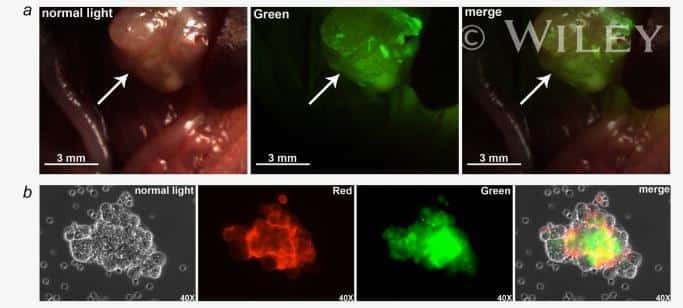
Clostridium perfringens enterotoxin C-terminal domain labeled to fluorescent dyes for in vivo visualization of micrometastatic chemotherapy-resistant ovarian cancer.
Cocco E, Shapiro EM, Gasparrini S, Lopez S, Schwab CL, Bellone S, Bortolomai I, Sumi NJ, Bonazzoli E, Nicoletti R, Deng Y, Saltzman WM, Zeiss CJ, Centritto F, Black JD, Silasi DA, Ratner E, Azodi M, Rutherford TJ, Schwartz PE, Pecorelli S, Santin AD
International journal of cancer 2015 Dec 1;137(11):2618-29
International journal of cancer 2015 Dec 1;137(11):2618-29
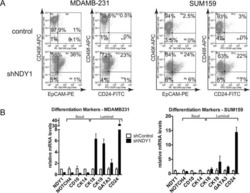
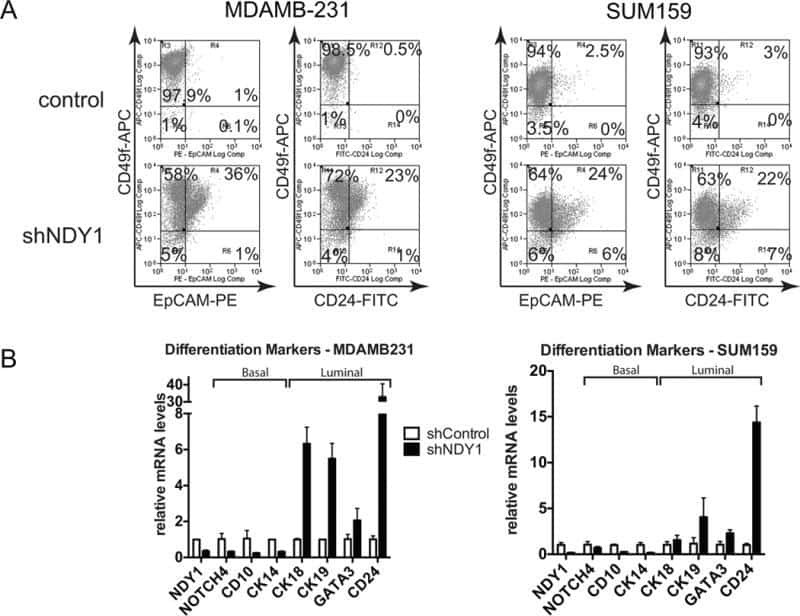
NDY1/KDM2B functions as a master regulator of polycomb complexes and controls self-renewal of breast cancer stem cells.
Kottakis F, Foltopoulou P, Sanidas I, Keller P, Wronski A, Dake BT, Ezell SA, Shen Z, Naber SP, Hinds PW, McNiel E, Kuperwasser C, Tsichlis PN
Cancer research 2014 Jul 15;74(14):3935-46
Cancer research 2014 Jul 15;74(14):3935-46
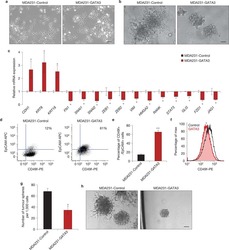
GATA3 suppresses metastasis and modulates the tumour microenvironment by regulating microRNA-29b expression.
Chou J, Lin JH, Brenot A, Kim JW, Provot S, Werb Z
Nature cell biology 2013 Feb;15(2):201-13
Nature cell biology 2013 Feb;15(2):201-13
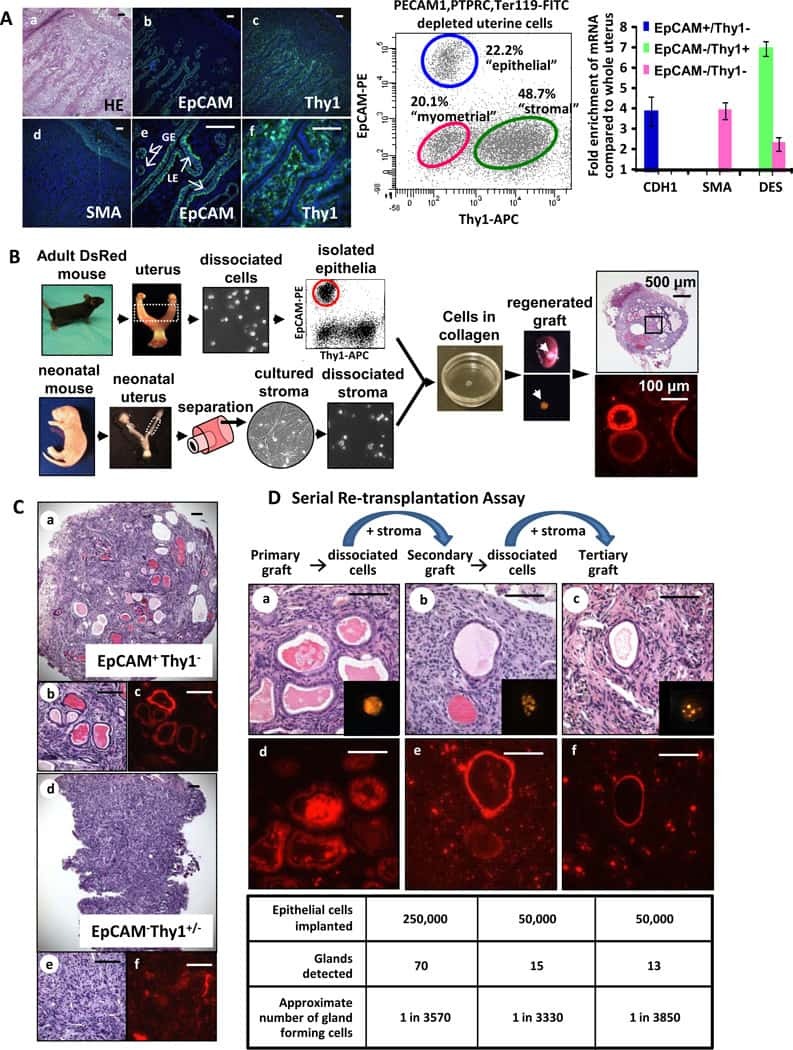
Estrogen and progesterone together expand murine endometrial epithelial progenitor cells.
Janzen DM, Cheng D, Schafenacker AM, Paik DY, Goldstein AS, Witte ON, Jaroszewicz A, Pellegrini M, Memarzadeh S
Stem cells (Dayton, Ohio) 2013 Apr;31(4):808-22
Stem cells (Dayton, Ohio) 2013 Apr;31(4):808-22
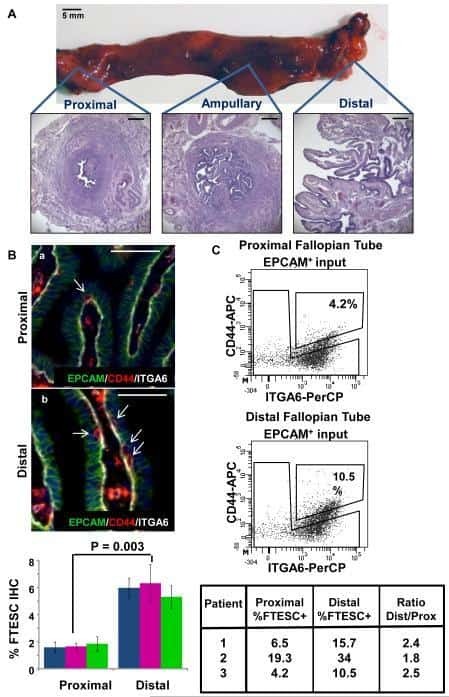
Stem-like epithelial cells are concentrated in the distal end of the fallopian tube: a site for injury and serous cancer initiation.
Paik DY, Janzen DM, Schafenacker AM, Velasco VS, Shung MS, Cheng D, Huang J, Witte ON, Memarzadeh S
Stem cells (Dayton, Ohio) 2012 Nov;30(11):2487-97
Stem cells (Dayton, Ohio) 2012 Nov;30(11):2487-97
Slow-cycling therapy-resistant cancer cells.
Moore N, Houghton J, Lyle S
Stem cells and development 2012 Jul 1;21(10):1822-30
Stem cells and development 2012 Jul 1;21(10):1822-30
Exploration of target molecules for prostate cancer gene therapy.
Suzuki K, Nakamura K, Kato K, Hamada H, Tsukamoto T
The Prostate 2007 Aug 1;67(11):1163-73
The Prostate 2007 Aug 1;67(11):1163-73
No comments: Submit comment
Supportive validation
- Submitted by
- Invitrogen Antibodies (provider)
- Main image
- Experimental details
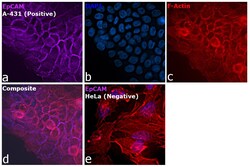
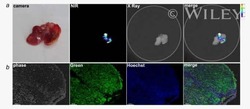
- Immunofluorescence analysis of CD326 (EpCAM) was performed using 90% confluent log phase A-431 cells. The cells were fixed with 4% paraformaldehyde for 10 minutes, permeabilized with 0.1% Triton™ X-100 for 15 minutes, and blocked with 2% BSA for 1 hour at room temperature. The cells were labeled with CD326 (EpCAM) Monoclonal Antibody (1B7), eFluor™ 660, eBioscience™ (Product # 50-9326-42, 1:100) in 0.1% BSA, incubated at 4 degree celsius overnight (Panel a: Purple). Nuclei (Panel b:Blue) were stained with ProLong™ Diamond Antifade Mountant with DAPI (Product # P36962). F-actin (Panel c: Red) was stained with Rhodamine Phalloidin (Product # R415, 1:300). Panel d represents the merged image showing localization in cytoplasm and cell junction. Panel e represents HeLa cells which do not express EpCAM. The images were captured at 60X magnification.

Supportive validation
- Submitted by
- Invitrogen Antibodies (provider)
- Main image
- Experimental details
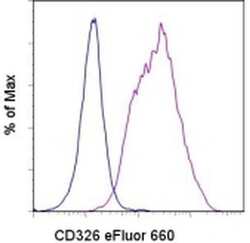
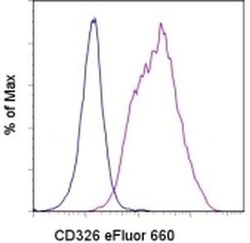
- Staining of the A549 cell line with Mouse IgG1 K Isotype Control eFluor® 660 (Product # 50-4714-82) (blue histogram) or Anti-Human CD326 (EpCAM) eFluor® 660 (purple histogram). Total viable cells were used for analysis.
- Submitted by
- Invitrogen Antibodies (provider)
- Main image
- Experimental details
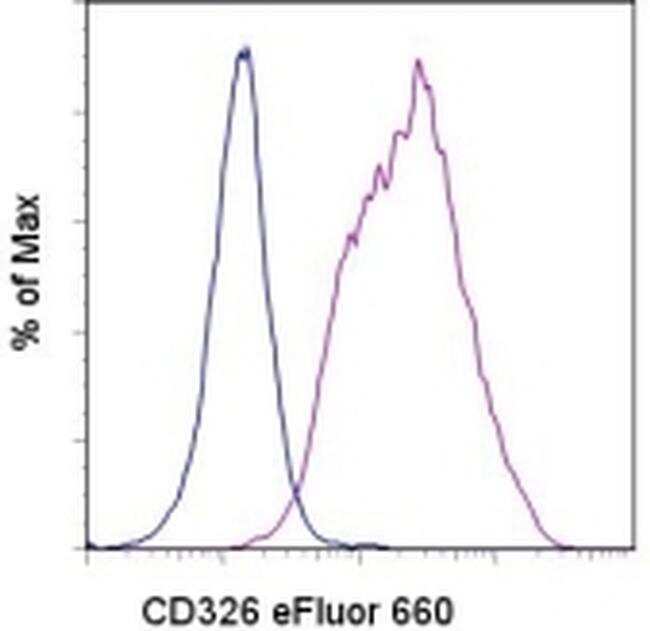
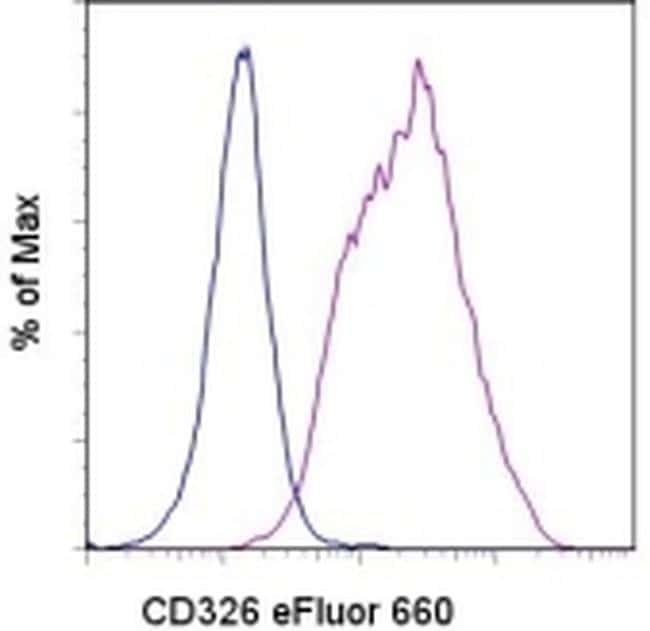
- Staining of the A549 cell line with Mouse IgG1 K Isotype Control eFluor® 660 (Product # 50-4714-82) (blue histogram) or Anti-Human CD326 (EpCAM) eFluor® 660 (purple histogram). Total viable cells were used for analysis.
Supportive validation
- Submitted by
- Invitrogen Antibodies (provider)
- Main image

- Experimental details
- NULL
- Submitted by
- Invitrogen Antibodies (provider)
- Main image

- Experimental details
- NULL
- Submitted by
- Invitrogen Antibodies (provider)
- Main image
- Experimental details
- NULL

- Submitted by
- Invitrogen Antibodies (provider)
- Main image

- Experimental details
- NULL
- Submitted by
- Invitrogen Antibodies (provider)
- Main image
- Experimental details
- NULL
- Submitted by
- Invitrogen Antibodies (provider)
- Main image
- Experimental details
- NULL
- Submitted by
- Invitrogen Antibodies (provider)
- Main image
- Experimental details
- NULL

- Submitted by
- Invitrogen Antibodies (provider)
- Main image
- Experimental details
- NULL
- Submitted by
- Invitrogen Antibodies (provider)
- Main image
- Experimental details
- NULL
- Submitted by
- Invitrogen Antibodies (provider)
- Main image
- Experimental details
- NULL
- Submitted by
- Invitrogen Antibodies (provider)
- Main image
- Experimental details
- NULL
- Submitted by
- Invitrogen Antibodies (provider)
- Main image
- Experimental details
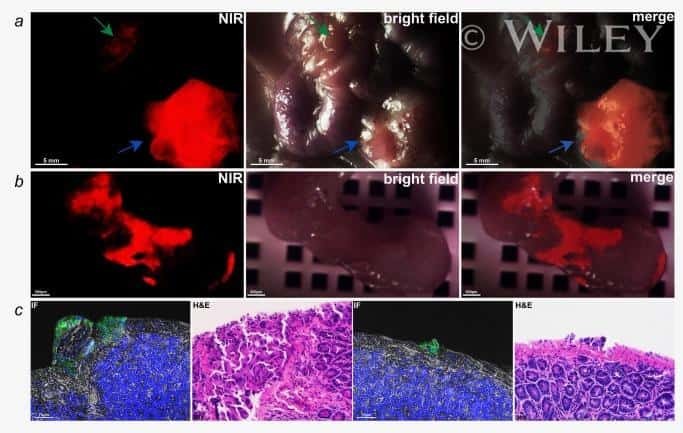
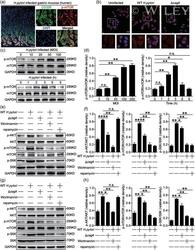
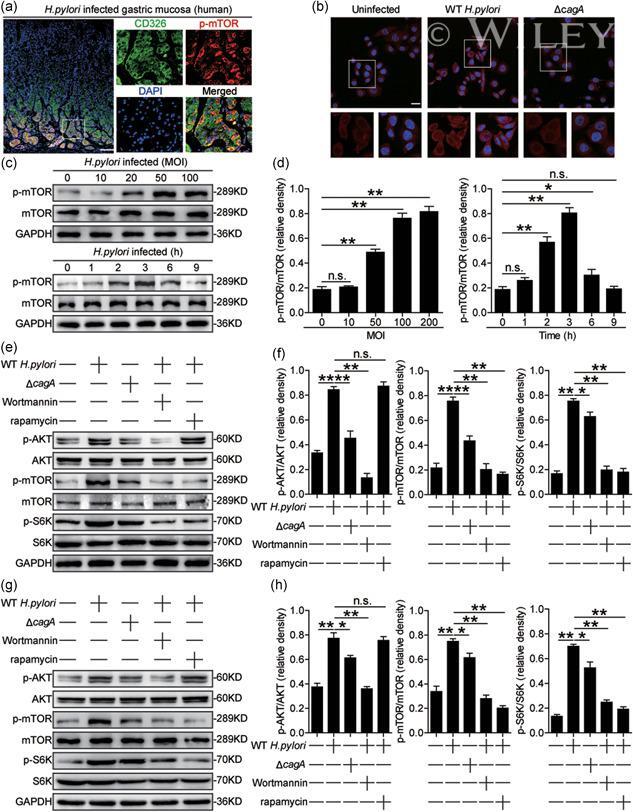
- 2 Figure H. pylori activate PI3K/AKT/mTOR/S6K pathway in gastric epithelial cells in a cagA -dependent manner. (a) Representative immunofluorescence staining images showing p-mTOR-expressing (red) CD326 + gastric epithelial cells (green) in gastric mucosa of H. pylori -infected patients. Scale bar = 100 um. (b) Representative immunofluorescence staining images showing p-mTOR expression in WT H. pylori -infected, DeltacagA -infected, and uninfected AGS cells. Red, p-mTOR; blue, DAPI-stained nuclei. Scale bar = 10 um. (c and d) Representative data (c) and statistical analysis (d) of p-mTOR and mTOR proteins in H. pylori -infected and uninfected AGS cells at a different time point (MOI = 100) or with different MOI (3 hr) analyzed by western blot were shown ( n = 3). (e and f) Representative data (e) and statistical analysis (f) of p-AKT and AKT proteins, p-mTOR and mTOR proteins, p-S6K and S6K proteins in WT H. pylori -infected, DeltacagA -infected, and uninfected AGS cells (MOI = 100, 3 hr) or in WT H. pylori -infected AGS cells (MOI = 100, 3 hr) pretreated with Wortmannin or rapamycin analyzed by western blot were shown ( n = 3). (e and f) Representative data (e) and statistical analysis (f) of p-AKT and AKT proteins, p-mTOR and mTOR proteins, p-S6K and S6K proteins in WT H. pylori -infected, DeltacagA -infected, and uninfected human primary gastric epithelial cells (MOI = 100, 3 hr) or in WT H. pylori -infected human primary gastric epithelial cells (MOI = 100, 3 hr) pretreat
- Submitted by
- Invitrogen Antibodies (provider)
- Main image

- Experimental details
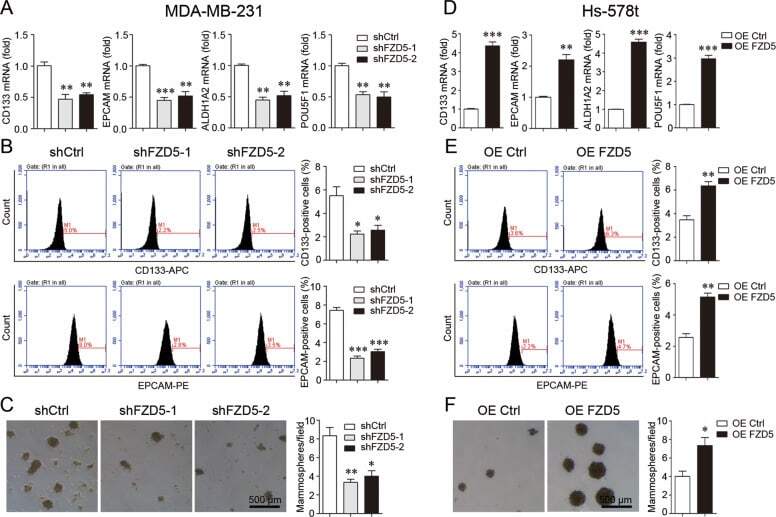
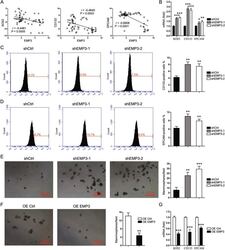
- Fig. 5 FZD5 maintains stem cell-like properties. A CD133, EPCAM, ALDH1A2, and POU5F1 expression in MDA-MB-231 cells was detected by real-time PCR. B Fractions of CD133-positive and EPCAM-positive MDA-MB-231 cells were detected by flow cytometry. C Mammosphere formation of MDA-MB-231 cells was shown. Scale bar: 500 mum, mean +- SD, n = 3. * P < 0.05, ** P < 0.01, *** P < 0.001, vs. shCtrl. D CD133, EPCAM, ALDH1A2, and POU5F1 expression in Hs-578t cells was detected by real-time PCR. E Fractions of CD133-positive and E PCAM-positive Hs-578t cells were detected by flow cytometry. F Mammosphere formation of Hs-578t cells was shown. Scale bar: 500 mum, mean +- SD, n = 3. * P < 0.05, ** P < 0.01, *** P < 0.001, vs. OE Ctrl.
- Submitted by
- Invitrogen Antibodies (provider)
- Main image

- Experimental details
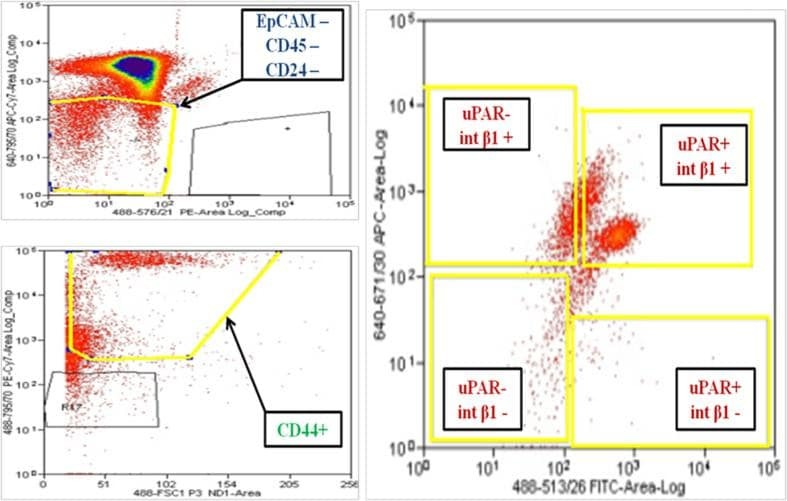
- Figure 1 Multiparametric flow cytometry of PBMCs capturing uPAR/int beta1 CTC subsets. Breast cancer PBMCs were first sorted applying gating parameters to select for DAPI - (4', 6-diamidino-2-phenylindole)/EpCAM - /CD45 - /CD44 + /CD24 - cells. Cells were then subsequently sorted to obtain uPAR/int beta1 subsets containing combinatorial expression of these markers. Antibodies used for flow cytometry and cell sorting were: anti-human CD45-APC-Cy7 (Biolegend, cat # 304015, 1:50 dilution), mouse anti-human EpCAM-PE CD326 (eBiosciences, cat # 12-9326-71, 1:40 dilution), anti-human CD24-PE ML5 (Biolegend, cat # 311106, 1:20 dilution), anti-human CD44-PE-Cy7 IM7 (Biolegend, cat # 103030, 1:20 dilution), mouse anti-human uPAR (CD87)-FITC (AbD Serotec cat # MCA2506FT, 1:10 dilution), anti-human int beta1 (CD29)-ApC TS2/16 (Biolegend, cat # 3030008, 1:50 dilution). Cells were confirmed to be CTCs by performing RT-PCR, immunoflurescence and genotyping arrays. Representative images are shown.
- Submitted by
- Invitrogen Antibodies (provider)
- Main image
- Experimental details
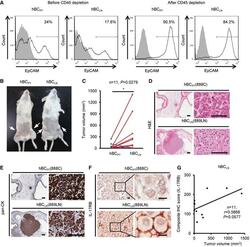
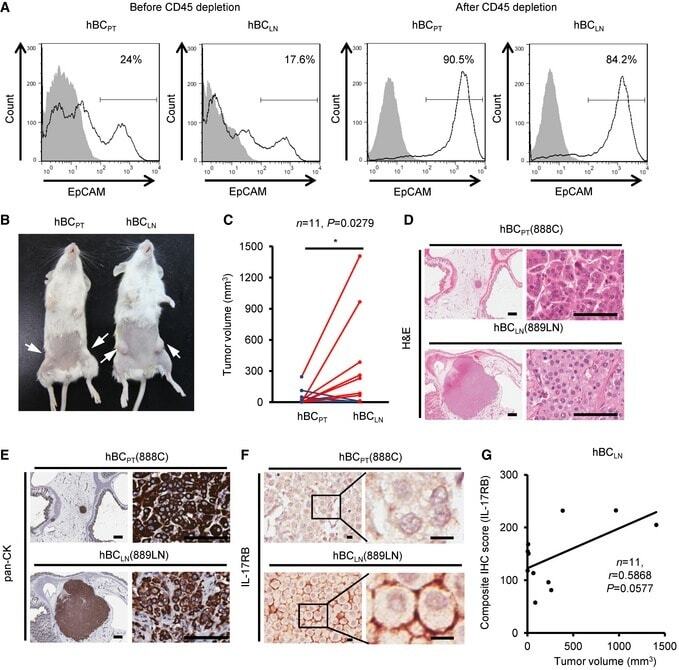
- Figure 8 Elevated IL-17RB expression in cancer cells derived from tumor-draining lymph nodes in breast cancer patients correlates with aggressive growth nature A Freshly collected human breast cancer (hBC) specimens (PT, primary tumors; LN, paired LN metastasis from the same breast cancer patient) were digested with collagenase-containing buffer overnight. Depletion of hematopoietic cells by CD45 Dynabeads (Invitrogen) enriched the EpCAM + cells for following xenografts. Percentages of EpCAM + cells in human primary breast cancer cells were confirmed by FACS analysis (left two panels: before enrichment; right two panels: after enrichment). All of the histograms were shown that they were EpCAM expressing (black line), compared to isotype control (gray filled). B Tumorigenesis assay was determined in NOD/SCID/IL2Rgamma mice orthotopically injected with hBC PT and hBC LN cells. Representative data on day 180 were shown. White arrow: Orthotopic injection site. C Dot plot illustrated the tumor volumes of hBC PT and hBC LN cell-injected NOD/SCID/IL2Rgamma mice on day 180 ( n = 11). All tumors were confirmed by pan-keratin IHC staining of fat pad sections. D, E H&E stainings and IHC stainings of pan-keratin were shown in the representative cases of fat pad sections from (B). Scale bar: 1 mm (left panels), 100 mum (right panels). F IHC stainings of IL-17RB were shown in the representative cases of fat pad sections from (B). Scale bar: 10 mum. G The correlatio
- Submitted by
- Invitrogen Antibodies (provider)
- Main image
- Experimental details
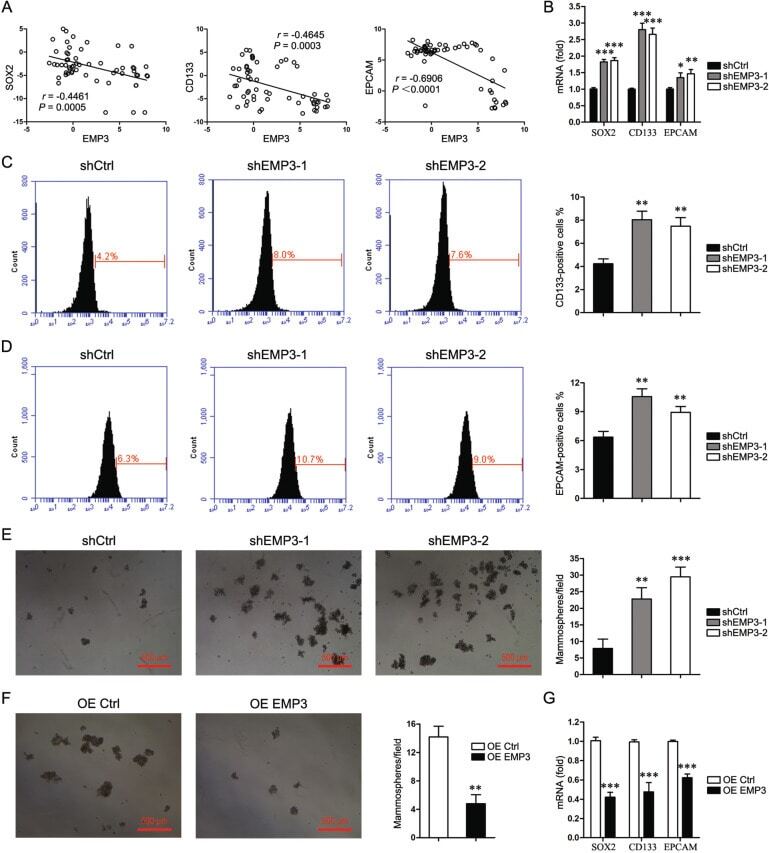
- Fig. 4 EMP3 interferes with stem-like properties. A CCLE database was interrogated for EMP3, SOX2, CD133, and EPCAM expression. Correlation between two genes in a total of 57 breast cancer cell lines was analyzed by Pearson statistics. B SOX2, CD133, and EPCAM expression in MDA-MB-231 cells were detected by real-time PCR. Mean +- SD, n = 3. * P < 0.05, ** P < 0.01, *** P < 0.001, vs. shCtrl. C Fractions of CD133-positive MDA-MB-231 cells were detected by flow cytometry. Mean +- SD, n = 3. ** P < 0.01, vs. shCtrl. D Fractions of EPCAM-positive MDA-MB-231 cells were detected by flow cytometry. Mean +- SD, n = 3. ** P < 0.01, vs. shCtrl. E Mammosphere formation of MDA-MB-231 cells was shown. Mean +- SD, n = 3. ** P < 0.01, *** P < 0.001, vs. shCtrl. F Mammosphere formation of MCF7 cells was shown. Mean +- SD, n = 3. ** P < 0.01, vs. OE Ctrl. G SOX2, CD133, and EPCAM expression in MCF7 cells were detected by real-time PCR. Mean +- SD, n = 3. *** P < 0.001, vs. OE Ctrl.
- Submitted by
- Invitrogen Antibodies (provider)
- Main image

- Experimental details
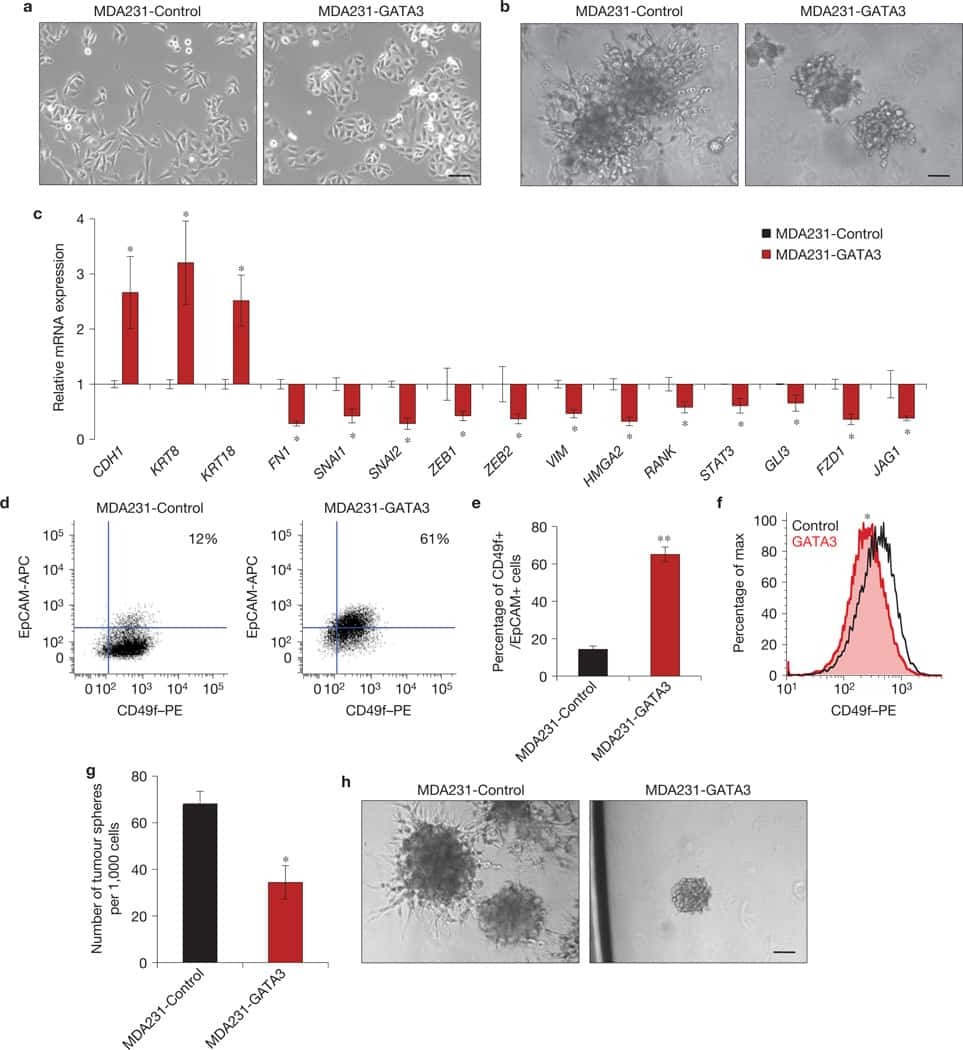
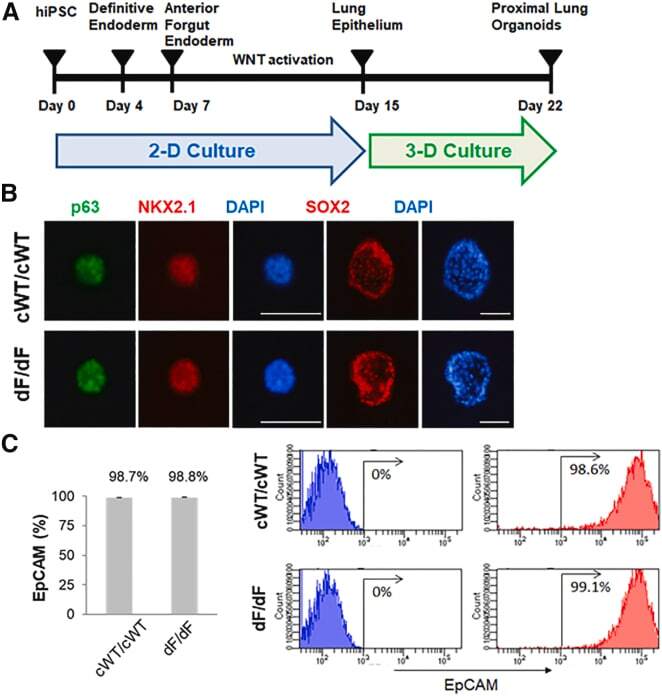
- Figure 1 Generation of proximal lung organoids from cystic fibrosis patient iPSCs (A) Schematic representation of lung organoid differentiation protocol from human iPSCs (hiPSCs). (B) Representative immunofluorescence staining for p63 (green), NKX2.1 (red), SOX2 (red), and nuclear protein expression with DNA stain (DAPI; blue) in HLOs on day 20 (p63 and NKX2.1) and day 22 (SOX2). Scale bars represent 100 mum. (C) Flow cytometry analysis of EpCAM expression in organoid cells on day 23. Left: summary percentage of EpCAM-positive cells. Three independent HLO plates were used for the experiment. Data are presented as mean +- standard error of the mean (SEM). Right: a representative flow cytometry result. The x axis indicates the count of cells, and the y axis indicates EpCAM signal level.
- Submitted by
- Invitrogen Antibodies (provider)
- Main image
- Experimental details
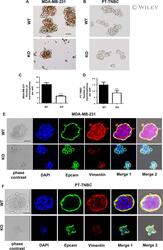
- 4 Fig Pthlh ablation inhibits mammosphere formation capacity in MBA-MB-231 and PT-TNBC cells. Bright field microscopy of primary mammospheres from MDA-MB-231 ( A ) and PT-TNBC ( B ) Pthlh WT (empty vector, top) and Pthlh KO cells (below). Mammosphere counts per well for MDA-MB-231 ( C ) and PT-TNBC ( D ). ( n = 22, p < 0.0001). EpCAM and vimentin IF staining in mammospheres from Pthlh WT and Pthlh KO cells for MDA-MB-231 ( E ) and PT-TNBC ( F ). DAPI: blue; EpCAM: green; vimentin: red. Scale bars = 100 mum.
- Submitted by
- Invitrogen Antibodies (provider)
- Main image

- Experimental details
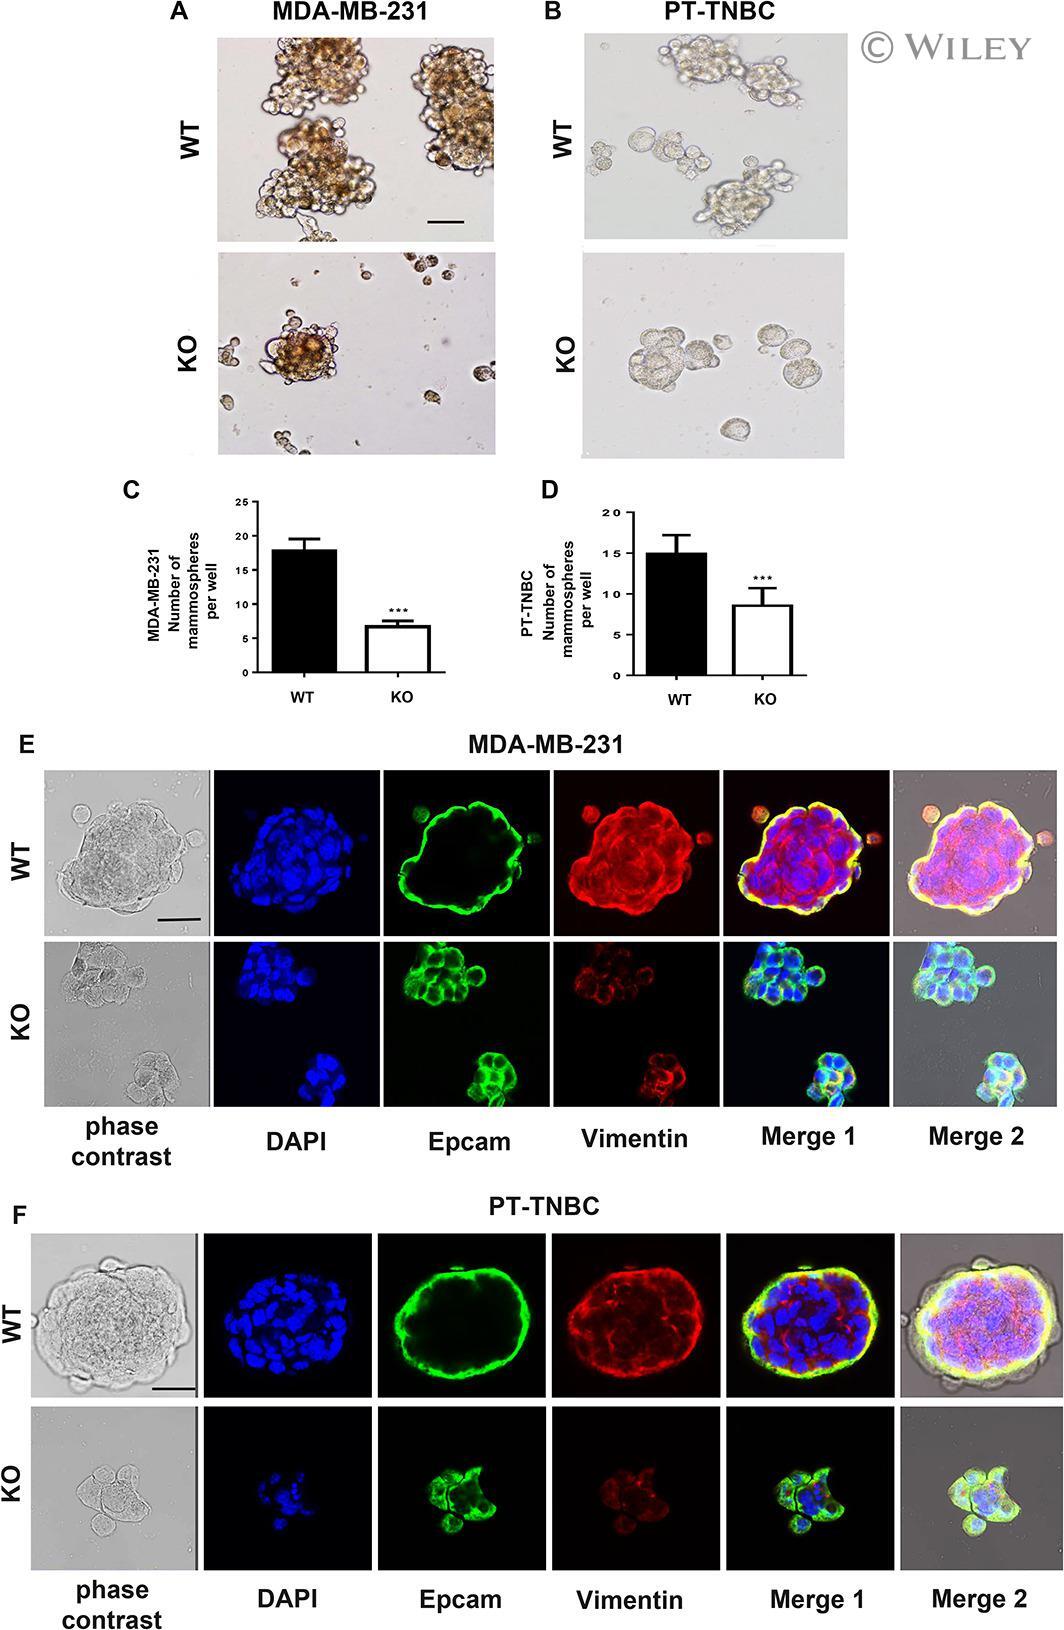
- Fig. 1 Identification of three major epithelial cell types and their markers using scRNAseq. a Overview of scRNAseq approach using primary human breast tissue samples that were processed into single cell suspension, followed by FACS isolation of basal (CD49f-hi, EPCAM+) and luminal (CD49f+, EPCAM-hi), and scRNAseq analysis using the microfluidics-enabled scRNAseq. b Combined tSNE projection of cells from all three microfluidics-enabled scRNAseq datasets. The major basal cluster is highlighted in red; Luminal1 (L1) in green; Luminal2 (L2) in blue. c Heatmap displaying the scaled expression patterns of top marker genes within each cell type with selected marker genes highlighted; yellow indicating high expression of a particular gene, and purple indicating low expression. d Feature plots showing the scaled expression of TCF4 and ZEB1 marking a subpopulation of basal cells and gene plot showing co-expression of TCF4 and ZEB1 in the same cells. See Supplementary Fig. 1 capture site imaging, gene detection, individual principal component analysis, tSNE plot colored by individual-derived cells and feature plots of cell type-specific markers
- Submitted by
- Invitrogen Antibodies (provider)
- Main image
- Experimental details
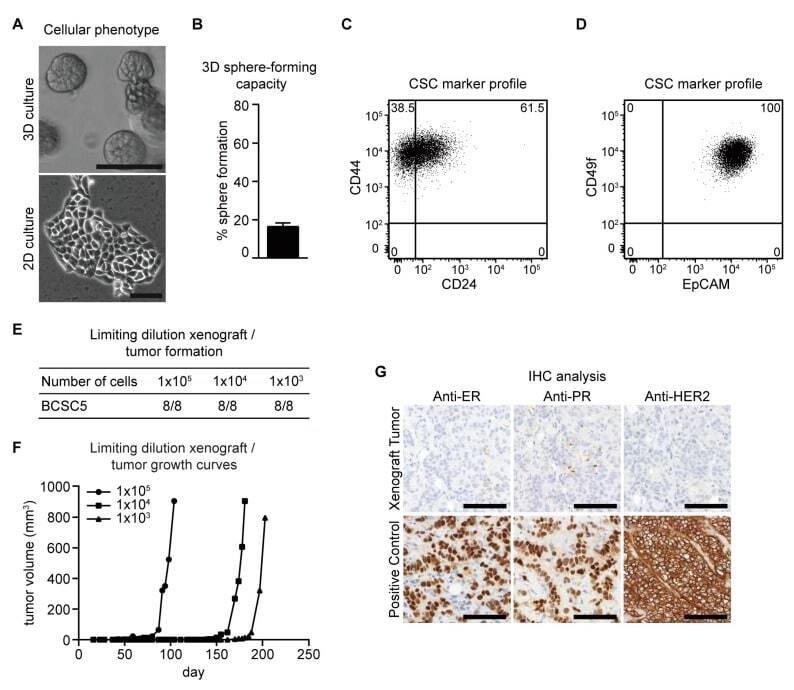
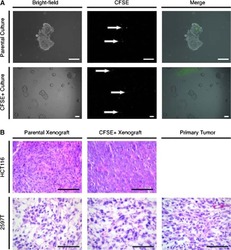
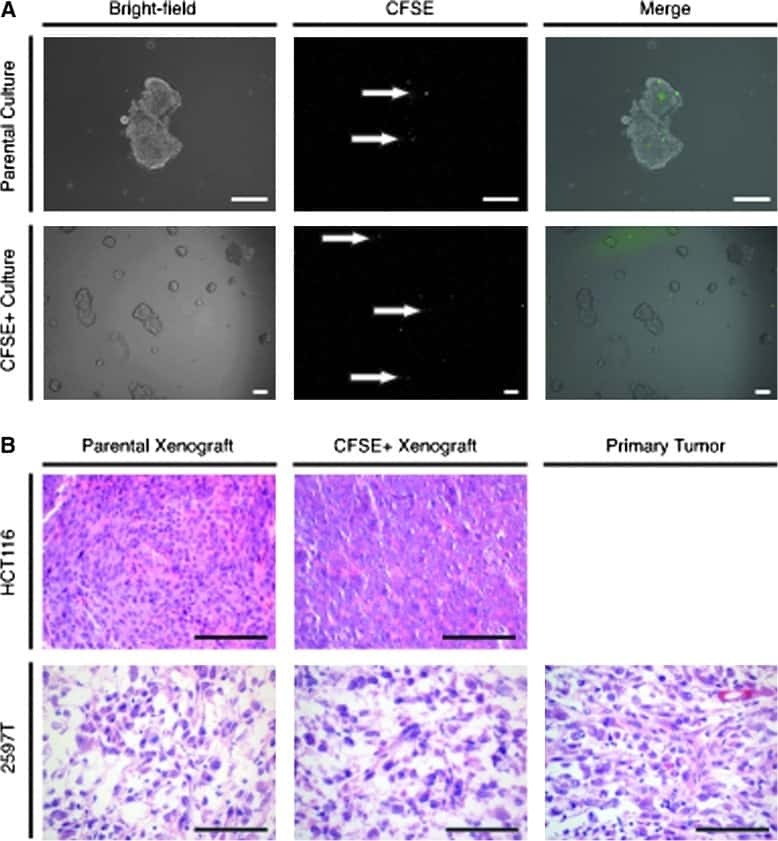
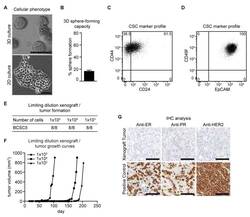
- Figure 1 Characterization of BCSC5 in vitro and in vivo. ( A ) Representative pictures of BCSC5 cultured in 3D and 2D conditions, scale bar 100 mum. ( B ) Sphere-forming capacity of BCSC5 cells in an anchorage-independent growth assay ( n = 3). Data represent means + SEM. ( C , D ) Expression patterns of CD24 and CD44 ( C ) as well as EpCAM and CD49f ( D ) in BCSC5 cells analyzed by flow cytometry. ( E ) Tumor formation in limiting dilution xenografts of BCSC5. ( F ) Representative growth curves for limiting dilution assay of BCSC5 xenografts in immunocompromised NOD/SCID mice. ( G ) Immunohistochemical (IHC) analysis of ER, PR, and HER2 on sections of the BCSC5 xenograft tumors, scale bar 100 mum.