Explore
 Validate
 Learn
LearnMA5-12436
antibody from Invitrogen Antibodies
Targeting: EPCAM
17-1A, 323/A3, CD326, CO-17A, EGP-2, EGP34, EGP40, Ep-CAM, ESA, GA733-2, HEA125, KS1/4, KSA, Ly74, M4S1, MH99, MIC18, MK-1, MOC31, TACST-1, TACSTD1, TROP1
 Immunocytochemistry
 Radioimmunoassay
Antibody data
- Antibody Data
- Antigen structure
- References [16]
- Comments [0]
- Validations
- Immunocytochemistry [4]
- Immunohistochemistry [1]
- Flow cytometry [6]
- Other assay [6]
Submit
Validation data
Reference
Comment
Report error
- Product number
- MA5-12436 - Provider product page

- Provider
- Invitrogen Antibodies
- Product name
- EpCAM Monoclonal Antibody (323/A3)
- Antibody type
- Monoclonal
- Antigen
- Other
- Description
- MA5-12436 targets Epithelial Specific Antigen in FACS, ICC/IF, IHC (P), and RIA applications and shows reactivity with Human and Mouse samples. The MA5-12436 immunogen is mCF-7 human breast cancer cells.
- Reactivity
- Human, Mouse
- Host
- Mouse
- Isotype
- IgG
- Antibody clone number
- 323/A3
- Vial size
- 500 μL
- Concentration
- 0.2 mg/mL
- Storage
- 4°C
Submitted references KRAS and EGFR Mutations Differentially Alter ABC Drug Transporter Expression in Cisplatin-Resistant Non-Small Cell Lung Cancer.
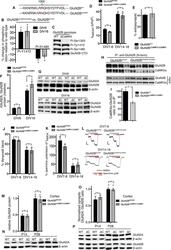
Contribution of TRESK two-pore domain potassium channel to bone cancer-induced spontaneous pain and evoked cutaneous pain in rats.
Intra-Amniotic Infection with Ureaplasma parvum Causes Preterm Birth and Neonatal Mortality That Are Prevented by Treatment with Clarithromycin.
ROCK2 inhibition triggers the collective invasion of colorectal adenocarcinomas.
Human Fetal-Derived Enterospheres Provide Insights on Intestinal Development and a Novel Model to Study Necrotizing Enterocolitis (NEC).
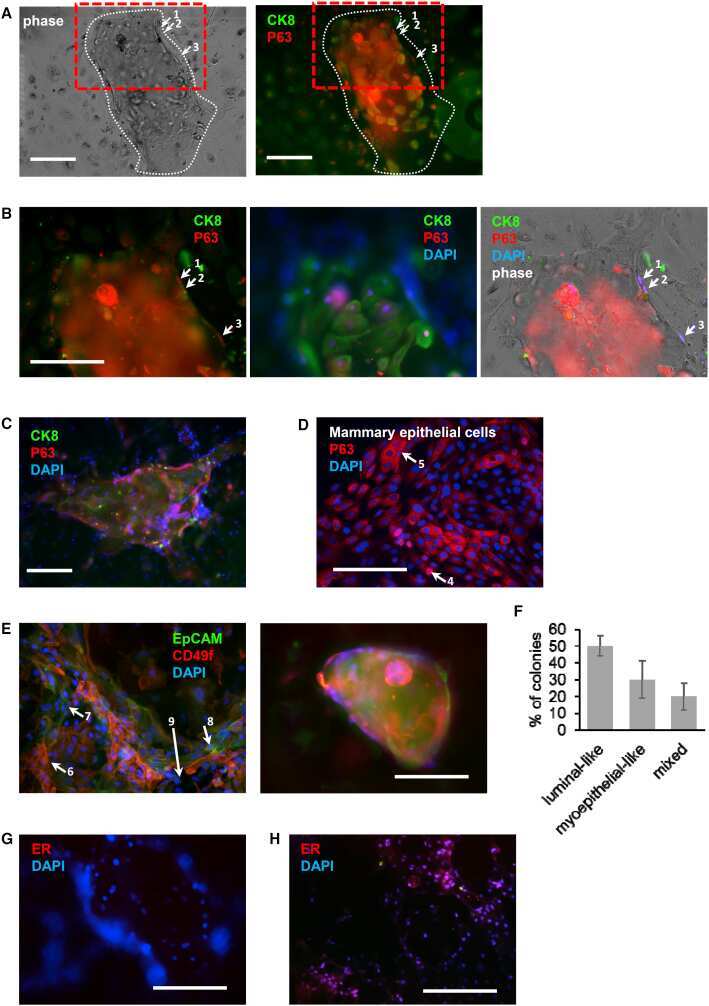
Differentiation of Human Induced Pluripotent Stem Cells to Mammary-like Organoids.
A 3D in vitro model of the human breast duct: a method to unravel myoepithelial-luminal interactions in the progression of breast cancer.
Interpolation method for accurate affinity ranking of arrayed ligand-analyte interactions.
Co-existence of epithelioid and fibroblastoid subsets in a sarcomatoid renal carcinoma cell line revealed by clonal studies.
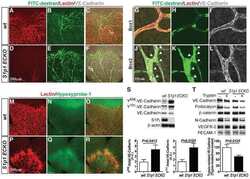
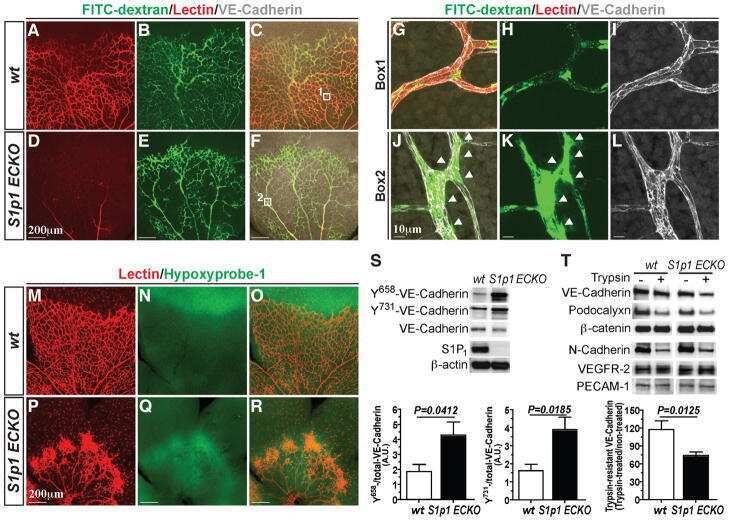
Flow-regulated endothelial S1P receptor-1 signaling sustains vascular development.
Enrichment of circulating tumor cells from a large blood volume using leukapheresis and elutriation: proof of concept.
Molecular events associated with epithelial to mesenchymal transition of nasopharyngeal carcinoma cells in the absence of Epstein-Barr virus genome.
Overexpression of epithelial cell adhesion molecule in primary, metastatic, and recurrent/chemotherapy-resistant epithelial ovarian cancer: implications for epithelial cell adhesion molecule-specific immunotherapy.
EpCAM-specific vaccine response by modified antigen and chimeric costimulatory molecule in cynomolgus monkeys.
Inhibition of proliferation by PERK regulates mammary acinar morphogenesis and tumor formation.
Genetic vaccines against Ep-CAM break tolerance to self in a limited subset of subjects: initial identification of predictive biomarkers.
Jaromi L, Csongei V, Vesel M, Abdelwahab EMM, Soltani A, Torok Z, Smuk G, Sarosi V, Pongracz JE
International journal of molecular sciences 2021 May 20;22(10)
International journal of molecular sciences 2021 May 20;22(10)
Contribution of TRESK two-pore domain potassium channel to bone cancer-induced spontaneous pain and evoked cutaneous pain in rats.
Liu JP, Jing HB, Xi K, Zhang ZX, Jin ZR, Cai SQ, Tian Y, Cai J, Xing GG
Molecular pain 2021 Jan-Dec;17:17448069211023230
Molecular pain 2021 Jan-Dec;17:17448069211023230
Intra-Amniotic Infection with Ureaplasma parvum Causes Preterm Birth and Neonatal Mortality That Are Prevented by Treatment with Clarithromycin.
Motomura K, Romero R, Xu Y, Theis KR, Galaz J, Winters AD, Slutsky R, Garcia-Flores V, Zou C, Levenson D, Para R, Ahmad MM, Miller D, Hsu CD, Gomez-Lopez N
mBio 2020 Jun 23;11(3)
mBio 2020 Jun 23;11(3)
ROCK2 inhibition triggers the collective invasion of colorectal adenocarcinomas.
Libanje F, Raingeaud J, Luan R, Thomas Z, Zajac O, Veiga J, Marisa L, Adam J, Boige V, Malka D, Goéré D, Hall A, Soazec JY, Prall F, Gelli M, Dartigues P, Jaulin F
The EMBO journal 2019 Jul 15;38(14):e99299
The EMBO journal 2019 Jul 15;38(14):e99299
Human Fetal-Derived Enterospheres Provide Insights on Intestinal Development and a Novel Model to Study Necrotizing Enterocolitis (NEC).
Senger S, Ingano L, Freire R, Anselmo A, Zhu W, Sadreyev R, Walker WA, Fasano A
Cellular and molecular gastroenterology and hepatology 2018;5(4):549-568
Cellular and molecular gastroenterology and hepatology 2018;5(4):549-568
Differentiation of Human Induced Pluripotent Stem Cells to Mammary-like Organoids.
Qu Y, Han B, Gao B, Bose S, Gong Y, Wawrowsky K, Giuliano AE, Sareen D, Cui X
Stem cell reports 2017 Feb 14;8(2):205-215
Stem cell reports 2017 Feb 14;8(2):205-215
A 3D in vitro model of the human breast duct: a method to unravel myoepithelial-luminal interactions in the progression of breast cancer.
Carter EP, Gopsill JA, Gomm JJ, Jones JL, Grose RP
Breast cancer research : BCR 2017 Apr 21;19(1):50
Breast cancer research : BCR 2017 Apr 21;19(1):50
Interpolation method for accurate affinity ranking of arrayed ligand-analyte interactions.
Schasfoort RB, Andree KC, van der Velde N, van der Kooi A, Stojanović I, Terstappen LW
Analytical biochemistry 2016 May 1;500:21-3
Analytical biochemistry 2016 May 1;500:21-3
Co-existence of epithelioid and fibroblastoid subsets in a sarcomatoid renal carcinoma cell line revealed by clonal studies.
Hsieh CH, Chen HC, Chang YH, Pang ST, Kuo ML, Chuang CK, Liao SK
Anticancer research 2013 Nov;33(11):4875-89
Anticancer research 2013 Nov;33(11):4875-89
Flow-regulated endothelial S1P receptor-1 signaling sustains vascular development.
Jung B, Obinata H, Galvani S, Mendelson K, Ding BS, Skoura A, Kinzel B, Brinkmann V, Rafii S, Evans T, Hla T
Developmental cell 2012 Sep 11;23(3):600-10
Developmental cell 2012 Sep 11;23(3):600-10
Enrichment of circulating tumor cells from a large blood volume using leukapheresis and elutriation: proof of concept.
Eifler RL, Lind J, Falkenhagen D, Weber V, Fischer MB, Zeillinger R
Cytometry. Part B, Clinical cytometry 2011 Mar;80(2):100-11
Cytometry. Part B, Clinical cytometry 2011 Mar;80(2):100-11
Molecular events associated with epithelial to mesenchymal transition of nasopharyngeal carcinoma cells in the absence of Epstein-Barr virus genome.
Lin JC, Liao SK, Lee EH, Hung MS, Sayion Y, Chen HC, Kang CC, Huang LS, Cherng JM
Journal of biomedical science 2009 Nov 24;16:105
Journal of biomedical science 2009 Nov 24;16:105
Overexpression of epithelial cell adhesion molecule in primary, metastatic, and recurrent/chemotherapy-resistant epithelial ovarian cancer: implications for epithelial cell adhesion molecule-specific immunotherapy.
Bellone S, Siegel ER, Cocco E, Cargnelutti M, Silasi DA, Azodi M, Schwartz PE, Rutherford TJ, Pecorelli S, Santin AD
International journal of gynecological cancer : official journal of the International Gynecological Cancer Society 2009 Jul;19(5):860-6
International journal of gynecological cancer : official journal of the International Gynecological Cancer Society 2009 Jul;19(5):860-6
EpCAM-specific vaccine response by modified antigen and chimeric costimulatory molecule in cynomolgus monkeys.
Neighbors M, Apt D, Chang JC, Brinkman A, Sipos-Solman I, Ong R, Leong S, Punnonen J
Journal of immunotherapy (Hagerstown, Md. : 1997) 2008 Sep;31(7):644-55
Journal of immunotherapy (Hagerstown, Md. : 1997) 2008 Sep;31(7):644-55
Inhibition of proliferation by PERK regulates mammary acinar morphogenesis and tumor formation.
Sequeira SJ, Ranganathan AC, Adam AP, Iglesias BV, Farias EF, Aguirre-Ghiso JA
PloS one 2007 Jul 18;2(7):e615
PloS one 2007 Jul 18;2(7):e615
Genetic vaccines against Ep-CAM break tolerance to self in a limited subset of subjects: initial identification of predictive biomarkers.
Elia L, Mennuni C, Storto M, Podda S, Calvaruso F, Salucci V, Aurisicchio L, Scarito A, Ciliberto G, La Monica N, Palombo F
European journal of immunology 2006 May;36(5):1337-49
European journal of immunology 2006 May;36(5):1337-49
No comments: Submit comment
Supportive validation
- Submitted by
- Invitrogen Antibodies (provider)
- Main image

- Experimental details
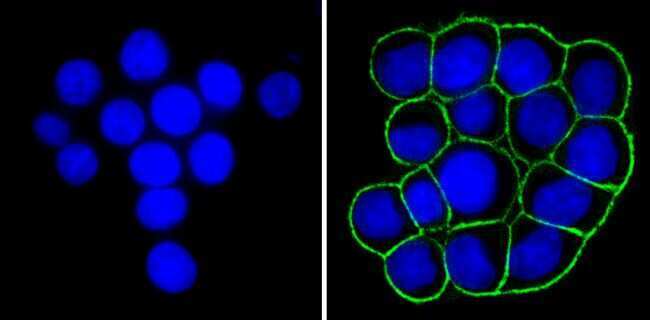
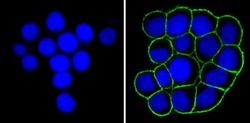
- Immunofluorescent analysis of Epithelial Specific Antigen (green) showing staining in the membrane of HT29 cells (right) compared to a negative control without primary antibody (left). Formalin-fixed cells were permeabilized with 0.1% Triton X-100 in TBS for 5-10 minutes and blocked with 3% BSA-PBS for 30 minutes at room temperature. Cells were probed with an Epithelial Specific Antigen monoclonal antibody (Product # MA5-12436) in 3% BSA-PBS at a dilution of 1:100 and incubated overnight at 4 ºC in a humidified chamber. Cells were washed with PBST and incubated with a DyLight-conjugated secondary antibody in PBS at room temperature in the dark. F-actin (red) was stained with a fluorescent red phalloidin and nuclei (blue) were stained with Hoechst or DAPI. Images were taken at a magnification of 100x.
- Submitted by
- Invitrogen Antibodies (provider)
- Main image

- Experimental details
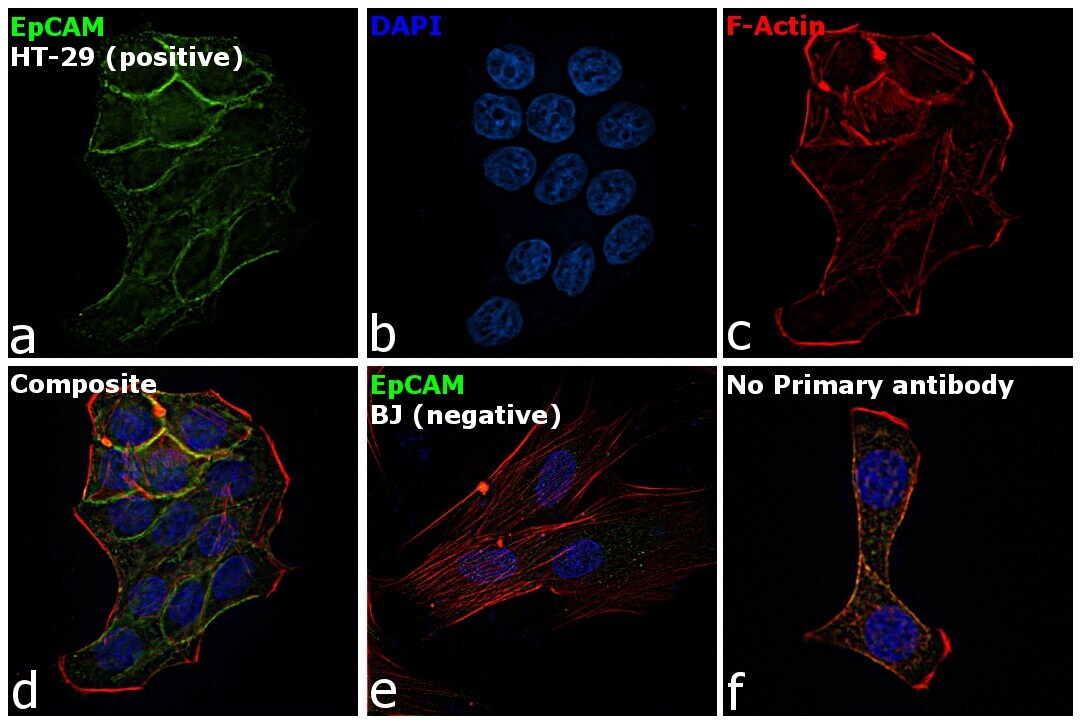
- Immunofluorescence analysis of EpCAM was performed using HT-29 and BJ cells. The cells were fixed with 4% paraformaldehyde for 10 minutes, permeabilized with 0.1% Triton™ X-100 for 15 minutes, and blocked with 2% BSA for 1 hour at room temperature. The cells were labeled with EpCAM Mouse Monoclonal Antibody (Product # MA5-12436) at 1:100 dilution in 0.1% BSA and incubated overnight at 4 degree and then labeled with Goat anti-Mouse IgG (H+L) Superclonal™ Recombinant Secondary Antibody, Alexa Fluor® 488 (Product # A28175) at a dilution of 1:2000 for 45 minutes at room temperature (Panel a: green) in HT-29 cells. Nuclei (Panel b: blue) were stained with ProLong™ Diamond Antifade Mountant with DAPI (Product # P36962). F-actin (Panel c: red) was stained with Rhodamine Phalloidin (Product # R415, 1:300). Panel d represents the merged image of HT-29 cells, which is a positive model for EpCAM expression showing a plasma membrane localization. Panel e represents the merged image of BJ cells, that are null for EpCAM protein expression. Panel f represents control cells with no primary antibody to assess background. The images were captured at 60X magnification.

- Submitted by
- Invitrogen Antibodies (provider)
- Main image
- Experimental details
- Immunofluorescent analysis of Epithelial Specific Antigen (green) showing staining in the membrane of HT29 cells (right) compared to a negative control without primary antibody (left). Formalin-fixed cells were permeabilized with 0.1% Triton X-100 in TBS for 5-10 minutes and blocked with 3% BSA-PBS for 30 minutes at room temperature. Cells were probed with an Epithelial Specific Antigen monoclonal antibody (Product # MA5-12436) in 3% BSA-PBS at a dilution of 1:100 and incubated overnight at 4 ºC in a humidified chamber. Cells were washed with PBST and incubated with a DyLight-conjugated secondary antibody in PBS at room temperature in the dark. F-actin (red) was stained with a fluorescent red phalloidin and nuclei (blue) were stained with Hoechst or DAPI. Images were taken at a magnification of 100x.

- Submitted by
- Invitrogen Antibodies (provider)
- Main image

- Experimental details
- Immunofluorescence analysis of EpCAM was performed using HT-29 and BJ cells. The cells were fixed with 4% paraformaldehyde for 10 minutes, permeabilized with 0.1% Triton™ X-100 for 15 minutes, and blocked with 2% BSA for 1 hour at room temperature. The cells were labeled with EpCAM Mouse Monoclonal Antibody (Product # MA5-12436) at 1:100 dilution in 0.1% BSA and incubated overnight at 4 degree and then labeled with Goat anti-Mouse IgG (H+L) Superclonal™ Recombinant Secondary Antibody, Alexa Fluor® 488 (Product # A28175) at a dilution of 1:2000 for 45 minutes at room temperature (Panel a: green) in HT-29 cells. Nuclei (Panel b: blue) were stained with ProLong™ Diamond Antifade Mountant with DAPI (Product # P36962). F-actin (Panel c: red) was stained with Rhodamine Phalloidin (Product # R415, 1:300). Panel d represents the merged image of HT-29 cells, which is a positive model for EpCAM expression showing a plasma membrane localization. Panel e represents the merged image of BJ cells, that are null for EpCAM protein expression. Panel f represents control cells with no primary antibody to assess background. The images were captured at 60X magnification.
Supportive validation
- Submitted by
- Invitrogen Antibodies (provider)
- Main image

- Experimental details
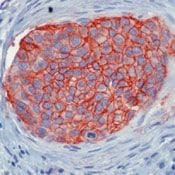
- Formalin-fixed, paraffin-embedded human breast carcinoma stained with ESA antibody using peroxidase-conjugate and AEC chromogen. Note cell membrane staining of tumor cells.
Supportive validation
- Submitted by
- Invitrogen Antibodies (provider)
- Main image

- Experimental details
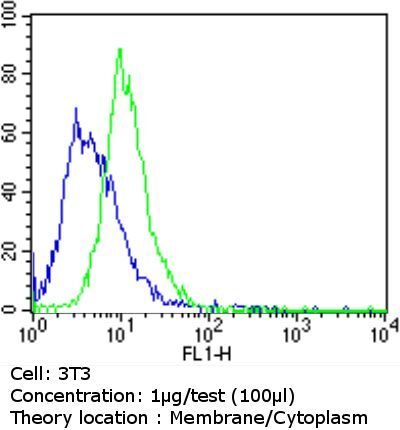
- Flow cytometry analysis of Epithelial Specific Antigen in NIH/3T3 cells compared to an isotype control (blue). Cells were harvested, adjusted to a concentration of 1-5x10^6 cells/mL, fixed with 2% paraformaldehyde and washed with PBS. Cells were blocked with a 2% solution of BSA-PBS for 30 min at room temperature and incubated with a Epithelial Specific Antigen monoclonal antibody (Product # MA5-12436) at a dilution of 1 µg/test for 60 min at room temperature. Cells were then incubated for 40 min at room temperature in the dark using a Dylight 488-conjugated goat anti-mouse IgG (H+L) secondary antibody and re-suspended in PBS for FACS analysis.

- Submitted by
- Invitrogen Antibodies (provider)
- Main image
- Experimental details
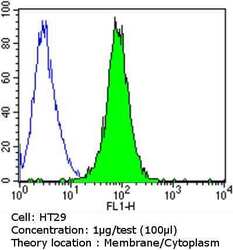
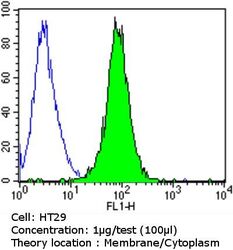
- Flow cytometry analysis of Epithelial Specific Antigen in HT29 cells compared to an isotype control (blue). Cells were harvested, adjusted to a concentration of 1-5x10^6 cells/mL, fixed with 2% paraformaldehyde and washed with PBS. Cells were blocked with a 2% solution of BSA-PBS for 30 min at room temperature and incubated with a Epithelial Specific Antigen monoclonal antibody (Product # MA5-12436) at a dilution of 1 µg/test for 60 min at room temperature. Cells were then incubated for 40 min at room temperature in the dark using a Dylight 488-conjugated goat anti-mouse IgG (H+L) secondary antibody and re-suspended in PBS for FACS analysis.
- Submitted by
- Invitrogen Antibodies (provider)
- Main image
- Experimental details
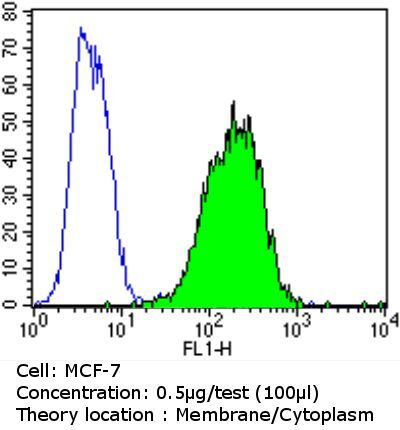
- Flow cytometry analysis of Epithelial Specific Antigen in MCF-7 cells compared to an isotype control (blue). Cells were harvested, adjusted to a concentration of 1-5x10^6 cells/mL, fixed with 2% paraformaldehyde and washed with PBS. Cells were blocked with a 2% solution of BSA-PBS for 30 min at room temperature and incubated with a Epithelial Specific Antigen monoclonal antibody (Product # MA5-12436) at a dilution of 0.5 µg/test for 60 min at room temperature. Cells were then incubated for 40 min at room temperature in the dark using a Dylight 488-conjugated goat anti-mouse IgG (H+L) secondary antibody and re-suspended in PBS for FACS analysis.

- Submitted by
- Invitrogen Antibodies (provider)
- Main image
- Experimental details
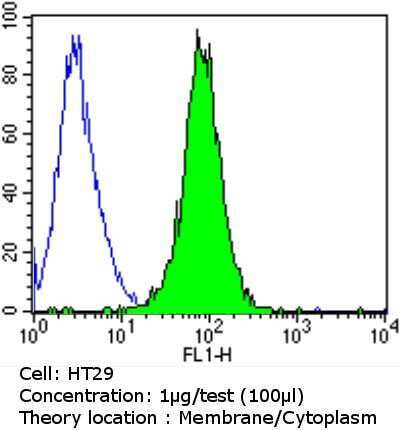
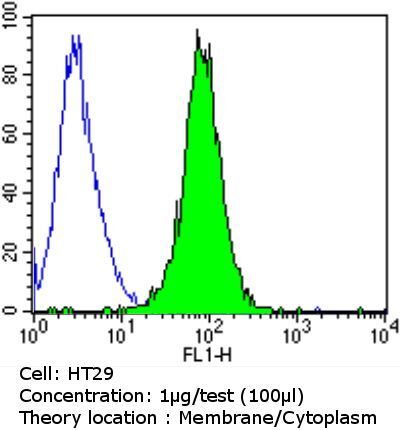
- Flow cytometry analysis of Epithelial Specific Antigen in HT29 cells compared to an isotype control (blue). Cells were harvested, adjusted to a concentration of 1-5x10^6 cells/mL, fixed with 2% paraformaldehyde and washed with PBS. Cells were blocked with a 2% solution of BSA-PBS for 30 min at room temperature and incubated with a Epithelial Specific Antigen monoclonal antibody (Product # MA5-12436) at a dilution of 1 µg/test for 60 min at room temperature. Cells were then incubated for 40 min at room temperature in the dark using a Dylight 488-conjugated goat anti-mouse IgG (H+L) secondary antibody and re-suspended in PBS for FACS analysis.
- Submitted by
- Invitrogen Antibodies (provider)
- Main image

- Experimental details
- Flow cytometry analysis of Epithelial Specific Antigen in NIH/3T3 cells compared to an isotype control (blue). Cells were harvested, adjusted to a concentration of 1-5x10^6 cells/mL, fixed with 2% paraformaldehyde and washed with PBS. Cells were blocked with a 2% solution of BSA-PBS for 30 min at room temperature and incubated with a Epithelial Specific Antigen monoclonal antibody (Product # MA5-12436) at a dilution of 1 µg/test for 60 min at room temperature. Cells were then incubated for 40 min at room temperature in the dark using a Dylight 488-conjugated goat anti-mouse IgG (H+L) secondary antibody and re-suspended in PBS for FACS analysis.
- Submitted by
- Invitrogen Antibodies (provider)
- Main image

- Experimental details
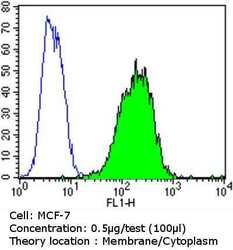
- Flow cytometry analysis of Epithelial Specific Antigen in MCF-7 cells compared to an isotype control (blue). Cells were harvested, adjusted to a concentration of 1-5x10^6 cells/mL, fixed with 2% paraformaldehyde and washed with PBS. Cells were blocked with a 2% solution of BSA-PBS for 30 min at room temperature and incubated with a Epithelial Specific Antigen monoclonal antibody (Product # MA5-12436) at a dilution of 0.5 µg/test for 60 min at room temperature. Cells were then incubated for 40 min at room temperature in the dark using a Dylight 488-conjugated goat anti-mouse IgG (H+L) secondary antibody and re-suspended in PBS for FACS analysis.
Supportive validation
- Submitted by
- Invitrogen Antibodies (provider)
- Main image

- Experimental details
- NULL
- Submitted by
- Invitrogen Antibodies (provider)
- Main image
- Experimental details
- NULL
- Submitted by
- Invitrogen Antibodies (provider)
- Main image
- Experimental details
- Figure 1 Establishing human FEnS repository. ( A ) Growth of F14 and F21.5 enterospheres was evaluated in different media conditions to establish a minimum growth factor requirement. The same number of cells (50,000/mL) were seeded. Enteroids were counted after 5 days of culture. Standard DMEM/F12 media was supplemented with N2, B27, acetyl cysteine, gastrin, and PGE2 (see the Materials and Methods section for more detail), and the following were supplemented as labeled in the figure: E, EGF (50 ng/mL); N, noggin (100 ng/mL); W, wingless-type MMTV integration site family gene (WNT) 3A (100 ng/mL); R, R-spo1 (1 mug/mL); and DKK, Dickkopf-related protein-1, WNT inhibitor (50 ng/mL). Multiple comparison analysis was performed adopting the 1-way analysis of variance test: **** P < .0001. ( B ) AEnS and FEnS were cultured in standard growing media or by adding 5 mumol/L N-[(3,5-Difluorophenyl)acetyl]-L-alanyl-2-phenyl]glycine-1,1-dimethylethyl ester in DMEM/F12 for 48 hours to promote cell differentiation. Sucrase isomaltase gene expression was evaluated for monitoring enterocyte differentiation. The DeltaDeltaCT method was used to calculate fold-change in quantitative PCR analysis ( t test, * P < .05). ( C ) Gene expression of PTGER4 and ( D ) CLDN4 was evaluated by quantitative RT-PCR in adult duodenum-derived enterospheres (AD11, AD14, and AD15) cultured with or without PGE2. Fold-change refers to gene expression in no-PGE2 samples and was calculated by applying the DeltaDe
- Submitted by
- Invitrogen Antibodies (provider)
- Main image
- Experimental details
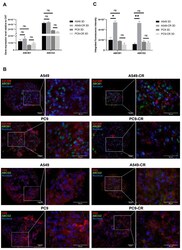
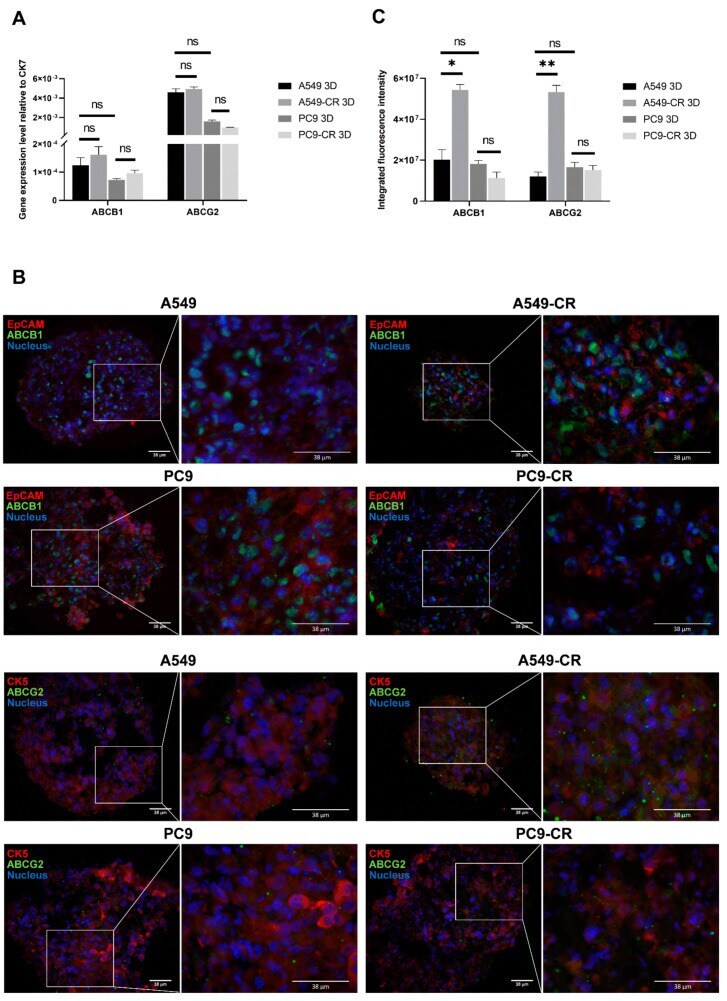
- Figure 4 Mimicking cell composition of the human lung tissue. ( A ) Relative mRNA expression (2 -ddCt ) of ABCB1 and ABCG2 drug transporters in parental (A549, PC9) and cisplatin-resistant AC cell line (A549-CR, PC9-CR) containing 3D aggregate co-cultures. The inner control was CK7. Biological repeats n = 3. ( B ) 3D aggregate tissue sections were stained with anti-ABCB1 or anti-ABCG2 specific primary antibodies, respectively (green), while EpCAM and CK5 were stained with specific antibodies (red) and nuclei were stained with DAPI (blue). The staining shows a representative of 3 independent experiments. ( C ) Densitometry of ABCB1 and ABCG2 proteins in A549, A549-CR and PC9, PC9-CR containing aggregate co-cultures. Drug transporter protein intensity quantification was normalized to the respective epithelial marker intensity. (""*"" p < 0.05 and ""**"" p < 0.002).
- Submitted by
- Invitrogen Antibodies (provider)
- Main image
- Experimental details
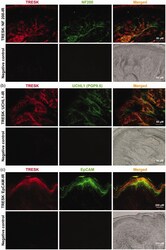
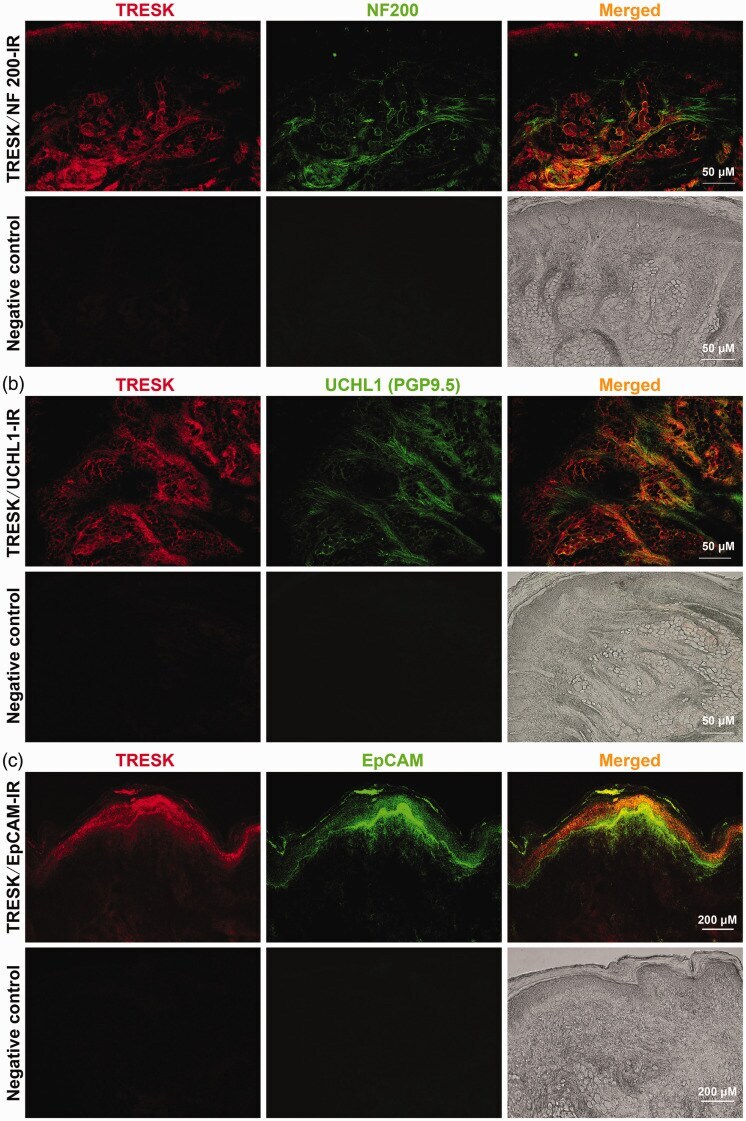
- Figure 2. Double immunofluorescent staining of TRESK with NF200, UCHL1 (PGP9.5), and EpCAM in the hindpaw skin of rats. (a) Representative images of immunofluorescence staining with TRESK (red) and NF200 (the large nerve fiber marker, green) are shown (upper). Lower, negative controls omitting the primary antibody. (b) Representative images of immunofluorescence staining with TRESK (red) and UCHL1 (PGP9.5) (the small nerve fiber marker, green) are shown (upper). Lower, negative controls omitting the primary antibody. (c) Representative images of immunofluorescence staining with TRESK (red) and EpCAM (the epidermal cell marker, green) are shown (upper). Lower, negative controls omitting the primary antibody. Scale bar = 50 um for (a) and (b), Scale bar = 200 um for (c), n = 3 independent experiments.
- Submitted by
- Invitrogen Antibodies (provider)
- Main image

- Experimental details
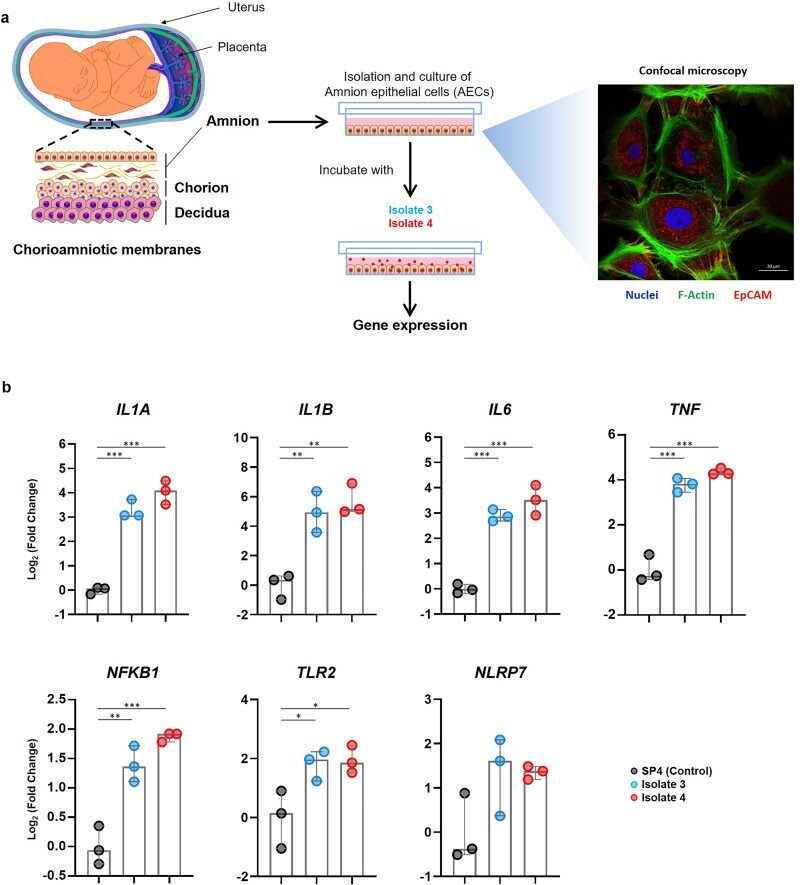
- FIG 6 Incubation of U. parvum serovar 14 and primary human amniocytes. (a) Experimental design (left to right). Primary human amnion epithelial cells (AECs) ( n = 3) were isolated from term human chorioamniotic membranes and incubated with U. parvum isolate 3 (1.3 x 10 5 cells), U. parvum isolate 4 (1.3 x 10 5 cells), or vehicle control (SP4 broth) for 24 h. The AECs were then collected to determine gene expression. A representative confocal microscopy image of the immunofluorescence staining of AECs to show the expression of EpCAM and F-Actin is displayed. (b) Expression of IL1A , IL1B , IL6 , TNF , NFKB1 , TLR2 , and NLRP7 in AECs incubated with U. parvum isolates. The data are shown as medians with minimum and maximum ranges. The P values were determined by one-way analysis of variance (ANOVA), followed by Tukey's tests to determine differences between groups. *, P < 0.05; **, P < 0.01; ***, P < 0.001.