Explore
 Validate
 Learn
LearnPA5-19832
antibody from Invitrogen Antibodies
Targeting: EPCAM
17-1A, 323/A3, CD326, CO-17A, EGP-2, EGP34, EGP40, Ep-CAM, ESA, GA733-2, HEA125, KS1/4, KSA, Ly74, M4S1, MH99, MIC18, MK-1, MOC31, TACST-1, TACSTD1, TROP1
 Western blot
 Immunohistochemistry
Antibody data
- Antibody Data
- Antigen structure
- References [2]
- Comments [0]
- Validations
- Western blot [2]
- Immunocytochemistry [4]
- Other assay [5]
Submit
Validation data
Reference
Comment
Report error
- Product number
- PA5-19832 - Provider product page

- Provider
- Invitrogen Antibodies
- Product name
- EpCAM Polyclonal Antibody
- Antibody type
- Polyclonal
- Antigen
- Synthetic peptide
- Description
- This antibody is predicted to react with cow, pig and rhesus monkey based on sequence homology.
- Reactivity
- Human, Mouse, Rat
- Host
- Rabbit
- Isotype
- IgG
- Vial size
- 100 μg
- Concentration
- 0.9 mg/mL
- Storage
- -20°C or -80°C if preferred
Submitted references Matriptase Cleaves EpCAM and TROP2 in Keratinocytes, Destabilizing Both Proteins and Associated Claudins.
Matriptase-mediated cleavage of EpCAM destabilizes claudins and dysregulates intestinal epithelial homeostasis.
Wu CJ, Lu M, Feng X, Nakato G, Udey MC
Cells 2020 Apr 21;9(4)
Cells 2020 Apr 21;9(4)
Matriptase-mediated cleavage of EpCAM destabilizes claudins and dysregulates intestinal epithelial homeostasis.
Wu CJ, Feng X, Lu M, Morimura S, Udey MC
The Journal of clinical investigation 2017 Feb 1;127(2):623-634
The Journal of clinical investigation 2017 Feb 1;127(2):623-634
No comments: Submit comment
Supportive validation
- Submitted by
- Invitrogen Antibodies (provider)
- Main image

- Experimental details
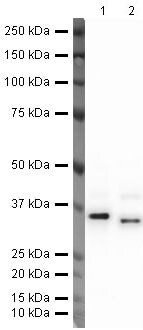
- Western blot analysis of A431 Whole Cell Lysate using Product # PA5-19832, EpCAM primary antibody at a dilution of 1 µg/mL (lane 1). Staining of Human Ovary Tissue Lysate at a dilution of 1 µg/mL (lane 2). Blot treated with a secondary HRP-conjugated Goat polyclonal anti-Rabbit antibody was used at a dilution of 1:3000.
- Submitted by
- Invitrogen Antibodies (provider)
- Main image
- Experimental details
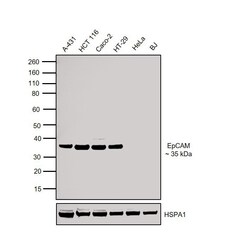
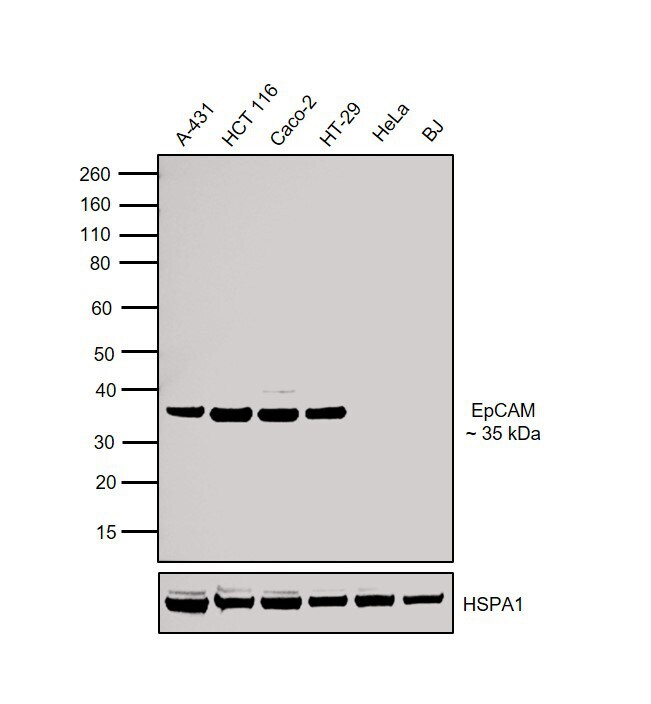
- Western blot was performed using Anti-EpCAM Rabbit Polyclonal Antibody (Product # PA5-19832) and a 35 kDa band corresponding to EpCAM was observed in cell lines tested except for HeLa and BJ. Membrane enriched extracts (30 µg lysate) of A-431 (Lane 1), HCT 116 (Lane 2), Caco-2 (Lane 3), HT-29 (Lane 4), HeLa (Lane 5) and BJ (Lane 6) were electrophoresed using Novex® NuPAGE® 4-12% Bis-Tris Protein Gel (Product # NP0322BOX). Resolved proteins were then transferred onto a nitrocellulose membrane (Product # IB23001) by iBlot® 2 Dry Blotting System (Product # IB21001). The blot was probed with the primary antibody (0.5 µg/mL) and detected by detected by chemiluminescence with Goat anti-Rabbit IgG (Heavy Chain) Superclonal™ Recombinant Secondary Antibody, HRP (Product # A27036, 1:4000 dilution) using the iBright FL 1000 (Product # A32752). Chemiluminescent detection was performed using Novex® ECL Chemiluminescent Substrate Reagent Kit (Product # WP20005).
Supportive validation
- Submitted by
- Invitrogen Antibodies (provider)
- Main image

- Experimental details
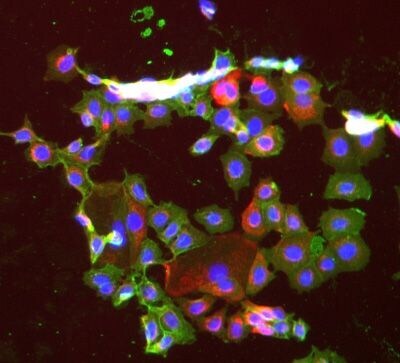
- Immunofluorescent staining of Hek293 cells using Product # PA5-19832, anti-ECam antibody. The cells were fixed with mathanol (100%) for 5 minutes, permabilised with BSA (1%), normal goat serum (10%) and glycine (0.3 M) in 0.1% T-BST for 1 hour and exposed to the primary antibody at a concentration of 1 µg/mL overnight at 4C. The secondary antibody was a 448 fluorescence conjugated Goat anti-rabbit IgG (green) at a dilution of 1:1000. A WGA- 594 fluorescent conjugated stain was used to label plasma membranes (red) and the nuclei stain was DAPI (blue).

- Submitted by
- Invitrogen Antibodies (provider)
- Main image

- Experimental details
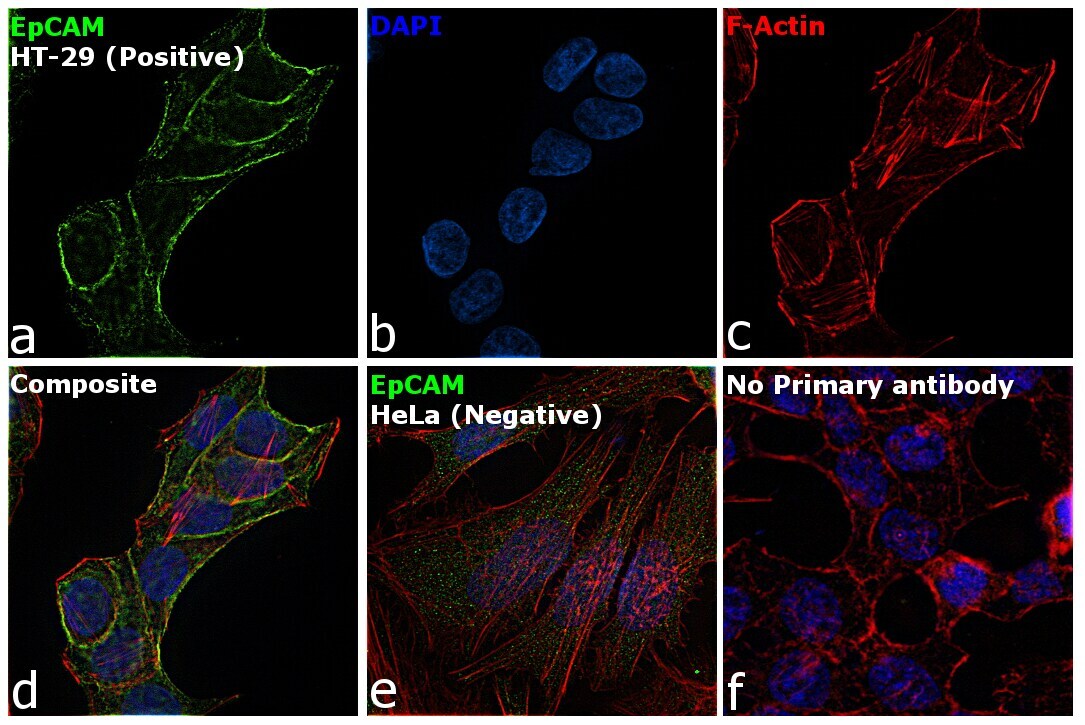
- Immunofluorescence analysis of EpCAM was performed using HT-29 and HeLa cells. The cells were fixed with 4% paraformaldehyde for 10 minutes, permeabilized with 0.1% Triton™ X-100 for 15 minutes, and blocked with 2% BSA for 1 hour at room temperature. The cells were labeled with EpCAM Rabbit Polyclonal Antibody (Product # PA5-19832) at 5 µg/mL in 0.1% BSA and incubated overnight at 4 degree and then labeled with Goat anti-Rabbit IgG (H+L) Highly Cross-Adsorbed Secondary Antibody, Alexa Fluor Plus 488 (Product # A32731) at a dilution of 1:2000 for 45 minutes at room temperature (Panel a: green) in HT-29 cells. Nuclei (Panel b: blue) were stained with ProLong™ Diamond Antifade Mountant with DAPI (Product # P36962). F-actin (Panel c: red) was stained with Rhodamine Phalloidin (Product # R415, 1:300). Panel d represents the merged image of HT-29 cells, which is a positive model for EpCAM expression showing a plasma membrane localization. Panel e represents the merged image of HeLa cells, that are null for EpCAM protein expression. Panel f represents control cells with no primary antibody to assess background. The images were captured at 60X magnification.
- Submitted by
- Invitrogen Antibodies (provider)
- Main image

- Experimental details
- Immunofluorescent staining of Hek293 cells using Product # PA5-19832, anti-ECam antibody. The cells were fixed with mathanol (100%) for 5 minutes, permabilised with BSA (1%), normal goat serum (10%) and glycine (0.3 M) in 0.1% T-BST for 1 hour and exposed to the primary antibody at a concentration of 1 µg/mL overnight at 4C. The secondary antibody was a 448 fluorescence conjugated Goat anti-rabbit IgG (green) at a dilution of 1:1000. A WGA- 594 fluorescent conjugated stain was used to label plasma membranes (red) and the nuclei stain was DAPI (blue).
- Submitted by
- Invitrogen Antibodies (provider)
- Main image
- Experimental details
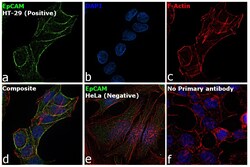
- Immunofluorescence analysis of EpCAM was performed using HT-29 and HeLa cells. The cells were fixed with 4% paraformaldehyde for 10 minutes, permeabilized with 0.1% Triton™ X-100 for 15 minutes, and blocked with 2% BSA for 1 hour at room temperature. The cells were labeled with EpCAM Rabbit Polyclonal Antibody (Product # PA5-19832) at 5 µg/mL in 0.1% BSA and incubated overnight at 4 degree and then labeled with Goat anti-Rabbit IgG (H+L) Highly Cross-Adsorbed Secondary Antibody, Alexa Fluor Plus 488 (Product # A32731) at a dilution of 1:2000 for 45 minutes at room temperature (Panel a: green) in HT-29 cells. Nuclei (Panel b: blue) were stained with ProLong™ Diamond Antifade Mountant with DAPI (Product # P36962). F-actin (Panel c: red) was stained with Rhodamine Phalloidin (Product # R415, 1:300). Panel d represents the merged image of HT-29 cells, which is a positive model for EpCAM expression showing a plasma membrane localization. Panel e represents the merged image of HeLa cells, that are null for EpCAM protein expression. Panel f represents control cells with no primary antibody to assess background. The images were captured at 60X magnification.

Supportive validation
- Submitted by
- Invitrogen Antibodies (provider)
- Main image

- Experimental details
- NULL
- Submitted by
- Invitrogen Antibodies (provider)
- Main image

- Experimental details
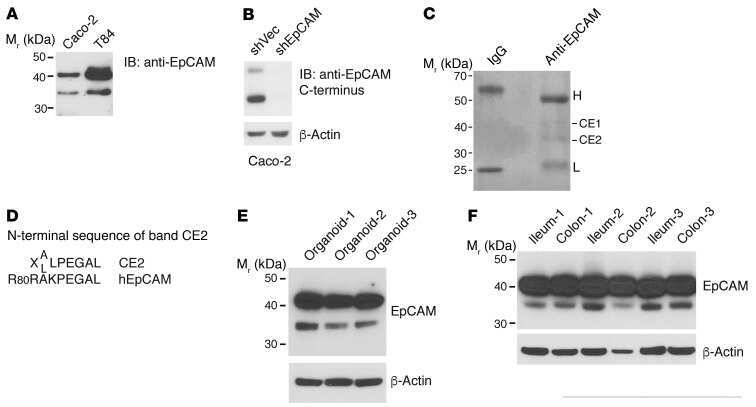
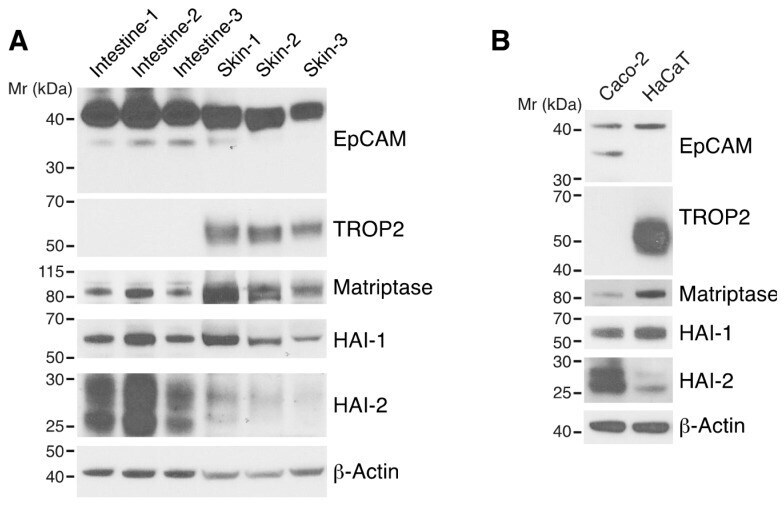
- Figure 1 Expression of HAI-1, HAI-2, matriptase, EpCAM, and TROP2 in skin and intestine. RIPA lysates of trunk skin and small intestine from 8-10 week-old C57BL/6 mice ( A ) and Caco-2 intestinal epithelial cells (IECs) and HaCaT keratinocytes ( B ) were resolved via reduced SDS-PAGE and immunoblotted with anti-HAI-1, anti-HAI-2, anti-matriptase, anti-EpCAM, anti-TROP2. beta-actin was used as a loading control. Representative data from 1 of 3 experiments for ( B ) is shown.
- Submitted by
- Invitrogen Antibodies (provider)
- Main image

- Experimental details
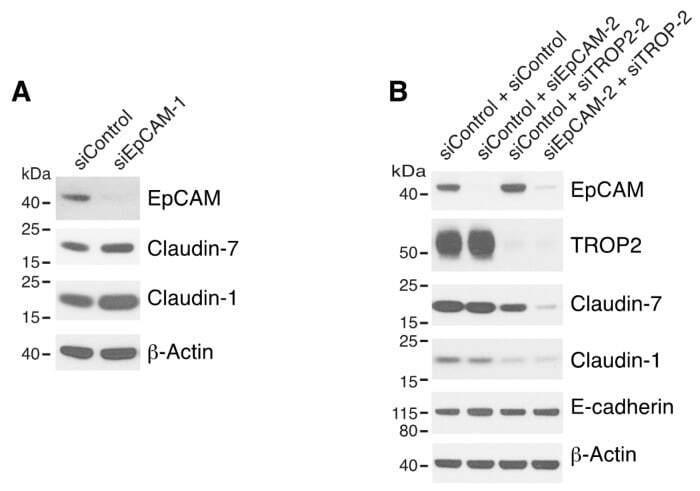
- Figure 2 Both EpCAM and TROP2 regulate claudin expression in keratinocytes. HaCaT cells were transfected with control or EpCAM siRNAs ( A ), control, EpCAM, TROP2, or EpCAM and TROP2 siRNAs ( B ) using electroporation. 72 h after transfection, cell lysates were prepared, resolved using SDS-PAGE and immunoblotted with anti-EpCAM, anti-TROP2, anti-claudin-7 or anti-claudin-1 to assess corresponding protein levels. beta-actin was used as a loading control.
- Submitted by
- Invitrogen Antibodies (provider)
- Main image

- Experimental details
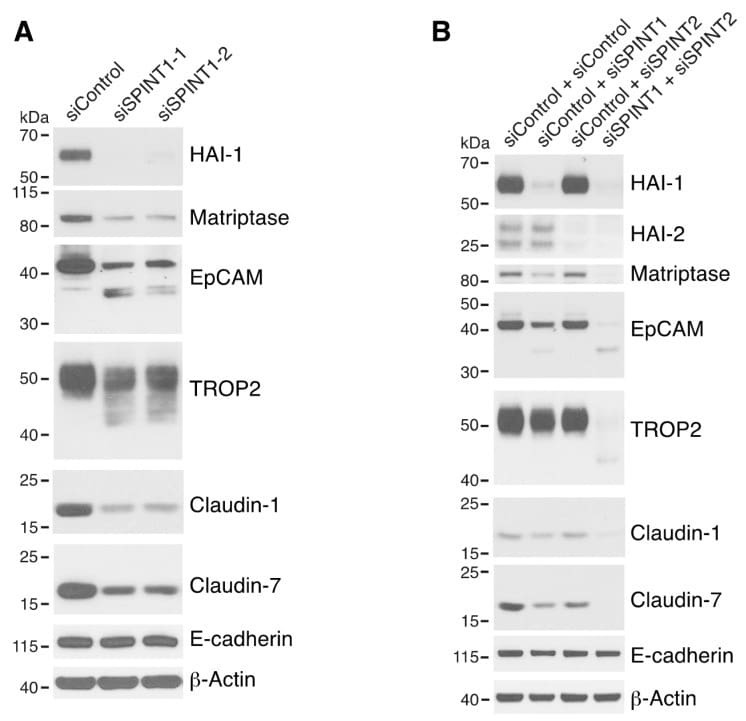
- Figure 5 HAI-1 and HAI-2 regulate EpCAM and TROP2 cleavage and claudin levels. HaCaT cells were transfected using electroporation with control siRNA or one of two different SPINT1 siRNAs (siSPINT1-1 and siSPINT1-2) ( A ), control, SPINT1, SPINT2, or SPINT1, and SPINT2 siRNAs ( B ). After 72 h, cell lysates were prepared, subjected to electrophoresis and analyzed via Western blotting for HA1-1, HAI-2, matriptase, EpCAM, TROP2, claudin-1, claudin-7 and E-cadherin. beta-actin was used as a loading control. Representative data from 1 of 3-4 experiments is shown.
- Submitted by
- Invitrogen Antibodies (provider)
- Main image
- Experimental details
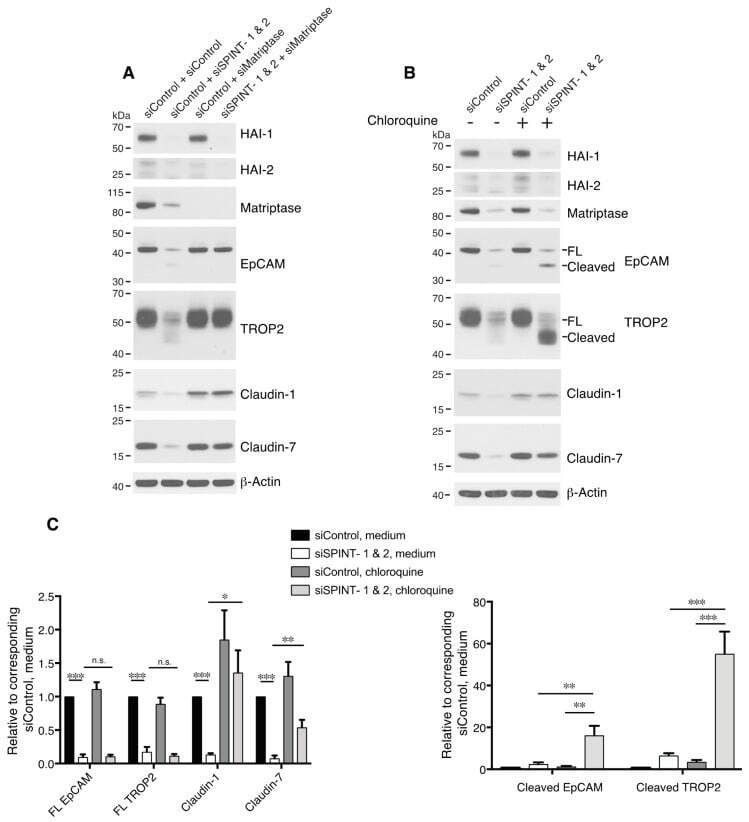
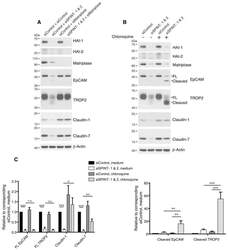
- Figure 6 HAIs act via matriptase to regulate degradation of EpCAM, TROP2, and claudins in lysosomes. HaCaT cells were transfected using electroporation with control or SPINT1 plus SPINT2, matriptase, or SPINT1, SPINT2 plus matriptase siRNAs ( A ), or control or SPINT1 and SPINT2 siRNAs ( B ). Before being harvested at 72 h after transfection ( A , B ), cells were treated with or without 100 muM chloroquine for 20 h ( B ). RIPA cell lysates were resolved using SDS-PAGE and immunoblotted with anti-HAI-1, anti-HAI-2, anti-matriptase, anti-EpCAM anti-TROP2, anti-claudin-1, or anti-claudin-7. beta-actin was used as a loading control. Representative data from 1 of 5 experiments is shown. ( C ) Band intensities corresponding to full-length (FL) EpCAM, FL TROP2, claudin-1 and claudin-7 (left panel) and cleaved EpCAM and cleaved TROP2 (right panel) were quantified and normalized to beta-actin. Data are plotted as ratios (means +- SEM) relative to corresponding untreated siControls ( n = 5). A two-way ANOVA was used to calculate p values for multiple group comparisons to assess mean differences between groups (* p < 0.05, ** p < 0.01, *** p < 0.001 or 0.0001, n.s. p > 0.05).