Explore
 Validate
 Learn
Learn Western blot
 ELISA
ELISAAntibody data
- Antibody Data
- Antigen structure
- References [1]
- Comments [0]
- Validations
- Western blot [2]
- Other assay [3]
Submit
Validation data
Reference
Comment
Report error
- Product number
- PA3-951 - Provider product page

- Provider
- Invitrogen Antibodies
- Product name
- PARP1 Polyclonal Antibody
- Antibody type
- Polyclonal
- Antigen
- Synthetic peptide
- Description
- By Western blot, this antibody detects a 116 kDa protein representing PARP and the 85 kDa apoptosis-induced cleavage product of protease resembling ICE (prICE) and CPP32 from GH4C1 cell extract.
- Reactivity
- Human, Mouse, Rat, Bovine
- Host
- Rabbit
- Isotype
- IgG
- Vial size
- 100 µL
- Concentration
- Conc. Not Determined
- Storage
- -20° C, Avoid Freeze/Thaw Cycles
Submitted references A systematic analysis of the PARP protein family identifies new functions critical for cell physiology.
Vyas S, Chesarone-Cataldo M, Todorova T, Huang YH, Chang P
Nature communications 2013;4:2240
Nature communications 2013;4:2240
No comments: Submit comment
Supportive validation
- Submitted by
- Invitrogen Antibodies (provider)
- Main image

- Experimental details
- Western Blot Analysis with the PARP polyclonal antibody (Product # PA3-951). Lane 1: Molecular Weight Marker, Lane 2: Human HL60 Cell Extract.

- Submitted by
- Invitrogen Antibodies (provider)
- Main image

- Experimental details
- CRISPR-Cas9 mediated genome editing of PARP1 (as confirmed by next generation sequencing) was achieved by using LentiArray™ Lentiviral sgRNA (Product # A32042, Assay ID CRISPR978664_LV) and LentiArray Cas9 Lentivirus (Product # A32064). Western blot analysis of PARP1 was performed by loading 30 µg of HeLa Wild Type (Lane 1), Treated HeLa Wild Type (Lane 2), HeLa Cas9 (Lane 3), Treated HeLa Cas9 (Lane 4), HeLa Cas9 cells transduced with PARP1 Lentiviral sgRNA (Lane 5) and Treated HeLa Cas9 cells transduced with PARP1 Lentiviral sgRNA (Lane 6) whole cell extracts. The samples were electrophoresed using NuPAGE™ Novex™ 4-12% Bis-Tris Protein Gel (Product # NP0322BOX). Resolved proteins were then transferred onto a nitrocellulose membrane (Product # IB23001) by iBlot® 2 Dry Blotting System (Product # IB21001). The blot was probed with Anti-PARP1 Polyclonal Antibody (Product # PA3-951) using 1:500 dilution and Goat anti-Rabbit IgG (H+L) Superclonal™ Recombinant Secondary Antibody, HRP (Product # A27036 1:4,000 dilution). Chemiluminescent detection was performed using Novex® ECL Chemiluminescent Substrate Reagent Kit (Product # WP20005). Even though NGS analysis determine the clone as partial KO, there was complete loss of signal in sgRNA transduced cells using the LentiArray™ CRISPR product line confirming that the antibody is specific to PARP1. An uncharacterized band was observed at 55 kDa in all the samples. Treatment used is 1 µ

Supportive validation
- Submitted by
- Invitrogen Antibodies (provider)
- Main image
- Experimental details
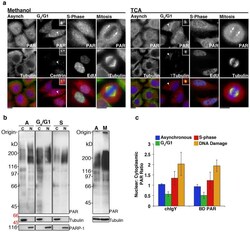
- Figure 2 Poly(ADP-ribose) is localized to the cytoplasm and nucleus throughout the cell cycle A) Asynchronous populations of HeLa cells (Asynch) or cells arrested in G 0 /G 1 , S-phase or Mitosis were fixed with Methanol or TCA , then stained for PAR (Tulip chIgY), and Centrin or gamma-Tubulin, to identify single centriole pairs found during G o /G 1 , EdU, incorporated during S-phase, and Tubulin, to stain mitotic spindles. In asynchronous cells and during G o /G 1 , S-phase, and Mitosis, PAR staining was punctate with strong staining at the centrosome (arrowhead) and poles of the mitotic spindle (arrows). S-phase cells exhibited increased punctate staining in the nucleus relative to G o /G 1 cells. Merge shows PAR (red), cell cycle markers (green) and Hoechst 33342 (blue). Scale bars, 10 mum. B) Cytoplasmic (C) and nuclear (N) extracts prepared from identical cell pellets, then normalized to cell volume, were generated from asynchronous, G o /G 1 and S-phase arrested cells. Extracts were immunoblotted with Tulip chIgY anti-PAR antibody. Cytoplasmic and nuclear extracts were further examined for the presence of tubulin, a cytoplasmic protein, or PARP1, a nuclear protein, to assay for contamination between the fractions. Total cell extracts were also prepared from asynchronous (A) and mitotic (M) cells and immunoblotted with Tulip chIgY anti-PAR antibody. Positions of molecular weight markers are indicated on the right in black, molecular weights shown in italics identify the

- Submitted by
- Invitrogen Antibodies (provider)
- Main image

- Experimental details
- Figure 1 PARPs localize throughout the cell A) Domain structure of PARP proteins. Functional domains are indicated and green dashes within the catalytic domain indicate H-Y-E amino acids thought to be required for PAR synthesis activity. Dashes with different colors indicate the replacement of these amino acids with the following residues: I (red), Y (blue), V (purple), Q (yellow), T (pink), L (orange). B-C) HeLa cells were fixed then stained with affinity-purified antibodies generated against each PARP. Data is presented in PARP subfamily groupings, labeled in boxes, with each PARP labeled as P(x). A summary of localization patterns is provided in Table 1 . B) Interphase localization of PARP proteins. Most PARPs are cytoplasmic (top). Merge (below) shows PARP (red) and Hoechst 33342 staining (blue). C) PARP localization in mitotic cells (top). A subset of PARPs localize to the mitotic spindle (P5a, 5b, 8,11). Merge (below) shows PARP (red), tubulin (green) and Hoechst 33342 (blue) staining. Scale bars, 10 mum. See also Supplementary Figures S1-S3 and Tables 1 - 2 .

- Submitted by
- Invitrogen Antibodies (provider)
- Main image

- Experimental details
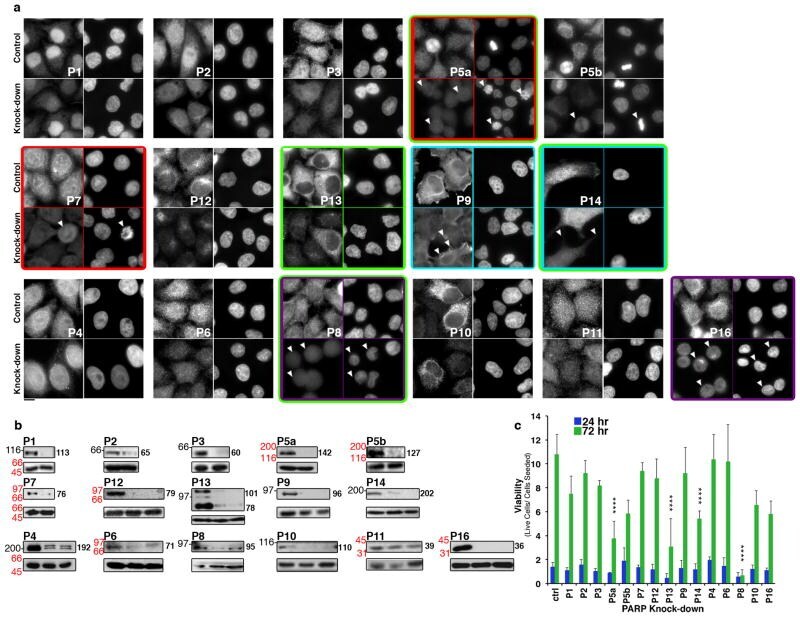
- Figure 3 Knock-down phenotypes of the PARP family PARP knock-down results in cell viability, membrane, actin cytoskeleton, and mitosis phenotypes. PARP expression was knocked-down via siRNA transfection in HeLa cells. Cells were then stained for each PARP (A) and immunoblot analysis performed to confirm knock-down (B). A) Cells were transfected with control siRNAs (Control) or siRNAs specific for each PARP (Knock-down) then stained for PARP (left) and Hoechst 33342 (right). Knockdown identified 4 phenotypes: defects in membranes (purple boxes), actin cytoskeleton (cyan boxes), mitosis (red boxes), and cell viability (green boxes, Supplementary Figure S5A ). Arrowheads indicate cells exhibiting knock-down. Scale bar, 10 mum. B) Lysates from HeLa cells transfected with control (left lane) or PARP-specific siRNA (right lane(s)) were immunoblotted with corresponding anti-PARP antibody. Positions of molecular weight markers are indicated on the right in black, molecular weights shown in italics identify the closest markers above and below the cropped region and the approximate molecular weight (kDa) of the relevant PARP in each knock-down is indicated to the left of each PARP blot. The corresponding tubulin blot is included as a loading control (lower panels). C) Cell number was analyzed 24h and 72h after knock-down of each PARP and presented as fold change relative to the initial number of cells seeded. PARP knock-downs that resulted in a decrease in viability of >= 2 standard de