 Explore
 Validate
 Learn
Learn Western blot
 Immunocytochemistry
Antibody data
- Antibody Data
- Antigen structure
- References [20]
- Comments [0]
- Validations
- Immunocytochemistry [2]
- Immunoprecipitation [1]
- Immunohistochemistry [1]
- Flow cytometry [1]
- Other assay [14]
Submit
Validation data
Reference
Comment
Report error
- Product number
- AHO0492 - Provider product page

- Provider
- Invitrogen Antibodies
- Product name
- Paxillin Monoclonal Antibody (5H11)
- Antibody type
- Monoclonal
- Antigen
- Purifed from natural sources
- Description
- Staining of formalin-fixed, paraffin-embedded tissues requires boiling tissues in 1mM EDTA, pH 8.0, for 10-20 min followed by cooling at room temperature for 20 min. Recommended positive controls include HeLa cells and colon carcinoma.
- Reactivity
- Human, Mouse, Rat
- Host
- Mouse
- Isotype
- IgG
- Antibody clone number
- 5H11
- Vial size
- 500 µL
- Concentration
- 0.2 mg/mL
- Storage
- 4°C
Submitted references The Lipid-Binding Defective Dynamin 2 Mutant in Charcot-Marie-Tooth Disease Impairs Proper Actin Bundling and Actin Organization in Glomerular Podocytes.
Tumor cell-conditioned media drives collagen remodeling via fibroblast and pericyte activation in an in vitro premetastatic niche model.
Plexin-B2 orchestrates collective stem cell dynamics via actomyosin contractility, cytoskeletal tension and adhesion.
mTORC1 activity is supported by spatial association with focal adhesions.
Inhibiting FAK-Paxillin Interaction Reduces Migration and Invadopodia-Mediated Matrix Degradation in Metastatic Melanoma Cells.
Fibronectin Patches as Anchoring Points for Force Sensing and Transmission in Human Induced Pluripotent Stem Cell-Derived Pericytes.
Nup93 regulates breast tumor growth by modulating cell proliferation and actin cytoskeleton remodeling.
The Arf activator GBF1 localizes to plasma membrane sites involved in cell adhesion and motility.
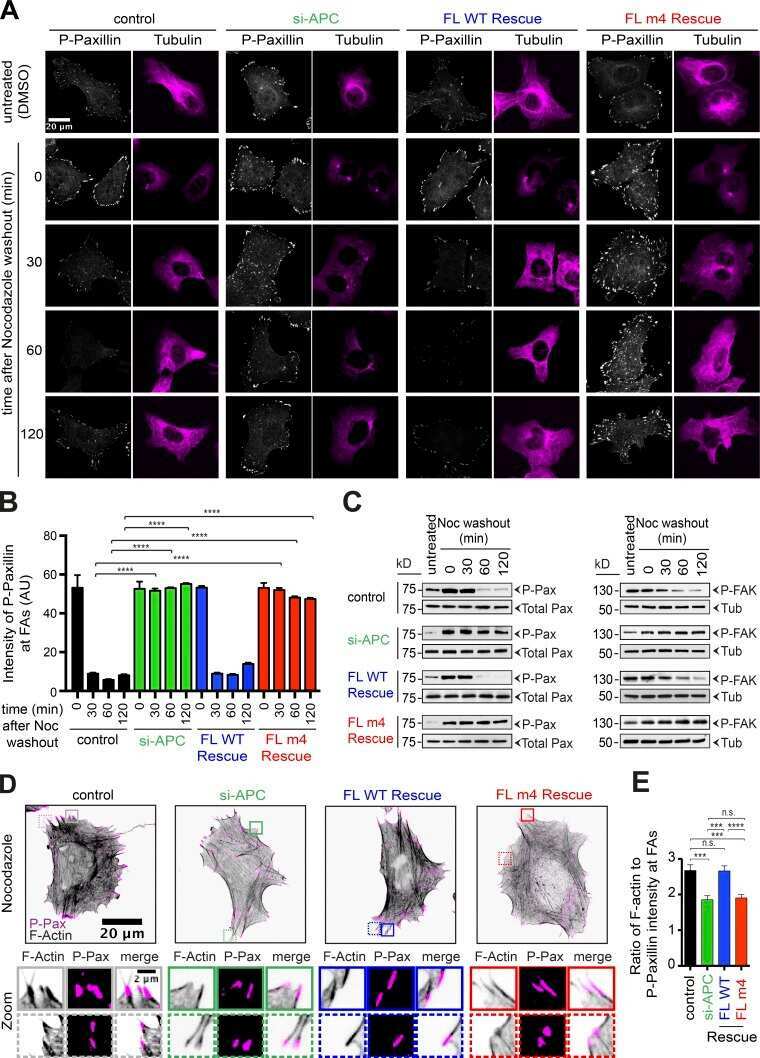
Adenomatous polyposis coli nucleates actin assembly to drive cell migration and microtubule-induced focal adhesion turnover.
Vinexin family (SORBS) proteins play different roles in stiffness-sensing and contractile force generation.
Nicotinic acid impairs assembly of leading edge in glioma cells.
High cell-surface density of HER2 deforms cell membranes.
αV-integrins are required for mechanotransduction in MDCK epithelial cells.
Paxillin mutations affect focal adhesions and lead to altered mitochondrial dynamics: relevance to lung cancer.
c-Yes regulates cell adhesion at the blood-testis barrier and the apical ectoplasmic specialization in the seminiferous epithelium of rat testes.
Presenilin 1 affects focal adhesion site formation and cell force generation via c-Src transcriptional and posttranslational regulation.
Loss of caveolin-1 polarity impedes endothelial cell polarization and directional movement.
Activation of platelet-activating factor receptor-coupled G alpha q leads to stimulation of Src and focal adhesion kinase via two separate pathways in human umbilical vein endothelial cells.
Aberrant activation of focal adhesion proteins mediates fibrillar amyloid beta-induced neuronal dystrophy.
Aberrant activation of focal adhesion proteins mediates fibrillar amyloid beta-induced neuronal dystrophy.
Hamasaki E, Wakita N, Yasuoka H, Nagaoka H, Morita M, Takashima E, Uchihashi T, Takeda T, Abe T, Lee JW, Iimura T, Saleem MA, Ogo N, Asai A, Narita A, Takei K, Yamada H
Frontiers in cell and developmental biology 2022;10:884509
Frontiers in cell and developmental biology 2022;10:884509
Tumor cell-conditioned media drives collagen remodeling via fibroblast and pericyte activation in an in vitro premetastatic niche model.
Nairon KG, DePalma TJ, Zent JM, Leight JL, Skardal A
iScience 2022 Jul 15;25(7):104645
iScience 2022 Jul 15;25(7):104645
Plexin-B2 orchestrates collective stem cell dynamics via actomyosin contractility, cytoskeletal tension and adhesion.
Junqueira Alves C, Dariolli R, Haydak J, Kang S, Hannah T, Wiener RJ, DeFronzo S, Tejero R, Gusella GL, Ramakrishnan A, Alves Dias R, Wojcinski A, Kesari S, Shen L, Sobie EA, Rodrigues Furtado de Mendonça JP, Azeloglu EU, Zou H, Friedel RH
Nature communications 2021 Oct 14;12(1):6019
Nature communications 2021 Oct 14;12(1):6019
mTORC1 activity is supported by spatial association with focal adhesions.
Rabanal-Ruiz Y, Byron A, Wirth A, Madsen R, Sedlackova L, Hewitt G, Nelson G, Stingele J, Wills JC, Zhang T, Zeug A, Fässler R, Vanhaesebroeck B, Maddocks ODK, Ponimaskin E, Carroll B, Korolchuk VI
The Journal of cell biology 2021 May 3;220(5)
The Journal of cell biology 2021 May 3;220(5)
Inhibiting FAK-Paxillin Interaction Reduces Migration and Invadopodia-Mediated Matrix Degradation in Metastatic Melanoma Cells.
Mousson A, Legrand M, Steffan T, Vauchelles R, Carl P, Gies JP, Lehmann M, Zuber G, De Mey J, Dujardin D, Sick E, Rondé P
Cancers 2021 Apr 14;13(8)
Cancers 2021 Apr 14;13(8)
Fibronectin Patches as Anchoring Points for Force Sensing and Transmission in Human Induced Pluripotent Stem Cell-Derived Pericytes.
Iendaltseva O, Orlova VV, Mummery CL, Danen EHJ, Schmidt T
Stem cell reports 2020 Jun 9;14(6):1107-1122
Stem cell reports 2020 Jun 9;14(6):1107-1122
Nup93 regulates breast tumor growth by modulating cell proliferation and actin cytoskeleton remodeling.
Bersini S, Lytle NK, Schulte R, Huang L, Wahl GM, Hetzer MW
Life science alliance 2020 Jan;3(1)
Life science alliance 2020 Jan;3(1)
The Arf activator GBF1 localizes to plasma membrane sites involved in cell adhesion and motility.
Busby T, Meissner JM, Styers ML, Bhatt J, Kaushik A, Hjelmeland AB, Sztul E
Cellular logistics 2017;7(2):e1308900
Cellular logistics 2017;7(2):e1308900
Adenomatous polyposis coli nucleates actin assembly to drive cell migration and microtubule-induced focal adhesion turnover.
Juanes MA, Bouguenina H, Eskin JA, Jaiswal R, Badache A, Goode BL
The Journal of cell biology 2017 Sep 4;216(9):2859-2875
The Journal of cell biology 2017 Sep 4;216(9):2859-2875
Vinexin family (SORBS) proteins play different roles in stiffness-sensing and contractile force generation.
Ichikawa T, Kita M, Matsui TS, Nagasato AI, Araki T, Chiang SH, Sezaki T, Kimura Y, Ueda K, Deguchi S, Saltiel AR, Kioka N
Journal of cell science 2017 Oct 15;130(20):3517-3531
Journal of cell science 2017 Oct 15;130(20):3517-3531
Nicotinic acid impairs assembly of leading edge in glioma cells.
Yang X, Mei S, Niu H, Li J
Oncology reports 2017 Aug;38(2):829-836
Oncology reports 2017 Aug;38(2):829-836
High cell-surface density of HER2 deforms cell membranes.
Chung I, Reichelt M, Shao L, Akita RW, Koeppen H, Rangell L, Schaefer G, Mellman I, Sliwkowski MX
Nature communications 2016 Sep 7;7:12742
Nature communications 2016 Sep 7;7:12742
αV-integrins are required for mechanotransduction in MDCK epithelial cells.
Teräväinen TP, Myllymäki SM, Friedrichs J, Strohmeyer N, Moyano JV, Wu C, Matlin KS, Muller DJ, Manninen A
PloS one 2013;8(8):e71485
PloS one 2013;8(8):e71485
Paxillin mutations affect focal adhesions and lead to altered mitochondrial dynamics: relevance to lung cancer.
Kawada I, Hasina R, Lennon FE, Bindokas VP, Usatyuk P, Tan YH, Krishnaswamy S, Arif Q, Carey G, Hseu RD, Robinson M, Tretiakova M, Brand TM, Iida M, Ferguson MK, Wheeler DL, Husain AN, Natarajan V, Vokes EE, Singleton PA, Salgia R
Cancer biology & therapy 2013 Jul;14(7):679-91
Cancer biology & therapy 2013 Jul;14(7):679-91
c-Yes regulates cell adhesion at the blood-testis barrier and the apical ectoplasmic specialization in the seminiferous epithelium of rat testes.
Xiao X, Mruk DD, Lee WM, Cheng CY
The international journal of biochemistry & cell biology 2011 Apr;43(4):651-65
The international journal of biochemistry & cell biology 2011 Apr;43(4):651-65
Presenilin 1 affects focal adhesion site formation and cell force generation via c-Src transcriptional and posttranslational regulation.
Waschbüsch D, Born S, Niediek V, Kirchgessner N, Tamboli IY, Walter J, Merkel R, Hoffmann B
The Journal of biological chemistry 2009 Apr 10;284(15):10138-49
The Journal of biological chemistry 2009 Apr 10;284(15):10138-49
Loss of caveolin-1 polarity impedes endothelial cell polarization and directional movement.
Beardsley A, Fang K, Mertz H, Castranova V, Friend S, Liu J
The Journal of biological chemistry 2005 Feb 4;280(5):3541-7
The Journal of biological chemistry 2005 Feb 4;280(5):3541-7
Activation of platelet-activating factor receptor-coupled G alpha q leads to stimulation of Src and focal adhesion kinase via two separate pathways in human umbilical vein endothelial cells.
Deo DD, Bazan NG, Hunt JD
The Journal of biological chemistry 2004 Jan 30;279(5):3497-508
The Journal of biological chemistry 2004 Jan 30;279(5):3497-508
Aberrant activation of focal adhesion proteins mediates fibrillar amyloid beta-induced neuronal dystrophy.
Grace EA, Busciglio J
The Journal of neuroscience : the official journal of the Society for Neuroscience 2003 Jan 15;23(2):493-502
The Journal of neuroscience : the official journal of the Society for Neuroscience 2003 Jan 15;23(2):493-502
No comments: Submit comment
Supportive validation
- Submitted by
- Invitrogen Antibodies (provider)
- Main image
- Experimental details
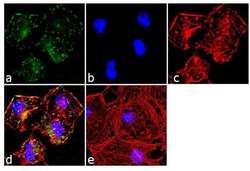
- Immunofluorescence analysis of Paxillin was done on 70% confluent log phase HeLa cells. The cells were fixed with 4% paraformaldehyde for 10 minutes, permeabilized with 0.1% Triton™ X-100 for 10 minutes, and blocked with 1% BSA for 1 hour at room temperature. The cells were labeled with Paxillin (5H11) Mouse Monoclonal Antibody (Product # AHO0492) at 2 µg/mL in 0.1% BSA and incubated for 3 hours at room temperature and then labeled with Goat anti-Mouse IgG (H+L) Superclonal™ Secondary Antibody, Alexa Fluor® 488 conjugate (Product # A28175) at a dilution of 1:2000 for 45 minutes at room temperature (Panel a: green). Nuclei (Panel b: blue) were stained with SlowFade® Gold Antifade Mountant with DAPI (Product # S36938). F-actin (Panel c: red) was stained with Alexa Fluor® 555 Rhodamine Phalloidin (Product # R415, 1:300).Panel d is a merged image showing punctuated cytoplasmic localization. Panel e is a no primary antibody control. The images were captured at 60X magnification.

- Submitted by
- Invitrogen Antibodies (provider)
- Main image
- Experimental details
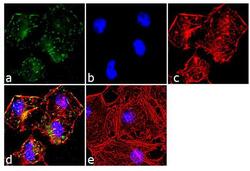
- Immunofluorescence analysis of Paxillin was done on 70% confluent log phase HeLa cells. The cells were fixed with 4% paraformaldehyde for 10 minutes, permeabilized with 0.1% Triton™ X-100 for 10 minutes, and blocked with 1% BSA for 1 hour at room temperature. The cells were labeled with Paxillin (5H11) Mouse Monoclonal Antibody (Product # AHO0492) at 2 µg/mL in 0.1% BSA and incubated for 3 hours at room temperature and then labeled with Goat anti-Mouse IgG (H+L) Superclonal™ Secondary Antibody, Alexa Fluor® 488 conjugate (Product # A28175) at a dilution of 1:2000 for 45 minutes at room temperature (Panel a: green). Nuclei (Panel b: blue) were stained with SlowFade® Gold Antifade Mountant with DAPI (Product # S36938). F-actin (Panel c: red) was stained with Alexa Fluor® 555 Rhodamine Phalloidin (Product # R415, 1:300).Panel d is a merged image showing punctuated cytoplasmic localization. Panel e is a no primary antibody control. The images were captured at 60X magnification.
Supportive validation
- Submitted by
- Invitrogen Antibodies (provider)
- Main image
- Experimental details
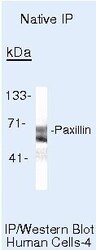
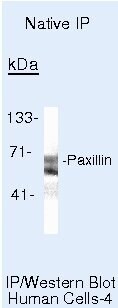
- Immunoprecipitation of Paxillin in native human A431 cells using a Paxillin monoclonal antibody (Product # AHO0492).
Supportive validation
- Submitted by
- Invitrogen Antibodies (provider)
- Main image

- Experimental details
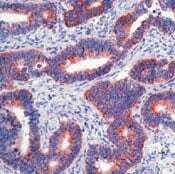
- Immunohistochemical analysis of Paxillin in formalin-fixed, paraffin-embedded human colon carcinoma using a Paxillin monoclonal antibody (Product # AHO0492). Detection was performed with a peroxidase-conjugate and AEC chromogen. Note nuclear staining of tumor cells.
Supportive validation
- Submitted by
- Invitrogen Antibodies (provider)
- Main image

- Experimental details
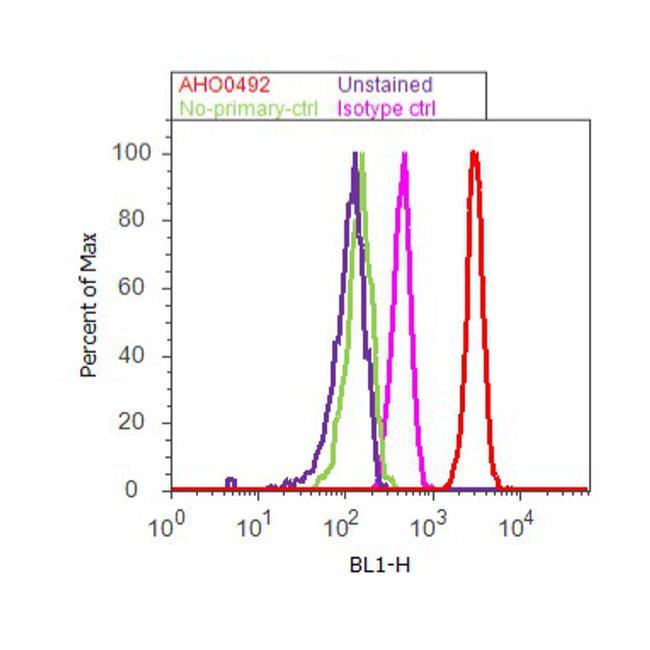
- Flow cytometry analysis of Paxillin was done on HEK-293 cells. Cells were fixed with 70% ethanol for 10 minutes, permeabilized with 0.25% Triton™ X-100 for 20 minutes, and blocked with 5% BSA for 30 minutes at room temperature. Cells were labeled with Paxillin Mouse Monoclonal Antibody (AHO0492, red histogram) or with mouse isotype control (pink histogram) at 3-5 ug/million cells in 2.5% BSA. After incubation at room temperature for 2 hours, the cells were labeled with Alexa Fluor® 488 Rabbit Anti-Mouse Secondary Antibody (A11059) at a dilution of 1:400 for 30 minutes at room temperature. The representative 10,000 cells were acquired and analyzed for each sample using an Attune® Acoustic Focusing Cytometer. The purple histogram represents unstained control cells and the green histogram represents no-primary-antibody control.
Supportive validation
- Submitted by
- Invitrogen Antibodies (provider)
- Main image
- Experimental details
- NULL
- Submitted by
- Invitrogen Antibodies (provider)
- Main image
- Experimental details
- NULL

- Submitted by
- Invitrogen Antibodies (provider)
- Main image
- Experimental details
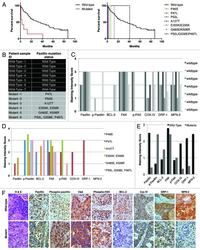
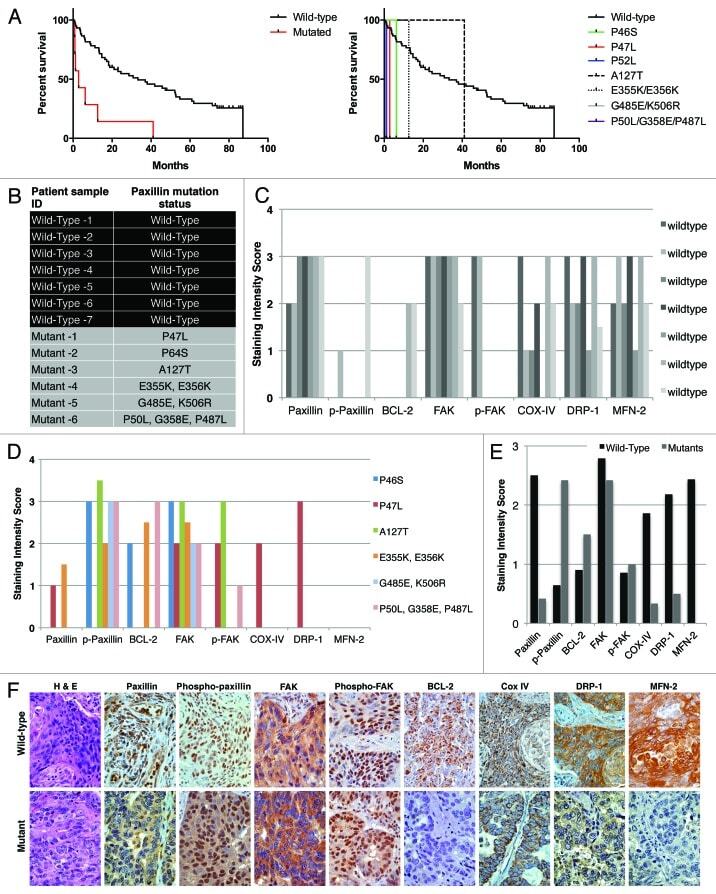
- Figure 6. ( A ) Survival outcome analysis in NSCLC patients with wild-type versus mutated PXN. Left and right graphs show overall and individual mutant survival curves, respectively. The relative expression of PXN, p-PXN, BCL-2, FAK, phospho-FAK, Cox IV, DRP-1, and MFN-2 was evaluated by IHC on two sets of samples; seven NSCLC patient samples bearing wild-type PXN and six NSCLC patient samples that were identified to have various PXN mutations as shown in ( B ). ( C and D ) represent the averaged staining intensity scores among all WT and all mutants. ( E ) Shows graph of staining intensity scores of the proteins assayed as expressed in the cytoplasm of the cells. ( F )The panel shows photographs of IHC stains represented in one wild-type and one mutant sample.
- Submitted by
- Invitrogen Antibodies (provider)
- Main image
- Experimental details
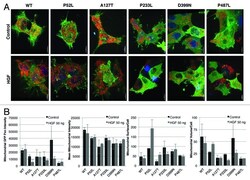
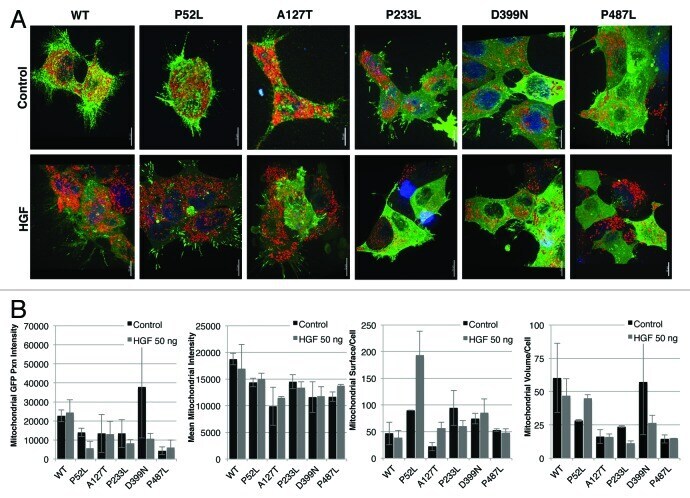
- Figure 3. Effect of HGF stimulation on HEK-293 wild-type PXN and mutants shown in ( A ) confocal images after treatment with HGF and stained with MitoTracker Red and Hoechst and ( B ) measurements of mitochondrial functions by Imaris.
- Submitted by
- Invitrogen Antibodies (provider)
- Main image
- Experimental details
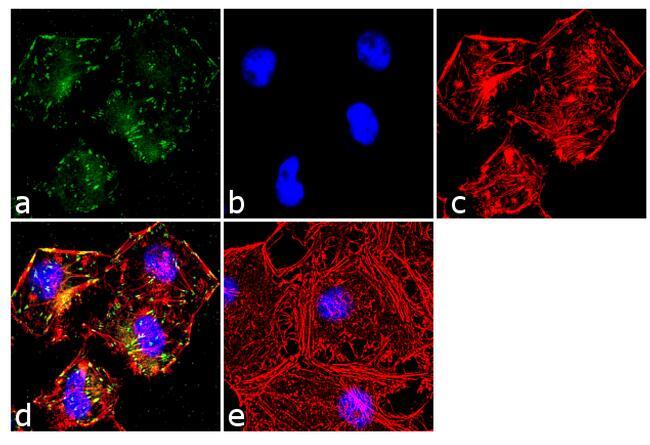
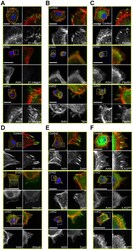
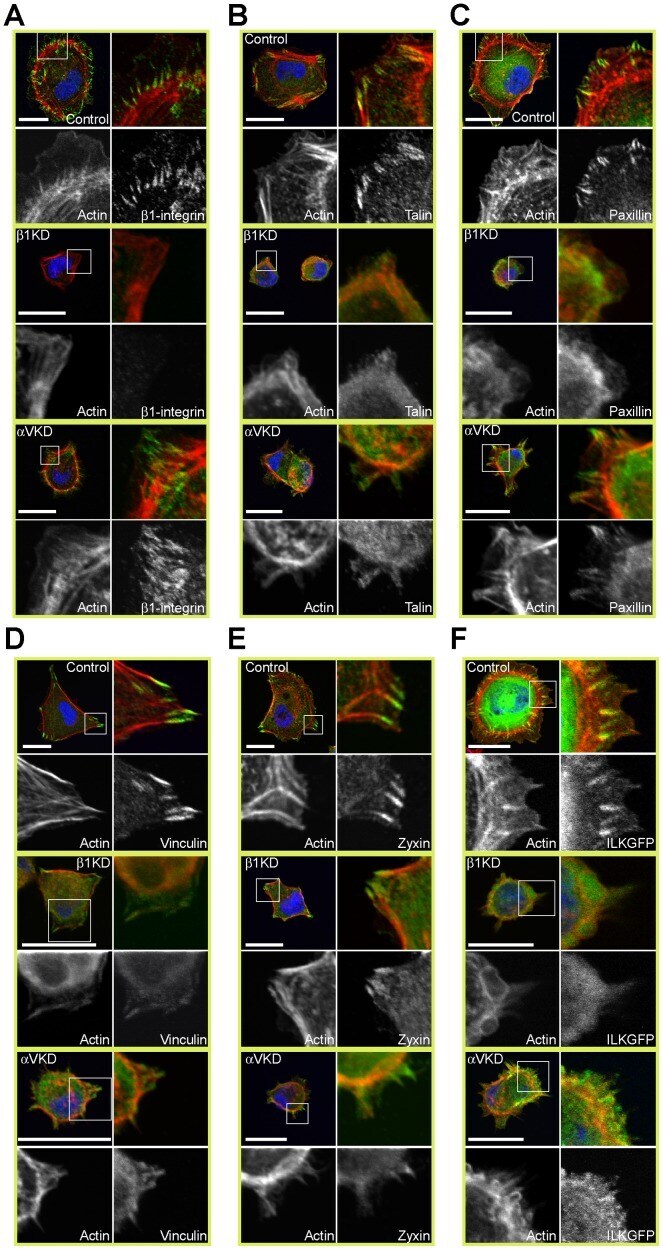
- Figure 4 Recruitment of multiple FA components is defective in ItgalphaV- and Itgbeta1-KD ItgV-KD cells. A ) Control, Itgbeta1- and ItgalphaV-KD MDCK cells were trypsinized, seeded onto Col I-coated coverslips in serum-free culture medium, allowed to settle for 75 minutes, fixed and stained for actin (TRITC-phalloidin, red), nuclei (DAPI, blue) and beta1-integrin (green), B ) talin, C ) paxillin, D ) vinculin or E ) zyxin. F ) Control, Itgbeta1- and ItgalphaV-KD MDCK cells expressing GFP-ILK (green) were treated as above and stained for actin (TRITC-phalloidin, red) and nuclei (DAPI, blue). Scale bars are 20 um in all figure panels.
- Submitted by
- Invitrogen Antibodies (provider)
- Main image

- Experimental details
- Immunoprecipitation of Paxillin in native human A431 cells using a Paxillin monoclonal antibody (Product # AHO0492).

- Submitted by
- Invitrogen Antibodies (provider)
- Main image
- Experimental details
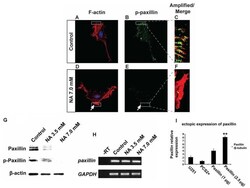
- Figure 4. Nicotinic acid (NA) post-transcriptionally downregulates paxillin. U251 cells were treated with the indicated concentration of NA for 4 h. (A-F) DAPI labeling (blue) for nuclei, rhodamine phalloidin labeling for F-actin (red) and immunocytochemistry for p-paxillin (green) were carried out as described in Materials and methods. Regions denoted with rectangles are amplified and shown in insets with red and green channels merged. (G) Western blot analyses for whole-cell lysates were performed with an anti-paxillin antibody. Membranes were stripped and reblotted for p-paxillin and beta-actin. (H) Total RNA was extracted, and semi-quantitative RT-PCR was carried out for paxillin mRNA. GAPDH was included as a loading control; -RT, control with no reverse transcriptase (same below). (I) Ectopic expression of 2.5 ug of paxillin in U251 cells, significantly increased paxillin mRNA.

- Submitted by
- Invitrogen Antibodies (provider)
- Main image
- Experimental details
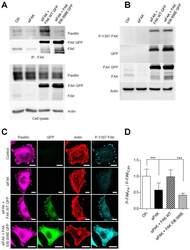
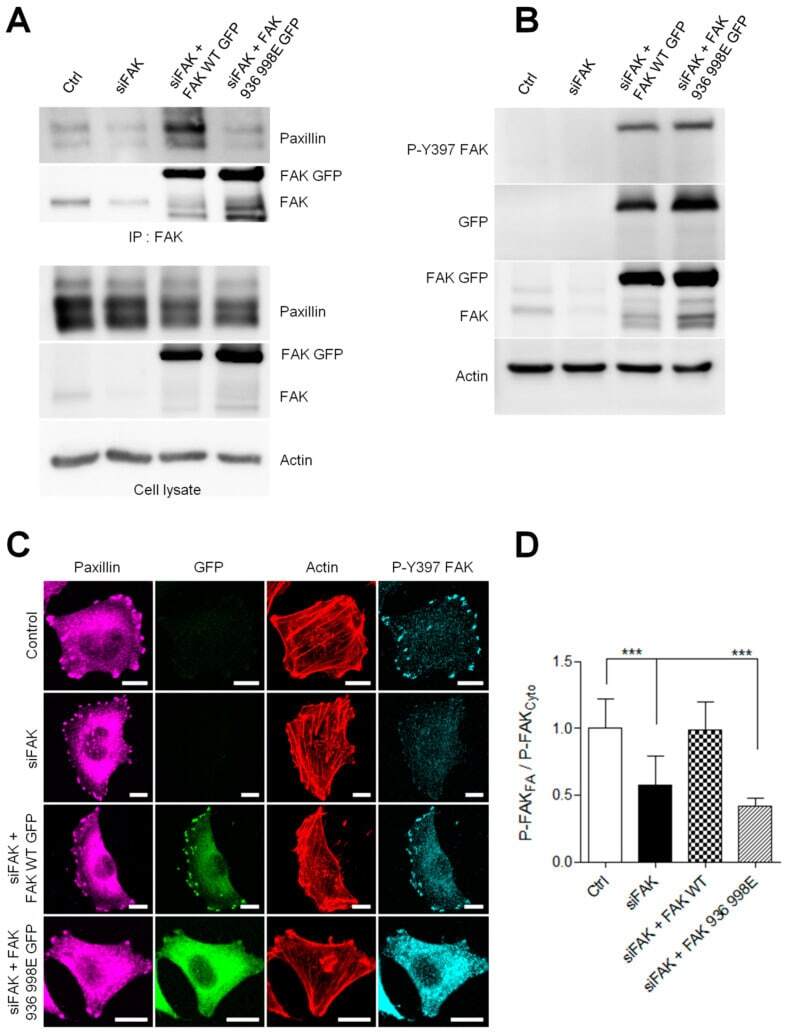
- Figure 6 FAK-paxillin interaction conditions FAK localization to FA. ( A ) Cell extracts from A375 melanoma cells transiently co-transfected with siFAK and wild-type FAK-GFP or FAK-I936/I998-GFP were analyzed by immunoprecipitation (IP) using anti-FAK Ab and blotted for paxillin and FAK. The expression level of proteins in the corresponding cell lysate is shown. ( B ) Representative Western blot showing A375 melanoma cells transfected as described above and blotted for P-Y397 FAK, FAK total, eGFP and actin. ( C ) Cells transiently co-transfected with siFAK and wild-type FAK-GFP or FAK-I936/I998-GFP were fixed and labelled for paxillin (purple), actin (red) and P-Y397 FAK (cyan). Scale bar: 10 um. ( D ) Histograms represent the mean normalized to control +- SD of FAK localization in melanoma cells. Signals were measured by reporting the P-FAK signal in FA over that in the cytoplasm from 3 independent experiments ***, p < 0.001; unpaired t -test compared to control condition.
- Submitted by
- Invitrogen Antibodies (provider)
- Main image
- Experimental details
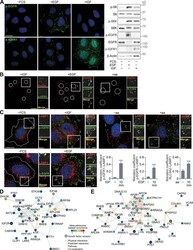
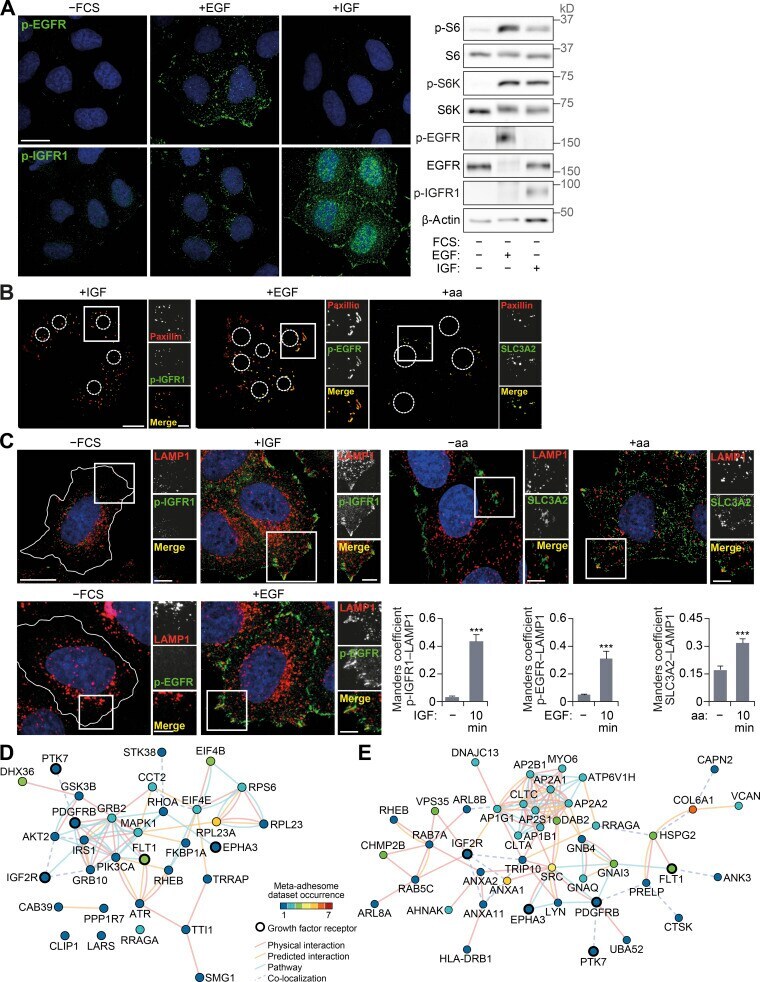
- Figure S4. Growth factor activation at FAs. (A) HeLa cells FCS starved for 18 h (-FCS) or starved and stimulated with EGF or IGF for 10 min were analyzed by immunofluorescence (left) and immunoblotting (right). (B) Cells were starved and stimulated with IGF, EGF, or amino acids. FAs remaining on coverslips after removal of cell bodies were immunostained using paxillin and p-IGFR1, p-EGFR, or SLC3A2 antibodies. (C) Cells were starved and stimulated as indicated and immunostained for p-EGFR, p-IGFR1, SLC3A2, and LAMP1, and colocalization at the cell periphery (Manders coefficient) was quantified. (D and E) Interaction network analysis of growth factor receptors and mTOR-associated proteins (D) and lysosome-associated proteins (E) detected in adhesion complex proteomes (meta-adhesome datasets). Proteins (nodes) are annotated with gene names for clarity. Error bars represent SEM; n = 3 independent experiments. Scale bars, 20 um (insets, 10 um). Nuclei were visualized with DAPI; original localization of nuclei in FA preparations (B) is indicated by dashed circles. For C, ***, P < 0.001; two-sided Student's t test.
- Submitted by
- Invitrogen Antibodies (provider)
- Main image
- Experimental details
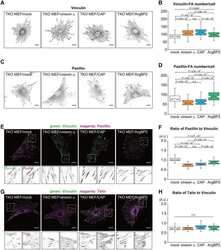
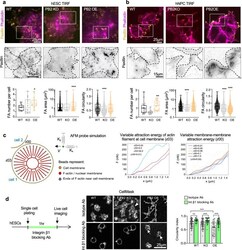
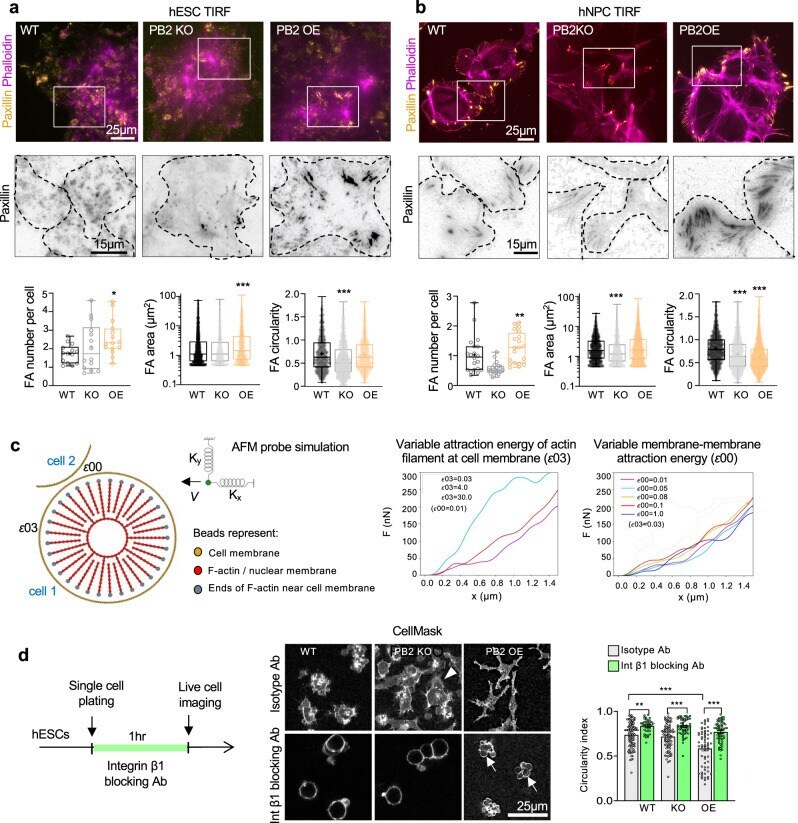
- Fig. 5 Plexin-B2 influences cell-matrix adhesion and controls contractility in hESC colonies. a , b TIRF microscopy images and quantification show altered number, size, and shape of focal adhesions (FAs) in PLXNB2 mutant hESC colonies ( a ) and hNPCs ( b ) compared to wild-type (WT) cells. Cells were stained for FA marker paxillin and F-actin (phalloidin). Enlarged images of boxed areas are shown below in inverted black and white, with dashed lines outlining individual cells. Box plots depict 25-75% quantiles, minimal and maximal values (whiskers), median (midline), and mean (cross signs). For hESCs: FA number, n = 14-15 cells per group. FA area, n = 2271 FAs for WT, n = 1042 for PB2 KO, and n = 978 for PB2 OE. FA circularity, n = 1042 FAs for WT, n = 1042 for PB2 KO, and n = 978 for PB2 OE. * P = 0.0397, *** P < 0.0001. For hNPCs: FA number, n = 20 cells per group. FA area and circularity, n = 1829 FAs for WT, n = 2385 for PB2 KO, and n = 4528 for PB2 OE. Kruskal-Wallis test followed by Dunn's multiple comparisons test. ** P = 0.0084, *** P < 0.0001. c Molecular dynamics mathematical simulation. Left, components of simulation based on a bead-spring model. The tip of the simulated AFM probe is depicted as a green sphere, with elastic constants K x and K y in the x and y directions, respectively. Right, graphs of force as a function of distance traveled by the simulated AFM probe in two different scenarios. Left, when varying the actin-membrane attraction energy that simulates
- Submitted by
- Invitrogen Antibodies (provider)
- Main image
- Experimental details
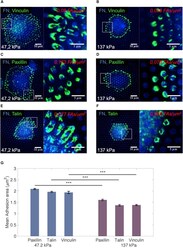
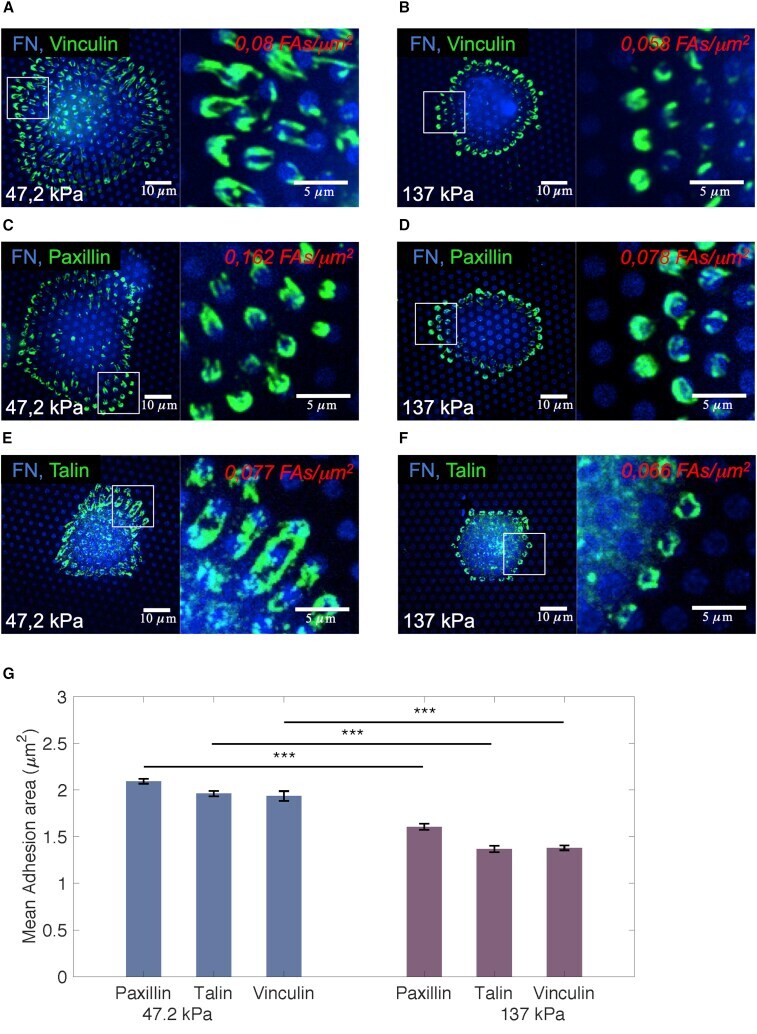
- Figure 4 Cell-Matrix Adhesion Area of PCs (dif31) Placed on PDMS Micropillar Arrays of High (137 kPa) and Intermediate (47.2kPa) Stiffness (A-F) Confocal immunofluorescence images of PCs (dif31) seeded on PDMS micropillar arrays of two different stiffness (137 and 47.2 kPa), functionalized with FN (blue). Cells were stained for vinculin (A and B), paxillin (C and D), and talin (E and F) (green). (G) Average cell-matrix adhesion area of PC cells on PDMS micropillar arrays with 137 kPa stiffness (right) and 47.2 kPa (left), after 4 h of incubation. All error bars are SEM derived from two independent experiments performed with a minimum of two replicates. At least 30 cells were analyzed from each sample. NS, p > 0.05, * p < 0.05, ** p < 0.005, *** p < 0.0005 according to the Mann-Whitney test. See also Figure S3 .
- Submitted by
- Invitrogen Antibodies (provider)
- Main image
- Experimental details
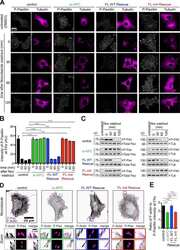
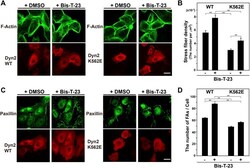
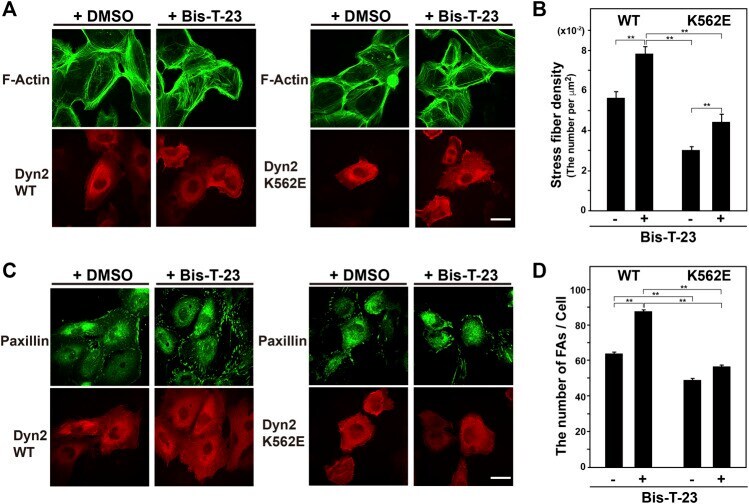
- FIGURE 3 Stress fibers and focal adhesions increase in Bis-T-23-treated HPCs. (A) Double-immunofluorescence of V5-tagged dynamin 2 (Dyn2)-WT or K562E (bottom panels) and actin filaments (top panels) in Bis-T-23-treated (50 muM) HPCs and corresponding solvent controls (DMSO). Scale bar: 20 mum. (B) Stress fiber density in Bis-T-23-treated dynamin 2-WT- or K562E-expressing HPCs. Data are means +- S.E.M. of 35 cells (dynamin 2-WT/DMSO), 33 cells (dynamin 2-WT/Bis-T-23), 38 cells (dynamin 2-K562E/DMSO) or 35 cells (dynamin 2-K562E/Bis-T-23) from three independent experiments. (** p < 0.01). (C) Double-immunofluorescence of V5-tagged dynamin 2-WT or K562E (bottom panels) and paxillin (top panels) in Bis-T-23-treated (50 muM) HPCs and corresponding solvent controls (DMSO). Scale bar; 20 mum. (D) Number of focal adhesions in Bis-T-23-treated dynamin 2-WT- or K562E-expressing HPCs. Data are means +- S.E.M. of 35 cells (dynamin 2-WT/DMSO), 32 cells (dynamin 2-WT/Bis-T-23), 35 cells (dynamin 2-K562E/DMSO) or 34 cells (dynamin 2-K562E/Bis-T-23) from three independent experiments. (** p < 0.01). more than 32 cells from three independent experiments. (** p < 0.01).
- Submitted by
- Invitrogen Antibodies (provider)
- Main image
- Experimental details
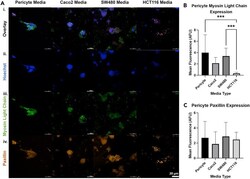
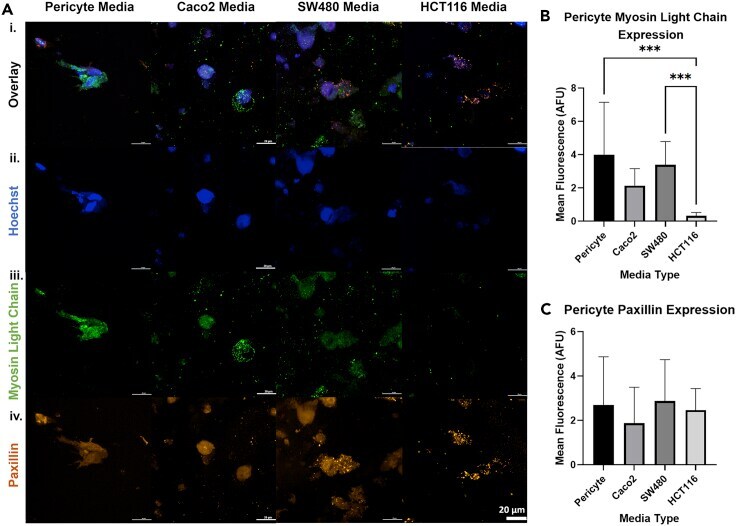
- Pericytes Exhibit a Relaxed Phenotype in Response to CRC-Secreted Factors CRC-derived factors promote pericyte relaxation and changes in cell-matrix interactions. (an i-iv) Representative images of pericytes stained for phosphorylated myosin light chain (green, iii. ), paxillin (orange, iv. ), and cell nuclei (blue, ii.) after three days of culture in conditioned media. (B) Fluorescence quantification of p -MLC. Phosphorylation of myosin light chain decreases significantly in pericytes exposed to HCT116 CM as compared to control conditions. (C) Fluorescence quantification of paxillin. No significant change in paxillin expression was observed for any condition, despite visual differences in staining patterns. Scale bar 20 mum. Significance: ***p < 0.001. Data are represented as mean +- SEM
- Submitted by
- Invitrogen Antibodies (provider)
- Main image
- Experimental details
- Figure 1. Nup93 modulates triple-negative, claudin-low BCC migration through actin cytoskeleton (AC) remodeling. (A, B, C, D, E, F) NUP93 KD induces dramatic changes to the cytoskeleton, including thinning of the cortical actin layer (A, B) ( t test with P < 0.05, N >= 8 independent regions in three biological replicates, data normalized to ctrl cells), increase in paxillin foci (C, D) ( t test with P < 0.001, N >= 4 independent regions in three biological replicates, data normalized to ctrl cells), and formation of a dense network of actin stress fibers (E, F) (details of single cells). Images and intensity profiles are representative of each specific condition. Scale bars: 10 mum for (A, C) and 5 mum for (E, F). (G, H) Partial rescue of Nup93 limits the expression of the stress fiber-related protein LIMCH1. Representative images and intensity profiles. Scale bars: 10 mum. (I, L) NUP93 KD impairs breast cancer cell 3D migration. (I, J, K) Schematic of the microfluidic assay for 3D single cell tracking (I) and quantification of cell migration (J) ( t test with P < 0.001, N >= 100 single cells tracked per condition in three biological replicates, data normalized to ctrl cells) and adhesion (K) ( t test with P = 0.07, N >= 25 independent regions in three biological replicates, data normalized to ctrl cells). (L) Rescue of Nup93 partially restored cell migration (L) (ANOVA test with P < 0.05 [*] and P < 0.01 [**], N >= 120 single cells tracked per condition in three biological r
