Explore
 Validate
 Learn
Learn Western blot
Antibody data
- Antibody Data
- Antigen structure
- References [0]
- Comments [0]
- Validations
- Western blot [2]
- Immunohistochemistry [2]
- Chromatin Immunoprecipitation [2]
Submit
Validation data
Reference
Comment
Report error
- Product number
- 710094 - Provider product page

- Provider
- Invitrogen Antibodies
- Product name
- Phospho-STAT5 alpha (Tyr694) Recombinant Polyclonal Antibody (6HCLC)
- Antibody type
- Polyclonal
- Antigen
- Synthetic peptide
- Reactivity
- Human
- Host
- Rabbit
- Isotype
- IgG
- Antibody clone number
- 6HCLC
- Vial size
- 100 µg
- Concentration
- 0.5 mg/mL
- Storage
- Store at 4°C short term. For long term storage, store at -20°C, avoiding freeze/thaw cycles.
No comments: Submit comment
Supportive validation
- Submitted by
- Invitrogen Antibodies (provider)
- Main image
- Experimental details
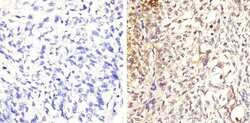
- Western blot analysis of Phospho-STAT5 alpha pTyr694 in Jurkat whole cell extracts using a Phospho-STAT5 alpha pTyr694 Recombinant Rabbit Polyclonal Antibody (Product # 710094) at a dilution of 2.5 µg/mL. To confirm specificity, competition was performed by preincubation with the phosphopeptide to inhibit antibody binding (lane 2). Results show a band at ~90kDa.

- Submitted by
- Invitrogen Antibodies (provider)
- Main image

- Experimental details
- Western blot analysis of Phospho-STAT5 alpha pTyr694 in Jurkat whole cell extracts using a Phospho-STAT5 alpha pTyr694 Recombinant Rabbit Polyclonal Antibody (Product # 710094) at a dilution of 2.5 µg/mL. To confirm specificity, competition was performed by preincubation with the phosphopeptide to inhibit antibody binding (lane 2). Results show a band at ~90kDa.
Supportive validation
- Submitted by
- Invitrogen Antibodies (provider)
- Main image
- Experimental details
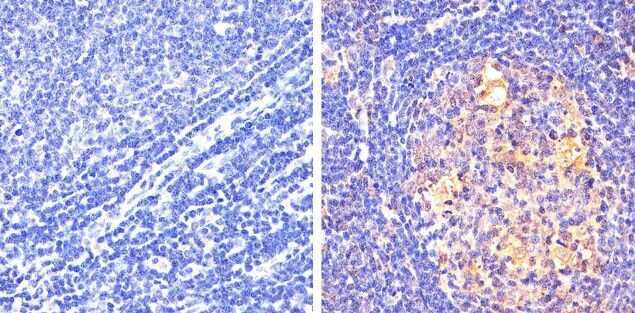
- Immunohistochemistry analysis of STAT5 Alpha (pY694) showing staining in the cytoplasm and nucleus of paraffin-embedded human diffuse large B cell lymphoma (right) compared to a negative control without primary antibody (left). To expose target proteins, antigen retrieval was performed using 10mM sodium citrate (pH 6.0), microwaved for 8-15 min. Following antigen retrieval, tissues were blocked in 3% H2O2-methanol for 15 min at room temperature, washed with ddH2O and PBS, and then probed with a STAT5 Alpha (pY694) Recombinant Rabbit Polyclonal Antibody, (clone 6HCLC) (Product # 710094) diluted in 3% BSA-PBS at a dilution of 1:20 overnight at 4°C in a humidified chamber. Tissues were washed extensively in PBST and detection was performed using an HRP-conjugated secondary antibody followed by colorimetric detection using a DAB kit. Tissues were counterstained with hematoxylin and dehydrated with ethanol and xylene to prep for mounting.
- Submitted by
- Invitrogen Antibodies (provider)
- Main image
- Experimental details
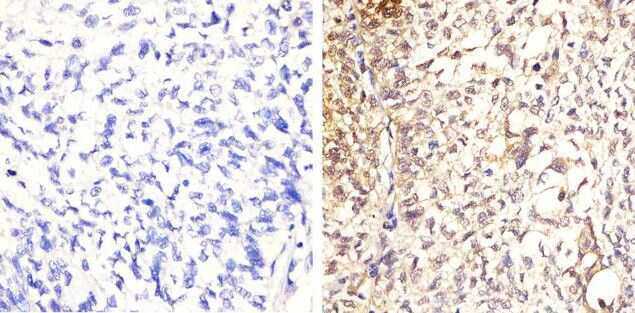
- Immunohistochemistry analysis of STAT5 Alpha (pY694) showing staining in the cytoplasm and nucleus of paraffin-embedded human lung squamous carcinoma (right) compared to a negative control without primary antibody (left). To expose target proteins, antigen retrieval was performed using 10mM sodium citrate (pH 6.0), microwaved for 8-15 min. Following antigen retrieval, tissues were blocked in 3% H2O2-methanol for 15 min at room temperature, washed with ddH2O and PBS, and then probed with a STAT5 Alpha (pY694) Recombinant Rabbit Polyclonal Antibody, (clone 6HCLC) (Product # 710094) diluted in 3% BSA-PBS at a dilution of 1:20 overnight at 4°C in a humidified chamber. Tissues were washed extensively in PBST and detection was performed using an HRP-conjugated secondary antibody followed by colorimetric detection using a DAB kit. Tissues were counterstained with hematoxylin and dehydrated with ethanol and xylene to prep for mounting.
Supportive validation
- Submitted by
- Invitrogen Antibodies (provider)
- Main image
- Experimental details
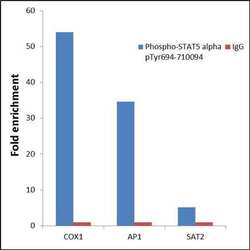
- Enrichment of endogenous STAT5 alpha pTyr694 protein at specific gene loci using Anti-Phospho-STAT5 alpha pTyr694 Recombinant Rabbit Polyclonal Antibody: Chromatin Immunoprecipitation (ChIP) was performed using Anti-Phospho-STAT5 alpha pTyr694 Recombinant Rabbit Polyclonal Antibody (Product # 710094, 5 µg) on sheared chromatin from 2 million HeLa cells treated with 100 ng/mL of IFN gamma for 45 minutes using the "MAGnify ChIP system" kit (Product # 49-2024). Normal Rabbit IgG was used as a negative IP control. The purified DNA was analyzed by 7500 Fast qPCR system (Product # 4351106) with optimized PCR primer pairs for the promoter of active COX1, AP1 gene, used as positive control target, and the SAT2, used as negative control target. Data is presented as fold enrichment of the antibody signal versus the negative control IgG using the comparative CT method.

- Submitted by
- Invitrogen Antibodies (provider)
- Main image
- Experimental details
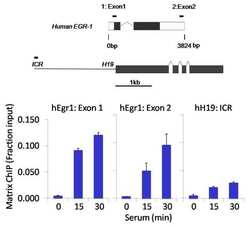
- Chromatin immunoprecipitation analysis of Phospho-STAT5 alpha (pTyr694) was performed using cross-linked chromatin from 1 x 10^6 HCT116 human colon carcinoma cells treated with serum for 0, 15, and 30 minutes. Immunoprecipitation was performed using a multiplex microplate Matrix ChIP assay (see reference for Matrix ChIP protocol: http://www.ncbi.nlm.nih.gov/pubmed/22098709) with 1.0 µL/100 µL well volume of a Phospho-STAT5 alpha (pTyr694) Recombinant Rabbit Polyclonal Antibody (Product # 710094). Chromatin aliquots from ~1 x 10^5 cells were used per ChIP pull-down. Quantitative PCR data were done in quadruplicate using 1 µL of eluted DNA in 2 µL SYBR real-time PCR reactions containing primers to amplify exon-1 or exon-2 of human Egr-1, or the imprinting control region (ICR) of the human H19 locus. PCR calibration curves were generated for each primer pair from a dilution series of sheared total genomic DNA. Quantitation of immunoprecipitated chromatin is presented as signal relative to the total amount of input chromatin. Results represent the mean +/- SEM for three experiments. A schematic representation of the human Egr-1 and H19 loci are shown above the data where boxes represent exons (black boxes = translated regions, white boxes = UTRs), the zigzag lines represent introns, and the straight line represents upstream sequence. Regions amplified by Egr-1 and H19 primers are represented by black bars. Data courtesy of the Innovators Program.