Explore
 Validate
 Learn
Learn Flow cytometry
Antibody data
- Antibody Data
- Antigen structure
- References [13]
- Comments [0]
- Validations
- Flow cytometry [1]
- Other assay [6]
Submit
Validation data
Reference
Comment
Report error
- Product number
- 17-9010-41 - Provider product page

- Provider
- Invitrogen Antibodies
- Product name
- Phospho-STAT5 (Tyr694) Monoclonal Antibody (SRBCZX), APC, eBioscience™
- Antibody type
- Monoclonal
- Antigen
- Other
- Description
- Description: This SRBCZX monoclonal antibody recognizes signal transducer and activator of transcription 5 (STAT5) when phosphorylated on tyrosine 694. STAT proteins are activated by ligand binding to receptors, such as cytokine receptors, that associate with Janus kinase (JAK) family members. Following their phosphorylation by JAKs, STAT proteins translocate to the nucleus where they bind to DNA and regulate transcription of specific genes in a cell type- and cytokine-specific manner. In response to cytokines that signal through the common gamma chain such as IL-2, IL-7, and IL-15, STAT5 is phosphorylated on tyrosine 694 by JAK1 and JAK3. Cytokines such as IL-3, IL-5, and GM-CSF that signal via the common beta chain induce STAT5 phosphorylation on tyrosine 694 by JAK 2. Phosphorylation of STAT5 on tyrosine 694 is essential for STAT5 dimer formation, nuclear translocation, and DNA binding activity. Specificity of this SRBCZX clone was determined by ELISA and flow cytometry. Applications Reported: This SRBCZX antibody has been reported for use in intracellular staining followed by flow cytometric analysis. Applications Tested: This SRBCZX antibody has been pre-titrated and tested by intracellular staining followed by flow cytometric analysis of stimulated normal peripheral blood cells. This can be used at 5 µL (0.25 µg) per test. A test is defined as the amount (µg) of antibody that will stain a cell sample in a final volume of 100 µL. Cell number should be determined empirically but can range from 10^5 to 10^8 cells/test. Staining Protocol: We recommend using Protocol C: Two-step protocol: Fixation/Methanol. Protocol A: Two-step protocol: intracellular (cytoplasmic) proteins and Protocol B: One-step protocol: intracellular (nuclear) proteins cannot be used. All Protocols can be found in the Flow Cytometry Protocols: "Staining Intracellular Antigens for Flow Cytometry Protocol" located in the Best Protocols Section under the Resources tab online. Excitation: 633-647 nm; Emission: 660 nm; Laser: Red Laser. Filtration: 0.2 µm post-manufacturing filtered.
- Reactivity
- Human, Mouse
- Host
- Mouse
- Isotype
- IgG
- Antibody clone number
- SRBCZX
- Vial size
- 25 Tests
- Concentration
- 5 µL/Test
- Storage
- 4° C, store in dark, DO NOT FREEZE!
Submitted references GRIM19 Impedes Obesity by Regulating Inflammatory White Fat Browning and Promoting Th17/Treg Balance.
Expansion of Group 2 Innate Lymphoid Cells in Patients with End-Stage Renal Disease and Their Clinical Significance.
Dissociating STAT4 and STAT5 Signaling Inhibitory Functions of SOCS3: Effects on CD8 T Cell Responses.
Differential Roles of IL-2 Signaling in Developing versus Mature Tregs.
Receptor-mediated dimerization of JAK2 FERM domains is required for JAK2 activation.
Identification of inhibitors of myeloid-derived suppressor cells activity through phenotypic chemical screening.
Erythropoietin enhances Kupffer cell number and activity in the challenged liver.
Expression and function of hematopoiesis-stimulating factor receptors on the GPI(-) and GPI(+) hematopoietic stem cells of patients with paroxysmal nocturnal hemoglobinuria/aplastic anemia syndrome.
Monomethylarsonous acid (MMA+3) Inhibits IL-7 Signaling in Mouse Pre-B Cells.
Murine iPSC-Derived Macrophages as a Tool for Disease Modeling of Hereditary Pulmonary Alveolar Proteinosis due to Csf2rb Deficiency.
Ebf1 and c-Myb repress rag transcription downstream of Stat5 during early B cell development.
Interleukin-2 and STAT5 in regulatory T cell development and function.
A role for STAT5A/B in protection of peripheral T-lymphocytes from postactivation apoptosis: insights from gene expression profiling.
Jhun J, Woo JS, Lee SH, Jeong JH, Jung K, Hur W, Lee SY, Ryu JY, Moon YM, Jung YJ, Song KY, Chang K, Yoon SK, Park SH, Cho ML
Cells 2021 Jan 15;10(1)
Cells 2021 Jan 15;10(1)
Expansion of Group 2 Innate Lymphoid Cells in Patients with End-Stage Renal Disease and Their Clinical Significance.
Liu GY, Deng XH, Li X, Cao YJ, Xing YF, Zhou P, Lei AH, Yang Q, Deng K, Zhang H, Zhou J
Journal of immunology (Baltimore, Md. : 1950) 2020 Jul 1;205(1):36-44
Journal of immunology (Baltimore, Md. : 1950) 2020 Jul 1;205(1):36-44
Dissociating STAT4 and STAT5 Signaling Inhibitory Functions of SOCS3: Effects on CD8 T Cell Responses.
Hwang JY, Holland JE, Valenteros KB, Sun Y, Usherwood YK, Verissimo AF, McLellan JS, Grigoryan G, Usherwood EJ
ImmunoHorizons 2019 Nov 20;3(11):547-558
ImmunoHorizons 2019 Nov 20;3(11):547-558
Differential Roles of IL-2 Signaling in Developing versus Mature Tregs.
Fan MY, Low JS, Tanimine N, Finn KK, Priyadharshini B, Germana SK, Kaech SM, Turka LA
Cell reports 2018 Oct 30;25(5):1204-1213.e4
Cell reports 2018 Oct 30;25(5):1204-1213.e4
Receptor-mediated dimerization of JAK2 FERM domains is required for JAK2 activation.
Ferrao RD, Wallweber HJ, Lupardus PJ
eLife 2018 Jul 25;7
eLife 2018 Jul 25;7
Identification of inhibitors of myeloid-derived suppressor cells activity through phenotypic chemical screening.
Schröder M, Loos S, Naumann SK, Bachran C, Krötschel M, Umansky V, Helming L, Swee LK
Oncoimmunology 2017;6(1):e1258503
Oncoimmunology 2017;6(1):e1258503
Erythropoietin enhances Kupffer cell number and activity in the challenged liver.
Gilboa D, Haim-Ohana Y, Deshet-Unger N, Ben-Califa N, Hiram-Bab S, Reuveni D, Zigmond E, Gassmann M, Gabet Y, Varol C, Neumann D
Scientific reports 2017 Sep 4;7(1):10379
Scientific reports 2017 Sep 4;7(1):10379
Expression and function of hematopoiesis-stimulating factor receptors on the GPI(-) and GPI(+) hematopoietic stem cells of patients with paroxysmal nocturnal hemoglobinuria/aplastic anemia syndrome.
Fu R, Ding SX, Liu YI, Li LJ, Liu H, Wang HL, Zhang T, Shao ZH
Experimental and therapeutic medicine 2016 May;11(5):1668-1672
Experimental and therapeutic medicine 2016 May;11(5):1668-1672
Monomethylarsonous acid (MMA+3) Inhibits IL-7 Signaling in Mouse Pre-B Cells.
Ezeh PC, Xu H, Lauer FT, Liu KJ, Hudson LG, Burchiel SW
Toxicological sciences : an official journal of the Society of Toxicology 2016 Feb;149(2):289-99
Toxicological sciences : an official journal of the Society of Toxicology 2016 Feb;149(2):289-99
Murine iPSC-Derived Macrophages as a Tool for Disease Modeling of Hereditary Pulmonary Alveolar Proteinosis due to Csf2rb Deficiency.
Mucci A, Kunkiel J, Suzuki T, Brennig S, Glage S, Kühnel MP, Ackermann M, Happle C, Kuhn A, Schambach A, Trapnell BC, Hansen G, Moritz T, Lachmann N
Stem cell reports 2016 Aug 9;7(2):292-305
Stem cell reports 2016 Aug 9;7(2):292-305
Ebf1 and c-Myb repress rag transcription downstream of Stat5 during early B cell development.
Timblin GA, Schlissel MS
Journal of immunology (Baltimore, Md. : 1950) 2013 Nov 1;191(9):4676-87
Journal of immunology (Baltimore, Md. : 1950) 2013 Nov 1;191(9):4676-87
Interleukin-2 and STAT5 in regulatory T cell development and function.
Mahmud SA, Manlove LS, Farrar MA
JAK-STAT 2013 Jan 1;2(1):e23154
JAK-STAT 2013 Jan 1;2(1):e23154
A role for STAT5A/B in protection of peripheral T-lymphocytes from postactivation apoptosis: insights from gene expression profiling.
Gatzka M, Piekorz R, Moriggl R, Rawlings J, Ihle JN
Cytokine 2006 May;34(3-4):143-54
Cytokine 2006 May;34(3-4):143-54
No comments: Submit comment
Supportive validation
- Submitted by
- Invitrogen Antibodies (provider)
- Main image
- Experimental details
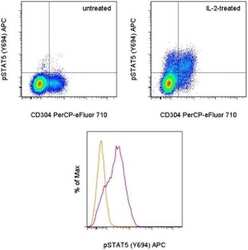
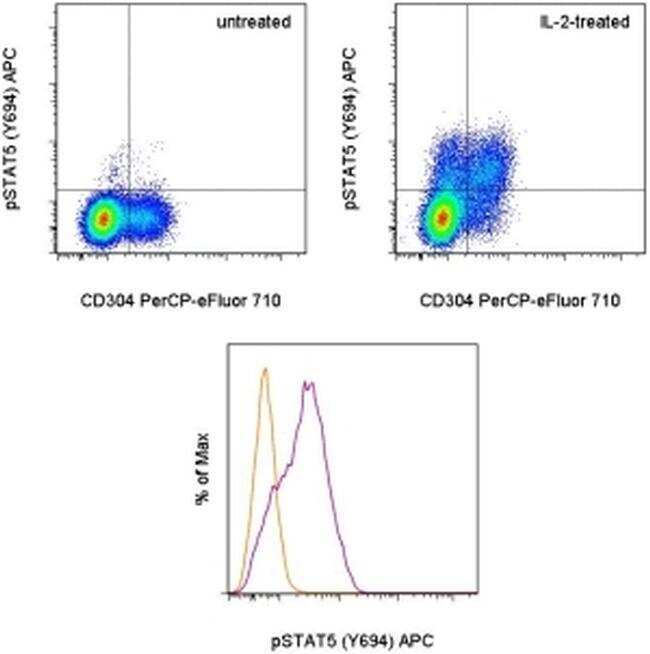
- TOP: Intracellular staining of untreated (left) or 15-minute IL-2-treated (right) mouse splenocytes with Anti-Mouse CD304 (Neuropilin-1) PerCP-eFluor® 710 (Product # 46-3041-82) and Anti-Human/Mouse phospho-STAT5 (Y694) APC. CD4+ cells in the lymphocyte gate were used for analysis. BOTTOM: Intracellular staining of untreated (orange histogram) or 15-minute IL-2-treated (purple histogram) mouse splenocytes with Anti-Human/Mouse phospho-STAT5 (Y694) APC. CD4+CD304+ cells in the lymphocyte gate were used for analysis. In both panels, cells were stained using the Fixation/Methanol protocol.
Supportive validation
- Submitted by
- Invitrogen Antibodies (provider)
- Main image
- Experimental details
- NULL

- Submitted by
- Invitrogen Antibodies (provider)
- Main image
- Experimental details
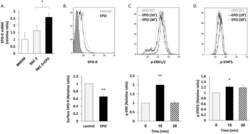
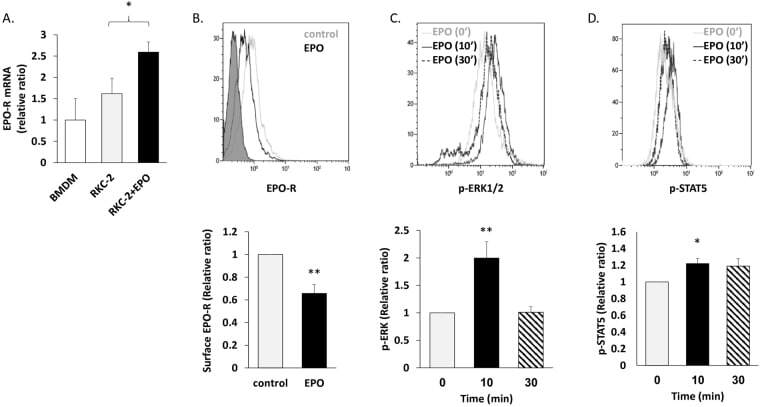
- Figure 1 EPO regulates EPO-R expression and elicits downstream signalling in RKC-2 cells. All graphs represent mean +- SEM. ( A-B) RKC-2 cells were cultured in the presence or absence of 5 U/ml EPO for 24 h. ( A ) EPO-R transcript levels were evaluated by RT-PCR, N = 5-8, *p < 0.05. Rat BMDM (positive control) were considered as 1. ( B ) EPO-R surface expression was evaluated by flow cytometry. Top: Grey and black line histograms depict surface EPO-R in control (considered as 1) and EPO-treated cells, respectively. Full histogram depicts FITC conjugated Goat anti mouse antibody. Bottom: Quantification of surface EPO-R, N = 7, **p < 0.01. ( C-D ) RKC-2 cells were stimulated for 0, 10 and 30 min with 10 U/ml EPO. Top: Grey, black and dashed histograms represent 0, 10 and 30 min EPO-treated cells, respectively. Bottom: The graphs depict quantification of mean fluorescence intensity (MFI) of flow cytometry analysis for p-ERK1/2 and p-STAT5, ( C ) and ( D ), respectively. Levels at 0 min were considered as 1, N = 4-5, **p < 0.01, *p < 0.05.
- Submitted by
- Invitrogen Antibodies (provider)
- Main image

- Experimental details
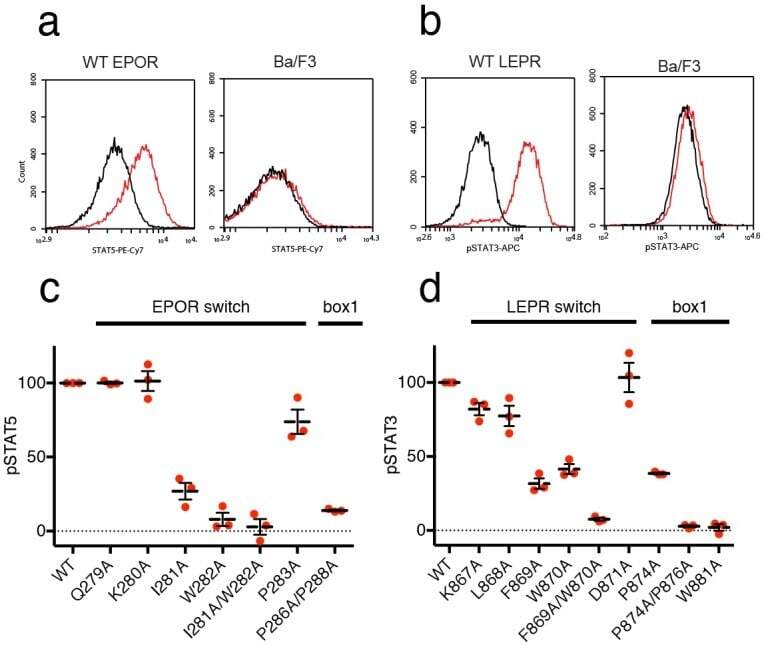
- Figure 5. EPOR and LEPR switch residues are required for Epo and Leptin-induced STAT phosphorylation. ( a,b ) Stable Ba/F3 cell lines expressing wild-type, full length mouse EPOR or LEPR were generated and analyzed for STAT phosphorylation by flow cytometry after stimulation with EPO or leptin. ( a ) Representative plots comparing phospho-STAT5 staining of parental Ba/F3 cells or Ba/F3 cells expressing EPOR. Cells were stimulated with 1 nM mouse EPO for 15 min before fixation, staining, and analysis. ( b ) Representative plots comparing phospho-STAT3 staining of parental Ba/F3 cells or Ba/F3 cells expressing LEPR. Cells were stimulated with 100 pM mouse Leptin for 4 hr prior to fixation, staining, and analysis. ( c ) Analysis of STAT5 phosphorylation by flow cytometry for EPOR wild-type, switch region, and box1 mutants, stimulated with 1 nM EPO as in ( a ). Mean levels of STAT5 phosphorylation were assessed in three separate experiments, with wild-type signal representing 100% in all three experiments. ( d ) Analysis of STAT3 phosphorylation by flow cytometry for LEPR wild-type, switch region, and box1 mutants, stimulated with 100 pM Leptin, as in ( b ). Mean levels of STAT3 phosphorylation was assessed in three separate experiments, with wild-type signal representing 100% in all three experiments. Error bars represent standard error of the mean (SEM). Figure 5--figure supplement 1. Analysis of Ba/F3 stable cell lines expressing EPOR or LEPR mutants. ( a ) Alignment of human
- Submitted by
- Invitrogen Antibodies (provider)
- Main image

- Experimental details
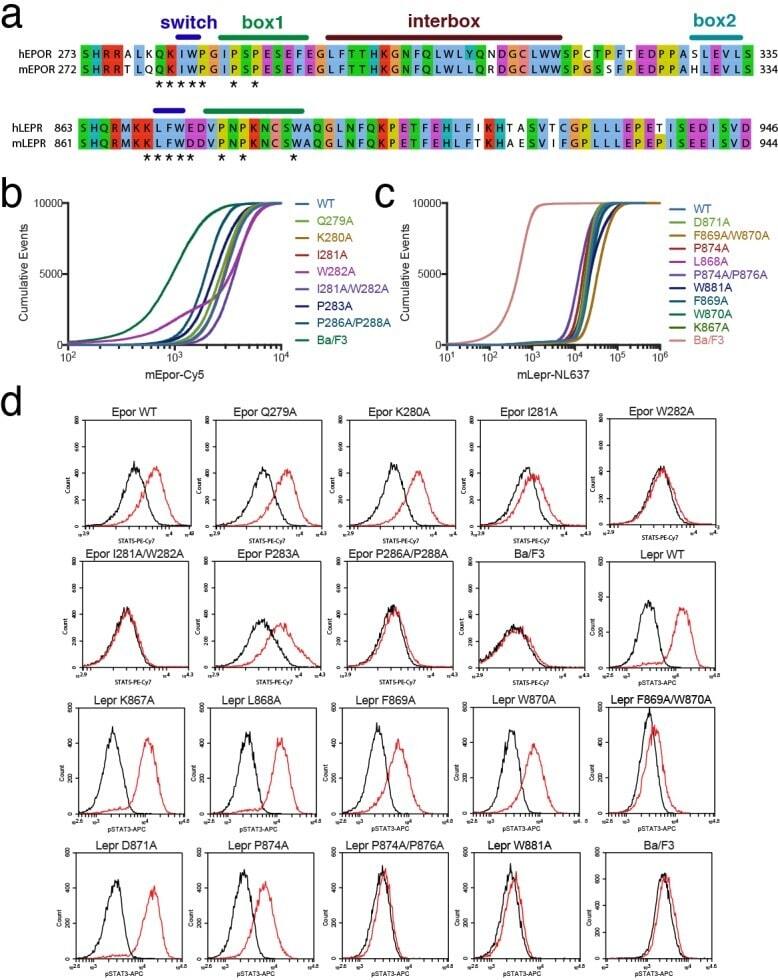
- Figure 5--figure supplement 1. Analysis of Ba/F3 stable cell lines expressing EPOR or LEPR mutants. ( a ) Alignment of human and mouse sequences for EPOR and LEPR. Note the numbering differences for mouse versus human (minus one residue for EPOR and minus two residues for LEPR). Residues in the switch region and box1, which are mutated in our experiments, are completely conserved between human and mouse. ( b-c ) Receptor surface staining for stable cell lines expressing ( b ) EPOR variants and ( c ) LEPR variants. Plots represent cumulative events (Y axis) at or below a given staining level (X axis). ( d ) Representative raw flow cytometry histograms showing the phospho-STAT5 (EPOR) or phospho-STAT3 (LEPR) staining in unstimulated cells (black trace) or cells stimulated with cytokine (red trace) as described in Materials and methods.
- Submitted by
- Invitrogen Antibodies (provider)
- Main image
- Experimental details
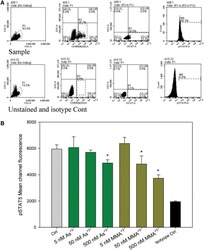
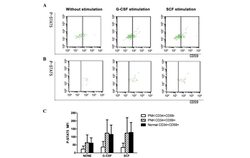
- Figure 3. The P-STAT5 MFI in the (A) GPI + cells and GPI - cells of PNH/AA patients and (B) GPI + cells of normal controls with or without stimulation by G-CSF or SCF. (C) The MFI of P-STAT5 in GPI + and GPI - cells of the bone marrow before and after G-CSF or SCF stimulation. G-CSF, granulocyte colony-stimulating factor; SCF, stem cell factor; P-STAT5, phosphorylated signal transducer and activator of transcription 5; MFI, mean fluorescence intensity; GPI, glycophosphatidylinositol; PNH, paroxysmal nocturnal hemoglobinuria; CD, cluster of differentiation.

- Submitted by
- Invitrogen Antibodies (provider)
- Main image

- Experimental details
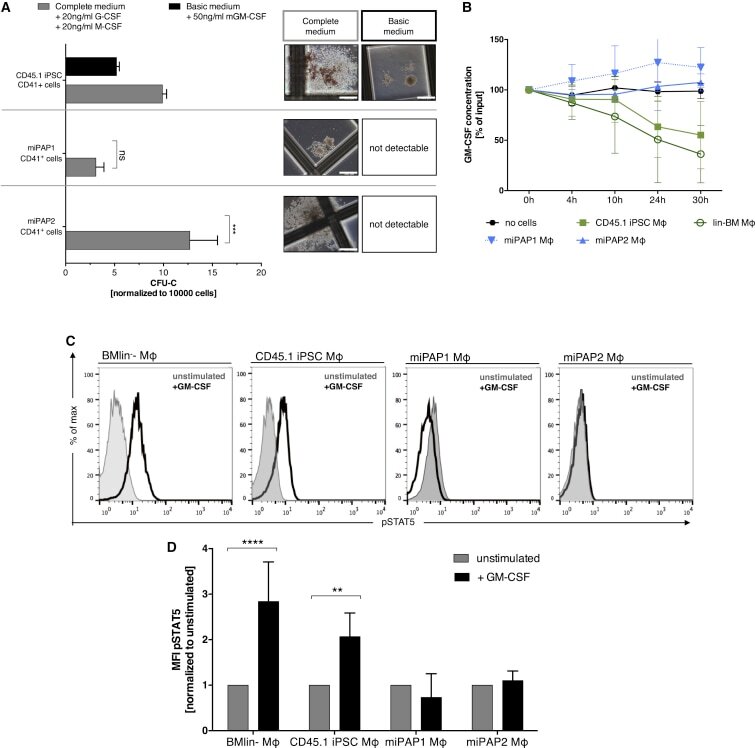
- Figure 6 Disease Modeling of herPAP Using miPAP iPSCs (A) Number of CD41 + progenitor-derived colonies in methylcellulose-based clonogenic assays employing complete (IL-6, erythropoietin, SCF, IL-3, and supplemented with 20 ng/ml human G-CSF + 20 ng/ml murine GM-CSF) or basic medium (50 ng/ml murine GM-CSF only; independent experiments, n = 3 miPAP1 and 2, n = 2 CD45.1 iPSC, mean +- SD) and representative pictures of colonies. Scale bars, 500 mum. (B) GM-CSF clearance assay comparing miPAP-Mphi with CD45.1(10.3) iPSC-Mphi, BMlin - -Mphi, and no cells incubated with 2 ng/ml GM-CSF: at indicated time points (0, 4, 10, 24, and 30 hr) GM-CSF concentrations in supernatants were analyzed by ELISA, normalized to 0 hr (independent experiments, n = 3 BMlin - and CD45.1 iPSC, n = 2 miPAP1 and 2, mean +- SD). (C and D) Flow cytometry plots of STAT5 phosphorylation levels upon stimulation with mGM-CSF (C) and (D) summary of mean fluorescence intensity (MFI) data (independent experiments, n = 3 BMlin - and CD45.1 iPSC, n = 2 miPAP1 and 2, mean +- SD). ns, not significant; ** p