Explore
 Validate
 Learn
Learn Western blot
 Immunocytochemistry
Antibody data
- Antibody Data
- Antigen structure
- References [5]
- Comments [0]
- Validations
- Immunocytochemistry [4]
- Flow cytometry [1]
- Other assay [3]
Submit
Validation data
Reference
Comment
Report error
- Product number
- AHO1382 - Provider product page

- Provider
- Invitrogen Antibodies
- Product name
- 4EBP1 Monoclonal Antibody (554R16)
- Antibody type
- Monoclonal
- Antigen
- Recombinant full-length protein
- Reactivity
- Human, Mouse, Rat
- Host
- Mouse
- Isotype
- IgG
- Antibody clone number
- 554R16
- Vial size
- 100 μg
- Concentration
- 0.5 mg/mL
- Storage
- -20°C
Submitted references Inhibition of the autophagic protein ULK1 attenuates axonal degeneration in vitro and in vivo, enhances translation, and modulates splicing.
Polycystin-1 affects cancer cell behaviour and interacts with mTOR and Jak signalling pathways in cancer cell lines.
Effect and molecular mechanism of mTOR inhibitor rapamycin on temozolomide-induced autophagic death of U251 glioma cells.
Induction of genuine autophagy by cationic lipids in mammalian cells.
Butyrate-rich colonic microenvironment is a relevant selection factor for metabolically adapted tumor cells.
Vahsen BF, Ribas VT, Sundermeyer J, Boecker A, Dambeck V, Lenz C, Shomroni O, Caldi Gomes L, Tatenhorst L, Barski E, Roser AE, Michel U, Urlaub H, Salinas G, Bähr M, Koch JC, Lingor P
Cell death and differentiation 2020 Oct;27(10):2810-2827
Cell death and differentiation 2020 Oct;27(10):2810-2827
Polycystin-1 affects cancer cell behaviour and interacts with mTOR and Jak signalling pathways in cancer cell lines.
Papavassiliou KA, Zoi I, Gargalionis AN, Koutsilieris M
Journal of cellular and molecular medicine 2019 Sep;23(9):6215-6227
Journal of cellular and molecular medicine 2019 Sep;23(9):6215-6227
Effect and molecular mechanism of mTOR inhibitor rapamycin on temozolomide-induced autophagic death of U251 glioma cells.
Li B, Zhou C, Yi L, Xu L, Xu M
Oncology letters 2018 Feb;15(2):2477-2484
Oncology letters 2018 Feb;15(2):2477-2484
Induction of genuine autophagy by cationic lipids in mammalian cells.
Man N, Chen Y, Zheng F, Zhou W, Wen LP
Autophagy 2010 May;6(4):449-54
Autophagy 2010 May;6(4):449-54
Butyrate-rich colonic microenvironment is a relevant selection factor for metabolically adapted tumor cells.
Serpa J, Caiado F, Carvalho T, Torre C, Gonçalves LG, Casalou C, Lamosa P, Rodrigues M, Zhu Z, Lam EW, Dias S
The Journal of biological chemistry 2010 Dec 10;285(50):39211-23
The Journal of biological chemistry 2010 Dec 10;285(50):39211-23
No comments: Submit comment
Supportive validation
- Submitted by
- Invitrogen Antibodies (provider)
- Main image

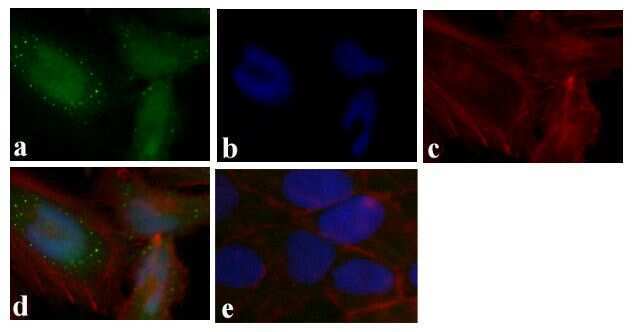
- Experimental details
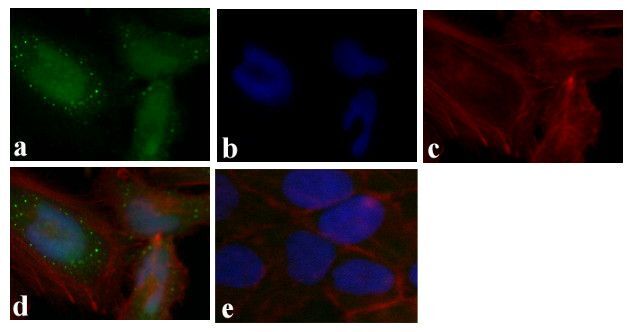
- Immunofluorescent analysis of 4E-BP1 was done on 70% confluent log phase HeLa cells. The cells were fixed with 4% paraformaldehyde for 15 minutes, permeabilized with 0.25% Triton™ X-100 for 10 minutes, and blocked with 5% BSA for 1 hour at room temperature. The cells were labeled with 4E-BP1 Mouse Monoclonal Antibody (Product # AHO1382) at 1:250 dilution in 0.1% BSA and incubated for 3 hours at room temperature and then labeled with Alexa Fluor 488 Rabbit Anti-Mouse IgG Secondary Antibody (Product # A-11059) at a dilution of 1:400 for 30 minutes at room temperature (Panel a: green). Nuclei (Panel b: blue) were stained with SlowFade® Gold Antifade Mountant with DAPI (Product # S36938). F-actin (Panel c: red) was stained with Alexa Fluor 594 Phalloidin (Product # A12381). Panel d is a merged image showing nuclear and perinuclear localization. Panel e shows no primary antibody control. The images were captured at 20X magnification.
- Submitted by
- Invitrogen Antibodies (provider)
- Main image
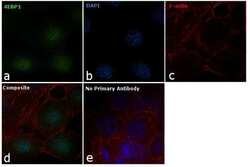
- Experimental details
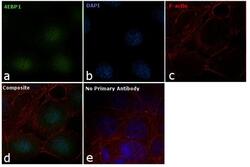
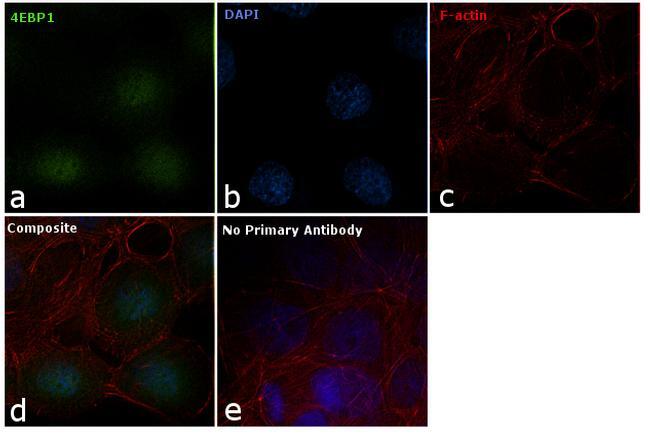
- Immunofluorescence analysis of 4EBP1 was performed using 70% confluent log phase A-431 cells. The cells were fixed with 4% paraformaldehyde for 10 minutes, permeabilized with 0.1% Triton™ X-100 for 10 minutes, and blocked with 1% BSA for 1 hour at room temperature. The cells were labeled with 4EBP1 Monoclonal Antibody (Product # AHO1382) at 1:250 dilution in 0.1% BSA and incubated overnight at 4 degree and then labeled with Goat anti-Mouse IgG (H+L) Superclonal™ Secondary Antibody, Alexa Fluor® 488 conjugate (Product # A28175) at a dilution of 1:2000 for 45 minutes at room temperature (Panel a: green). Nuclei (Panel b: blue) were stained with SlowFade® Gold Antifade Mountant with DAPI (Product # S36938). F-actin (Panel c: red) was stained with Rhodamine Phalloidin (Product # R415, 1:300). Panel d represents the merged image showing nuclear and cytoplasmic localization. Panel e represents control cells with no primary antibody to assess background. The images were captured at 60X magnification.
- Submitted by
- Invitrogen Antibodies (provider)
- Main image

- Experimental details
- Immunofluorescent analysis of 4E-BP1 was done on 70% confluent log phase HeLa cells. The cells were fixed with 4% paraformaldehyde for 15 minutes, permeabilized with 0.25% Triton™ X-100 for 10 minutes, and blocked with 5% BSA for 1 hour at room temperature. The cells were labeled with 4E-BP1 Mouse Monoclonal Antibody (Product # AHO1382) at 1:250 dilution in 0.1% BSA and incubated for 3 hours at room temperature and then labeled with Alexa Fluor 488 Rabbit Anti-Mouse IgG Secondary Antibody (Product # A-11059) at a dilution of 1:400 for 30 minutes at room temperature (Panel a: green). Nuclei (Panel b: blue) were stained with SlowFade® Gold Antifade Mountant with DAPI (Product # S36938). F-actin (Panel c: red) was stained with Alexa Fluor 594 Phalloidin (Product # A12381). Panel d is a merged image showing nuclear and perinuclear localization. Panel e shows no primary antibody control. The images were captured at 20X magnification.
- Submitted by
- Invitrogen Antibodies (provider)
- Main image
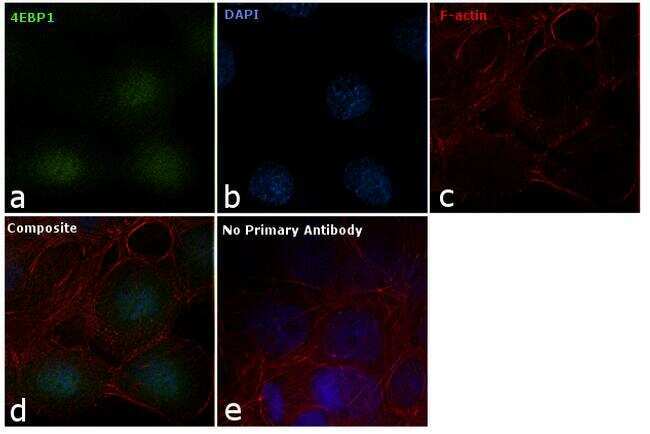
- Experimental details
- Immunofluorescence analysis of 4EBP1 was performed using 70% confluent log phase A-431 cells. The cells were fixed with 4% paraformaldehyde for 10 minutes, permeabilized with 0.1% Triton™ X-100 for 10 minutes, and blocked with 1% BSA for 1 hour at room temperature. The cells were labeled with 4EBP1 Monoclonal Antibody (Product # AHO1382) at 1:250 dilution in 0.1% BSA and incubated overnight at 4 degree and then labeled with Goat anti-Mouse IgG (H+L) Superclonal™ Secondary Antibody, Alexa Fluor® 488 conjugate (Product # A28175) at a dilution of 1:2000 for 45 minutes at room temperature (Panel a: green). Nuclei (Panel b: blue) were stained with SlowFade® Gold Antifade Mountant with DAPI (Product # S36938). F-actin (Panel c: red) was stained with Rhodamine Phalloidin (Product # R415, 1:300). Panel d represents the merged image showing nuclear and cytoplasmic localization. Panel e represents control cells with no primary antibody to assess background. The images were captured at 60X magnification.
Supportive validation
- Submitted by
- Invitrogen Antibodies (provider)
- Main image
- Experimental details
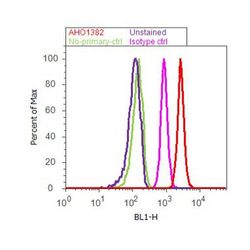
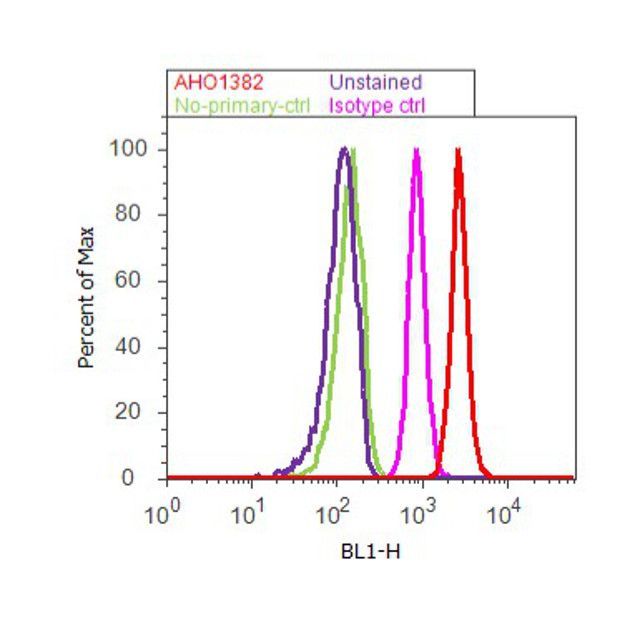
- Flow cytometry analysis of 4E-BP1 was done on HEK-293 cells. Cells were fixed with 70% ethanol for 10 minutes, permeabilized with 0.25% Tritonª X-100 for 20 minutes, and blocked with 5% BSA for 30 minutes at room temperature. Cells were labeled with 4E-BP1 Mouse Monoclonal Antibody (AHO1382, red histogram) or with mouse isotype control (pink histogram) at 3-5 µg/million cells in 2.5% BSA. After incubation at room temperature for 2 hours, the cells were labeled with Alexa Fluor¨ 488 Rabbit Anti-Mouse Secondary Antibody (A11059) at a dilution of 1:400 for 30 minutes at room temperature. The representative 10,000 cells were acquired and analyzed for each sample using an Attune¨ Acoustic Focusing Cytometer. The purple histogram represents unstained control cells and the green histogram represents no-primary-antibody control.
Supportive validation
- Submitted by
- Invitrogen Antibodies (provider)
- Main image

- Experimental details
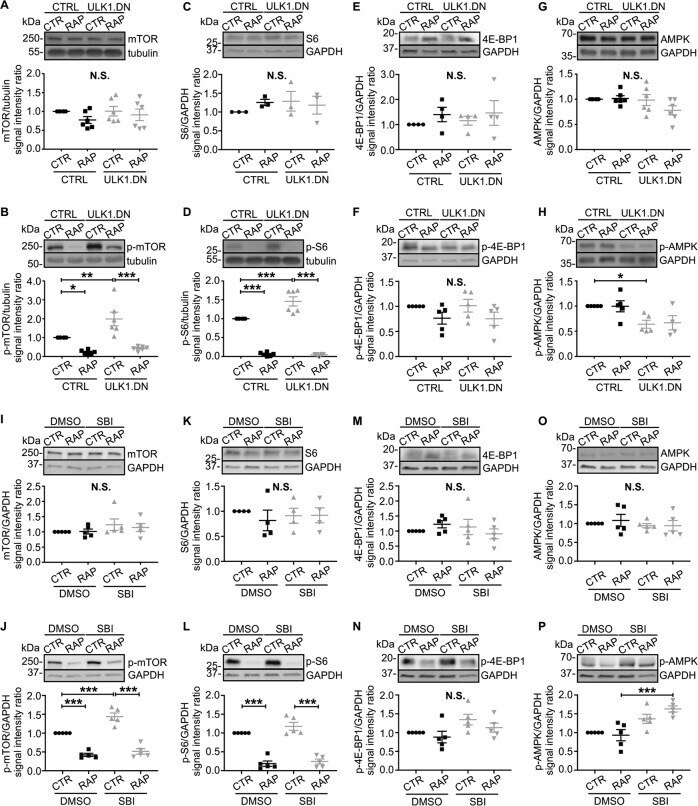
- Fig. 6 Both AAV.ULK1.DN and the ULK1 inhibitor SBI-0206965 enhance mTOR activation. Lysates were obtained from E18 rat cortical neurons on DIV 8 after transduction with AAV.ULK1.DN or AAV.CTRL. Alternatively, cells were treated with the ULK1 inhibitor SBI-0206965 (SBI, 5 muM) or DMSO as control for 30 min before lysis. RAP addition of rapamycin (750 nM) 24 h before lysis. a - h Top: Representative immunoblots of mTOR, p-mTOR, S6, p-S6, 4E-BP1, p-4E-BP1, AMPK, p-AMPK, and the corresponding bands of the loading controls tubulin or GAPDH after transduction with AAV.ULK1.DN or AAV.CTRL are shown. Bottom: Quantifications of the band intensities of mTOR, p-mTOR, p-S6, AMPK (all n = 6 independent cultures), p-4E-BP1 ( n = 5 independent cultures), p-AMPK ( n = 4-5 independent cultures), 4E-BP1 ( n = 4 independent cultures), and S6 ( n = 3 independent cultures) normalized to tubulin or GAPDH as loading controls. CTR control, RAP treated with rapamycin. i-p Top: Representative immunoblots of mTOR, p-mTOR, S6, p-S6, 4E-BP1, p-4E-BP1, AMPK, p-AMPK, and the corresponding bands of the loading control GAPDH after treatment with SBI or DMSO as control are shown. Bottom: Quantifications of the band intensities of mTOR, p-mTOR, p-S6, AMPK, p-AMPK, 4E-BP1, p-4E-BP1 (all n = 5 independent cultures), and S6 ( n = 4 independent cultures) normalized to GAPDH as loading control. CTR control, RAP treated with rapamycin. Data are presented as single data points and means +- SEM. * P < 0.05, ** P < 0.0
- Submitted by
- Invitrogen Antibodies (provider)
- Main image

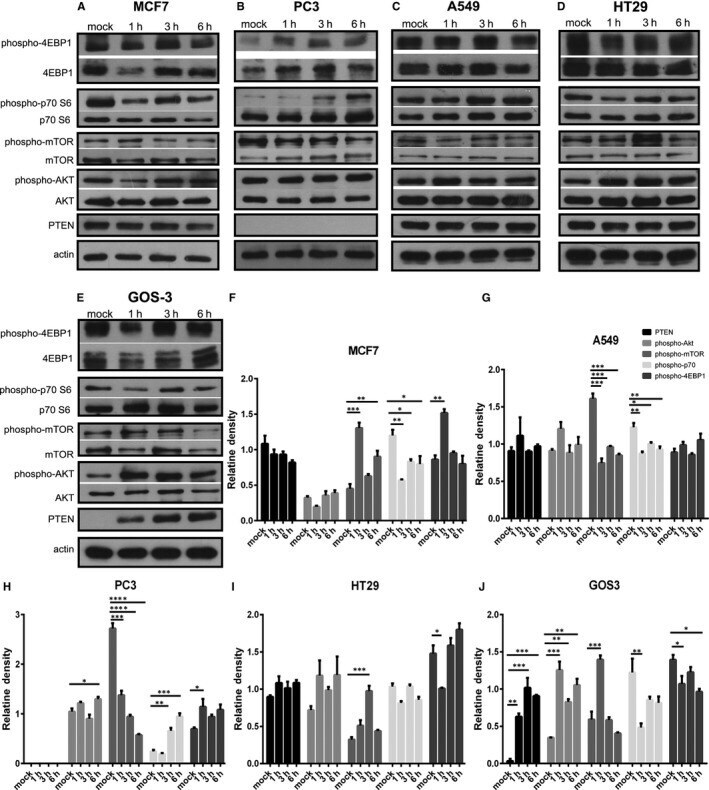
- Experimental details
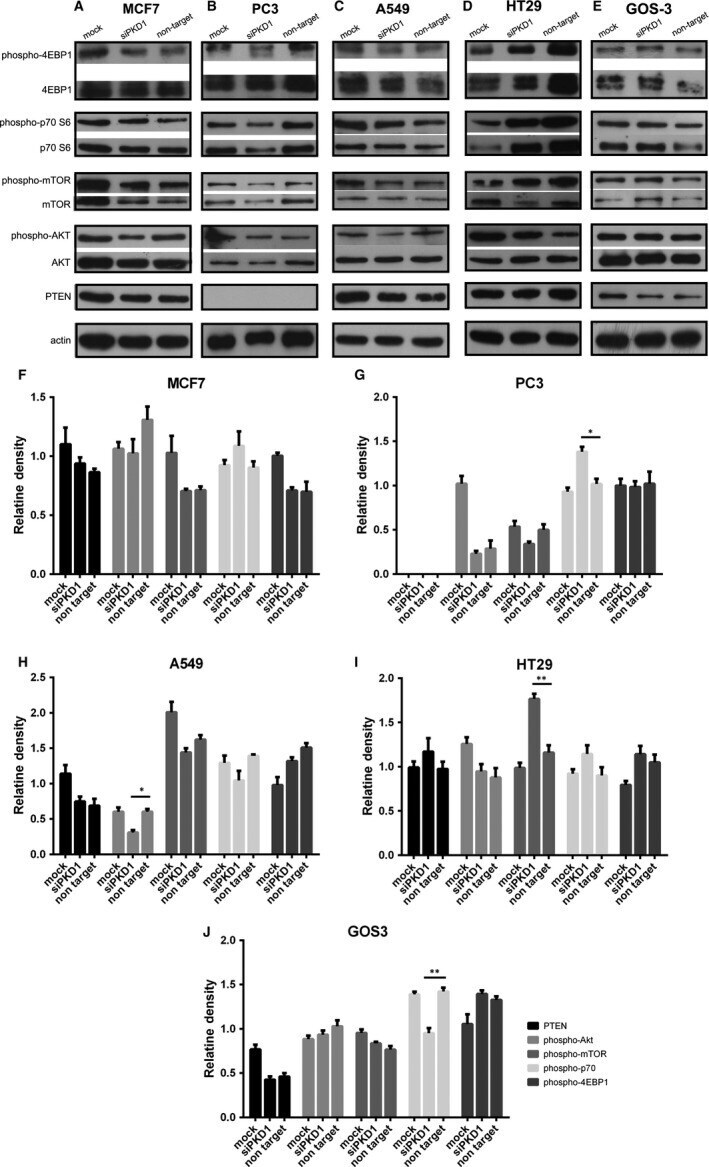
- Figure 4 Effect of Pkd1 silencing on the mTOR pathway in cancer cell lines. (A-E) Western blot analysis showing the effect of Pkd1 silencing on the phosphorylation of mTOR pathway components in MCF7, PC3, A549, HT29 and GOS3 cells. (F-J) Quantitative data showing the effect of Pkd1 silencing on the phosphorylation of mTOR pathway components in MCF7, PC3, A549, HT29 and GOS3 cells. Bars represent means +- SD. * P < 0.05, ** P < 0.01 versus non-target. siPKD1 represents cancer cells transfected with siRNA targeting the Pkd1 mRNA; non-target represents cancer cells transfected with a non-targeting siRNA; mock represents cancer cells transfected with only transfection reagents (without siRNA)
- Submitted by
- Invitrogen Antibodies (provider)
- Main image
- Experimental details
- Figure 5 Effect of PC1 inhibition on the mTOR pathway in cancer cell lines. (A-E) Western blot analysis showing the effect of IgPKD1 on the phosphorylation of mTOR pathway components in MCF7, PC3, A549, HT29 and GOS3 cells. (F-J) Quantitative data showing the effect of IgPKD1 on the phosphorylation of mTOR pathway components in MCF7, PC3, A549, HT29 and GOS3 cells. Bars represent means +- SD. * P < 0.05, ** P < 0.01, *** P < 0.001, **** P < 0.0001 versus mock. Mock represents cells that have been incubated for 3 h with non-immune rabbit serum; 1 h, 3 h, and 6 h represent time points of cell harvesting after 3 h incubation of cancer cells with the IgPKD1 antibody