 Explore
 Validate
 Learn
Learn Flow cytometry
Antibody data
- Antibody Data
- Antigen structure
- References [2]
- Comments [0]
- Validations
- Flow cytometry [1]
- Other assay [1]
Submit
Validation data
Reference
Comment
Report error
- Product number
- 12-9107-41 - Provider product page

- Provider
- Invitrogen Antibodies
- Product name
- Phospho-4EBP1 (Thr36, Thr45) Monoclonal Antibody (V3NTY24), PE, eBioscience™
- Antibody type
- Monoclonal
- Antigen
- Other
- Description
- Description: The V3NTY24 monoclonal antibody recognizes human and mouse eukaryotic translation initiation factor eIF4E-binding protein 1 (4E-BP1) when phosphorylated at threonine 37 and/or threonine 46. 4E-BP1 is a member of a family of translation repressor proteins that include 4E-BP2 and 4E-BP3. In its non-phosphorylated form, 4E-BP1 binds to the eIF4E translation initiation factor and represses cap-dependent translation. Phosphorylation of 4E-BP1 at multiple sites is necessary to disrupt this interaction and de-repress cap-dependent translation. Studies have identified several kinases that phosphorylate 4E-BP1. For instance, FRAP/mTOR phosphorylates Thr37 and Thr46, while ATM phosphorylates Ser111. Phosphorylation of 4E-BP1 at Thr37 and Thr46 is inhibited by the PI3 kinase inhibitors LY294002 and wortmannin.
- Conjugate
- Yellow dye
- Antibody clone number
- V3NTY24
- Concentration
- 5 µL/Test
Submitted references IFNα Impairs Autophagic Degradation of mtDNA Promoting Autoreactivity of SLE Monocytes in a STING-Dependent Fashion.
Sestrin2 Suppresses Classically Activated Macrophages-Mediated Inflammatory Response in Myocardial Infarction through Inhibition of mTORC1 Signaling.
Gkirtzimanaki K, Kabrani E, Nikoleri D, Polyzos A, Blanas A, Sidiropoulos P, Makrigiannakis A, Bertsias G, Boumpas DT, Verginis P
Cell reports 2018 Oct 23;25(4):921-933.e5
Cell reports 2018 Oct 23;25(4):921-933.e5
Sestrin2 Suppresses Classically Activated Macrophages-Mediated Inflammatory Response in Myocardial Infarction through Inhibition of mTORC1 Signaling.
Yang K, Xu C, Zhang Y, He S, Li D
Frontiers in immunology 2017;8:728
Frontiers in immunology 2017;8:728
No comments: Submit comment
Supportive validation
- Submitted by
- Invitrogen Antibodies (provider)
- Main image
- Experimental details
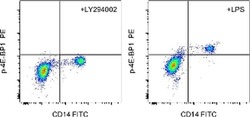
- Intracellular staining of 30-minute LY294002-treated (left), or 30-minute LPS-stimulated (right) normal human peripheral blood cells with Anti-Human CD14 FITC (Product # 11-0149-42) and 0.06 µg of Anti-Human/Mouse phospho-4E-BP1 (T36/T45) PE (right) using the Intracellular Fixation and Permeabilization Buffer Set (Product # 88-8824-00) and protocol. Total viable cells were used for analysis.
- Conjugate
- Yellow dye

Supportive validation
- Submitted by
- Invitrogen Antibodies (provider)
- Main image

- Experimental details
- Figure 3 Impaired Autolysosomal Degradation Determines the Enhanced Immunogenic Potential of IFNalpha-Shaped and SLE Monocytes CD14 + monocytes from healthy donors were cultured for 18 hr with IFNalpha (400 ng/mL) +/- rapam. (1 muMu) as depicted. (A) Levels of HLA-DR and CD86 membrane expression were measured by flow cytometry. A representative result is depicted. Geometric mean fluorescence intensity (GeoMFI) averages are plotted (n = 6). (B) Concentrations of secreted IL6 and TNFalpha measured by ELISA in culture supernatants (n = 3). (C) CFSE-labeled cord blood-naive CD4 + T cells were cultured for 6 days with allogeneic monocytes, previously treated for 18 hr with IFNalpha, +/- rapam., and analyzed for their proliferation. Proliferation index averages of 4 experiments are graphed. Right: histograms of CFSE dilution and size (FS) of CD4 + gated cells. GeoMFI of un-proliferated cells and FS counting are listed on right side of histograms. One representative result is depicted. (D) p-4EBP1 and p-P70S6K expression in freshly isolated monocytes from healthy (n = 5) and SLE (n = 5) donors were analyzed by flow cytometry, and averages of their GeoMFIs are graphed. (E) MLR between SLE monocytes +- rapam. (1 muM) for 1 hr, cocultured with allogeneic CFSE-labeled cord blood-naive CD4 + T cells for 6 days (n = 3). Averages of proliferation indexes as in (C) and averages of % HLADR hi CD86 hi population after cocultures are graphed. (F) Representative histogram of Lysosensor Gre
- Conjugate
- Yellow dye
