 Explore
 Validate
 Learn
Learn Flow cytometry
Antibody data
- Antibody Data
- Antigen structure
- References [3]
- Comments [0]
- Validations
- Flow cytometry [1]
- Other assay [1]
Submit
Validation data
Reference
Comment
Report error
- Product number
- 12-9107-42 - Provider product page

- Provider
- Invitrogen Antibodies
- Product name
- Phospho-4EBP1 (Thr36, Thr45) Monoclonal Antibody (V3NTY24), PE, eBioscience™
- Antibody type
- Monoclonal
- Antigen
- Other
- Description
- Description: The V3NTY24 monoclonal antibody recognizes human and mouse eukaryotic translation initiation factor eIF4E-binding protein 1 (4E-BP1) when phosphorylated at threonine 37 and/or threonine 46. 4E-BP1 is a member of a family of translation repressor proteins that include 4E-BP2 and 4E-BP3. In its non-phosphorylated form, 4E-BP1 binds to the eIF4E translation initiation factor and represses cap-dependent translation. Phosphorylation of 4E-BP1 at multiple sites is necessary to disrupt this interaction and de-repress cap-dependent translation. Studies have identified several kinases that phosphorylate 4E-BP1. For instance, FRAP/mTOR phosphorylates Thr37 and Thr46, while ATM phosphorylates Ser111. Phosphorylation of 4E-BP1 at Thr37 and Thr46 is inhibited by the PI3 kinase inhibitors LY294002 and wortmannin. Applications Reported: This V3NTY24 antibody has been reported for use in intracellular staining followed by flow cytometric analysis. Applications Tested: This V3NTY24 antibody has been pre-titrated and tested by intracellular staining and flow cytometric analysis of stimulated normal human peripheral blood cells. This can be used at 5 µL (0.06 µg) per test. A test is defined as the amount (µg) of antibody that will stain a cell sample in a final volume of 100 µL. Cell number should be determined empirically but can range from 10^5 to 10^8 cells/test. Protocols: Use of Protocol A: Two-step protocol for intracellular (cytoplasmic) proteins is recommended and allows for the greatest flexibility for detection of surface and intracellular (cytoplasmic) proteins. Protocol C: Two-step protocol: Fixation/Methanol may be used and allows for the greatest discrimination of phospho-specific signaling between unstimulated and stimulated samples, but with limitations on the ability to stain specific surface proteins (refer to "Clone Performance Following Fixation/Permeabilization" located in the Best Protocols Section under the Resources tab online). Use of Protocol B: One-step protocol for intracellular (nuclear) proteins is not recommended. All Protocols can be found in the "Staining Intracellular Antigens for Flow Cytometry Protocol" located in the Best Protocols Section under the Resources tab online.. Excitation: 488-561 nm; Emission: 578 nm; Laser: Blue Laser, Green Laser, Yellow-Green Laser. Filtration: 0.2 µm post-manufacturing filtered.
- Reactivity
- Human, Mouse
- Host
- Mouse
- Conjugate
- Yellow dye
- Isotype
- IgG
- Antibody clone number
- V3NTY24
- Vial size
- 100 Tests
- Concentration
- 5 µL/Test
- Storage
- 4° C, store in dark, DO NOT FREEZE!
Submitted references Autophagy-dependent glutaminolysis drives superior IL21 production in HIV-1-specific CD4 T cells.
IFNα Impairs Autophagic Degradation of mtDNA Promoting Autoreactivity of SLE Monocytes in a STING-Dependent Fashion.
Sestrin2 Suppresses Classically Activated Macrophages-Mediated Inflammatory Response in Myocardial Infarction through Inhibition of mTORC1 Signaling.
Loucif H, Dagenais-Lussier X, Avizonis D, Choinière L, Beji C, Cassin L, Routy JP, Fritz JH, Olagnier D, van Grevenynghe J
Autophagy 2022 Jun;18(6):1256-1273
Autophagy 2022 Jun;18(6):1256-1273
IFNα Impairs Autophagic Degradation of mtDNA Promoting Autoreactivity of SLE Monocytes in a STING-Dependent Fashion.
Gkirtzimanaki K, Kabrani E, Nikoleri D, Polyzos A, Blanas A, Sidiropoulos P, Makrigiannakis A, Bertsias G, Boumpas DT, Verginis P
Cell reports 2018 Oct 23;25(4):921-933.e5
Cell reports 2018 Oct 23;25(4):921-933.e5
Sestrin2 Suppresses Classically Activated Macrophages-Mediated Inflammatory Response in Myocardial Infarction through Inhibition of mTORC1 Signaling.
Yang K, Xu C, Zhang Y, He S, Li D
Frontiers in immunology 2017;8:728
Frontiers in immunology 2017;8:728
No comments: Submit comment
Supportive validation
- Submitted by
- Invitrogen Antibodies (provider)
- Main image
- Experimental details
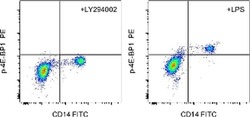
- Intracellular staining of 30-minute LY294002-treated (left), or 30-minute LPS-stimulated (right) normal human peripheral blood cells with Anti-Human CD14 FITC (Product # 11-0149-42) and 0.06 µg of Anti-Human/Mouse phospho-4E-BP1 (T36/T45) PE (right) using the Intracellular Fixation and Permeabilization Buffer Set (Product # 88-8824-00) and protocol. Total viable cells were used for analysis.
- Conjugate
- Yellow dye

Supportive validation
- Submitted by
- Invitrogen Antibodies (provider)
- Main image

- Experimental details
- Figure 3 Impaired Autolysosomal Degradation Determines the Enhanced Immunogenic Potential of IFNalpha-Shaped and SLE Monocytes CD14 + monocytes from healthy donors were cultured for 18 hr with IFNalpha (400 ng/mL) +/- rapam. (1 muMu) as depicted. (A) Levels of HLA-DR and CD86 membrane expression were measured by flow cytometry. A representative result is depicted. Geometric mean fluorescence intensity (GeoMFI) averages are plotted (n = 6). (B) Concentrations of secreted IL6 and TNFalpha measured by ELISA in culture supernatants (n = 3). (C) CFSE-labeled cord blood-naive CD4 + T cells were cultured for 6 days with allogeneic monocytes, previously treated for 18 hr with IFNalpha, +/- rapam., and analyzed for their proliferation. Proliferation index averages of 4 experiments are graphed. Right: histograms of CFSE dilution and size (FS) of CD4 + gated cells. GeoMFI of un-proliferated cells and FS counting are listed on right side of histograms. One representative result is depicted. (D) p-4EBP1 and p-P70S6K expression in freshly isolated monocytes from healthy (n = 5) and SLE (n = 5) donors were analyzed by flow cytometry, and averages of their GeoMFIs are graphed. (E) MLR between SLE monocytes +- rapam. (1 muM) for 1 hr, cocultured with allogeneic CFSE-labeled cord blood-naive CD4 + T cells for 6 days (n = 3). Averages of proliferation indexes as in (C) and averages of % HLADR hi CD86 hi population after cocultures are graphed. (F) Representative histogram of Lysosensor Gre
- Conjugate
- Yellow dye
