 Explore
 Validate
 Learn
Learn Western blot
Antibody data
- Antibody Data
- Antigen structure
- References [2]
- Comments [0]
- Validations
- Western blot [4]
- Immunocytochemistry [1]
- Other assay [5]
Submit
Validation data
Reference
Comment
Report error
- Product number
- AHO1332 - Provider product page

- Provider
- Invitrogen Antibodies
- Product name
- AMPK alpha-1 Monoclonal Antibody (9Q34)
- Antibody type
- Monoclonal
- Antigen
- Recombinant protein fragment
- Reactivity
- Human, Mouse, Rat
- Host
- Mouse
- Isotype
- IgG
- Antibody clone number
- 9Q34
- Vial size
- 100 µg
- Concentration
- 0.5 mg/mL
- Storage
- Store at 4°C short term. For long term storage, store at -20°C, avoiding freeze/thaw cycles.
Submitted references The inositol hexakisphosphate kinases IP6K1 and -2 regulate human cellular phosphate homeostasis, including XPR1-mediated phosphate export.
Impaired Cellular Energy Metabolism Contributes to Duck-Enteritis-Virus-Induced Autophagy via the AMPK-TSC2-MTOR Signaling Pathway.
Wilson MS, Jessen HJ, Saiardi A
The Journal of biological chemistry 2019 Jul 26;294(30):11597-11608
The Journal of biological chemistry 2019 Jul 26;294(30):11597-11608
Impaired Cellular Energy Metabolism Contributes to Duck-Enteritis-Virus-Induced Autophagy via the AMPK-TSC2-MTOR Signaling Pathway.
Yin H, Zhao L, Li S, Xu L, Wang Y, Chen H
Frontiers in cellular and infection microbiology 2017;7:423
Frontiers in cellular and infection microbiology 2017;7:423
No comments: Submit comment
Supportive validation
- Submitted by
- Invitrogen Antibodies (provider)
- Main image

- Experimental details
- Western blot analysis was performed on whole cell extracts (20 µg lysate) of HeLa (lane 1), L6 (lane 2), K562 (lane 3), Jurkat (lane 4), MCF7 (lane 5), Hep G2 (lane 6), HT-29 (lane 7), HCT 116 (lane 8) and MDA-MB-231 (lane 9). The blots were probed with Anti-AMPK alpha Mouse Monoclonal Antibody (Product # AHO1332, 1:500 dilution) and detected by chemiluminescence Goat anti-Mouse IgG (H+L) Secondary Antibody, HRP conjugate (Product # 62-6520, 1:4000 dilution). A 60 kDa band corresponding to AMPK alpha was observed across the cell lines tested. Known quantity of protein samples were electrophoresed using Novex® NuPAGE® 12 % Bis-Tris gel (Product # NP0342BOX), XCell SureLock™ Electrophoresis System (Product # EI0002) and Novex® Sharp Pre-Stained Protein Standard (Product # LC5800). Resolved proteins were then transferred onto a nitrocellulose membrane with iBlot® 2 Dry Blotting System (Product # IB21001). The membrane was probed with the relevant primary and secondary Antibody following blocking with 5 % skimmed milk. Chemiluminescent detection was performed using Pierce™ ECL Western Blotting Substrate (Product # 32106).

- Submitted by
- Invitrogen Antibodies (provider)
- Main image
- Experimental details
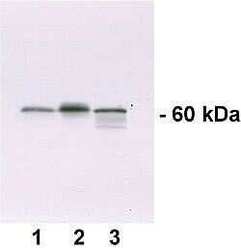
- Proteins from cell extracts of human HeLa cells (lane 1), mouse L929 cells (lane 2), and rat L6 cells (lane 3) were resolved by SDS-PAGE and transferred to PVDF.

- Submitted by
- Invitrogen Antibodies (provider)
- Main image

- Experimental details
- Western blot analysis was performed on whole cell extracts (20 µg lysate) of HeLa (lane 1), L6 (lane 2), K562 (lane 3), Jurkat (lane 4), MCF7 (lane 5), Hep G2 (lane 6), HT-29 (lane 7), HCT 116 (lane 8) and MDA-MB-231 (lane 9). The blots were probed with Anti-AMPK alpha Mouse Monoclonal Antibody (Product # AHO1332, 1:500 dilution) and detected by chemiluminescence Goat anti-Mouse IgG (H+L) Secondary Antibody, HRP conjugate (Product # 62-6520, 1:4000 dilution). A 60 kDa band corresponding to AMPK alpha was observed across the cell lines tested. Known quantity of protein samples were electrophoresed using Novex® NuPAGE® 12 % Bis-Tris gel (Product # NP0342BOX), XCell SureLock™ Electrophoresis System (Product # EI0002) and Novex® Sharp Pre-Stained Protein Standard (Product # LC5800). Resolved proteins were then transferred onto a nitrocellulose membrane with iBlot® 2 Dry Blotting System (Product # IB21001). The membrane was probed with the relevant primary and secondary Antibody following blocking with 5 % skimmed milk. Chemiluminescent detection was performed using Pierce™ ECL Western Blotting Substrate (Product # 32106).

- Submitted by
- Invitrogen Antibodies (provider)
- Main image

- Experimental details
- Knockdown of AMPK alpha-1 was achieved by transfecting MCF7 cells with AMPK alpha-1 specific validated siRNAs (Silencer® select Product # s100, s101 ). Western blot analysis (Fig. a) was performed using whole cell extracts from the AMPK alpha-1 knockdown cells (lane 3), non-specific scrambled siRNA transfected cells (lane 2) and untransfected cells (lane 1). The blots were probed with AMPK alpha-1 Monoclonal Antibody (Product # AHO1332, 1:500 dilution) and Goat anti-Mouse IgG (H+L) Superclonal™ Secondary Antibody, HRP conjugate (Product # A28177, 0.25 µg/mL, 1:4000 dilution). Densitometric analysis of this western blot is shown in histogram (Fig. b). Decrease in signal upon siRNA mediated knock down confirms that antibody is specific to AMPK alpha-1.

Supportive validation
- Submitted by
- Invitrogen Antibodies (provider)
- Main image

- Experimental details
- Immunofluorescence analysis of AMPK alpha-1 was performed using 70% confluent log phase LNCap cells. The cells were fixed with 4% paraformaldehyde for 10 minutes, permeabilized with 0.1% Triton™ X-100 for 10 minutes, and blocked with 1% BSA for 1 hour at room temperature. The cells were labeled with AMPK alpha-1 Monoclonal Antibody (9Q34)(Product # AHO1332) at 1:100 dilution in 0.1% BSA and incubated overnight at 4 degree and then labeled with Goat anti-Mouse IgG (H+L) Superclonal™ Secondary Antibody, Alexa Fluor® 488 conjugate (Product # A28175) at a dilution of 1:2000 for 45 minutes at room temperature (Panel a: green). Nuclei (Panel b: blue) were stained with SlowFade® Gold Antifade Mountant with DAPI (Product # S36938). F-actin (Panel c: red) was stained with Rhodamine Phalloidin (Product # R415, 1:300). Panel d represents the merged image showing mitochondrial localization. Panel e represents control cells with no primary antibody to assess background. The images were captured at 60X magnification.

Supportive validation
- Submitted by
- Invitrogen Antibodies (provider)
- Main image

- Experimental details
- NULL

- Submitted by
- Invitrogen Antibodies (provider)
- Main image

- Experimental details
- Figure 3 AMPK-mTOR may be involved in DEV-induced autophagy. (A,B) DEF cells were infected with DEV. At 48, 60, and 72 hpi, cells were harvested and the activity of AMPK and mTOR was analyzed by western blotting using the indicated antibodies. (C,D) Intensity band ratio of p-mTOR to mTOR and p-AMPK to AMPK. The difference between two group means is presented as * P < 0.05 and ** P < 0.01.

- Submitted by
- Invitrogen Antibodies (provider)
- Main image

- Experimental details
- Figure 4 AMPK regulates DEV induced autophagy through mTOR. (A) Effects of Compound C treatment on LC3II, phosphorylation and total levels of AMPK and mTOR. Cells were pretreated with Compound C (5 muM) or DMSO (control) for 1 h, followed by DEV adsorption for 2 h. At 48 hpi, the protein levels were measured by western blotting. (B) DEF cells transfected with GFP-LC3 for 24 h were treated with 5 muM Compound C or DEV. Formation of GFP-LC3 puncta was analyzed. (C) Titers of DEV produced by Compound-C-treated DEF cells. Cells were pretreated and infected. Virus yields are shown as TCID 50 /ml at 48 hpi. (D) Knockdown of AMPK affected the activity of mTOR and autophagy in DEV-infected cells. DEF cells were transfected with AMPK-specific or control siRNA, then infected with DEV. At 48 hpi, cells were harvested and western blotting was performed. (E) Virus yields in DEF cells transfected with siRNA against AMPK. Virus titres were measured using the TCID 50 assay. The difference between two group means is presented as ** P < 0.01.

- Submitted by
- Invitrogen Antibodies (provider)
- Main image

- Experimental details
- Figure 5 TSC2 is involved in AMPK-mTOR signaling pathway mediated DEV-induced autophagy. (A) Effects of TSC2 silencing on the signaling-pathway-related proteins in autophagy. DEF cells were transfected with TSC2 siRNAs or siNC for 24 h, then infected with DEV. At 48 hpi, expression of proteins was analyzed by western blotting. (B) Knockdown of AMPK affects the activity of TSC2. DEF cells were transfected with siAMPK or siNC for 24 h, and cells were then infected with DEV. At 48 hpi, TSC2 activity was analyzed by western blotting. (C) Representative confocal images of DEV with or without siTSC2 treatment for 48 h. DEF cells were transfected with GFP-LC3, along with siTSC2 or siNC for 24 h, then cells were treated with DEV for a further 48 h. GFP-LC3 puncta were analyzed. (D) The DEV yields produced by siNC- or siTSC2-transfected DEF cells were tested and shown as TCID 50 /ml at 48 hpi. The difference between two group means is presented as and ** P < 0.01.

- Submitted by
- Invitrogen Antibodies (provider)
- Main image

- Experimental details
- Figure 3. Altered ATP levels seen in DKO cells but no difference in mitochondrial activity. A, respirometric analysis of oxygen consumption over time, with addition of mitochondrial modulators. B, images of live cells treated with MitoTracker (shown in green ). Nuclei were stained with Hoechst ( blue ). Scale bars , 15 mum. C, Western blotting using antibodies against members of the five electron transport chain complexes, plus actin as loading control. D, HPLC analysis of adenine nucleotides. E, adenylate energy charge ((ATP + 0.5 ADP)/(ATP + ADP + AMP)) derived from HPLC results in D. F, Western blotting for LKB1, total and phosphorylated AMPK (Thr 172 ), and actin. Quantified by densitometry ( right ). Blot is representative of 4 experiments. ***, p < 0.001, t test. Respirometry in A , images in B and blot in C are representative of 3 experiments. Bar chart in A shows mean +- S.D. from 3 experiments. HPLC data in D and E show mean +- S.D. from 6 experiments. *, p < 0.05, ANOVA with Tukey post test. max unc ., maximum uncoupled rate.
