 Explore
 Validate
 Learn
Learn12-9718-41
antibody from Invitrogen Antibodies
Targeting: MTOR
FLJ44809, FRAP, FRAP1, FRAP2, RAFT1, RAPT1
 Flow cytometry
Antibody data
- Antibody Data
- Antigen structure
- References [12]
- Comments [0]
- Validations
- Flow cytometry [2]
- Other assay [3]
Submit
Validation data
Reference
Comment
Report error
- Product number
- 12-9718-41 - Provider product page

- Provider
- Invitrogen Antibodies
- Product name
- Phospho-mTOR (Ser2448) Monoclonal Antibody (MRRBY), PE, eBioscience™
- Antibody type
- Monoclonal
- Antigen
- Other
- Description
- Description: This MRRBY monoclonal antibody recognizes human and mouse mammalian target of rapamycin (also known as mTOR, FRAP, RAFT) when phosphorylated on S2448. mTOR is a serine/threonine protein kinase that functions as an ATP and amino acid sensor as well as to balance nutrient availability with cell growth, proliferation, motility, survival, protein synthesis, and transcription. Activated mTOR increases production of enzymes necessary for glycolysis and controls the uptake of glucose and other nutrients. Increased glucose uptake and metabolism helps fulfill the energy needs for mTOR-driven cell growth and proliferation. When sufficient nutrients are available, mTOR transmits a positive signal to p70 S6 kinase and participates in the inactivation of the eIF4E inhibitor, 4E-BP1. mTOR is phosphorylated at S2448 via the PI3 kinase/Akt signaling pathway and is autophosphorylated at Ser2481. Due to its critical role in regulation of cell growth, survival, and metabolism, and because it is often abnormally regulated in tumors, mTOR is under investigation as a potential target for anti-cancer therapy. Applications Reported:This MRRBY antibody has been reported for use in intracellular staining followed by flow cytometric analysis. Applications Tested: This MRRBY antibody has been pre-titrated and tested by intracellular staining followed by flow cytometric analysis of normal human peripheral blood cells. This can be used at 5 µL (0.06 µg) per test. A test is defined as the amount (µg) of antibody that will stain a cell sample in a final volume of 100 µL. Cell number should be determined empirically but can range from 10^5 to 10^8 cells/test. Staining Protocol: All protocols work well for this monoclonal antibody. Use of Protocol A: Two-step protocol: intracellular (cytoplasmic) proteins allows for the greatest flexibility for detection of surface and intracellular (cytoplasmic) proteins. Use of Protocol B: One-step protocol: intracellular (nuclear) proteins is recommended for staining of transcription factors in conjunction with surface and phosphorylated intracellular (cytoplasmic) proteins. Protocol C: Two-step protocol: Fixation/Methanol allows for the greatest discrimination of phospho-specific signaling between unstimulated and stimulated samples, but with limitations on the ability to stain specific surface proteins (refer to "Clone Performance Following Fixation/Permeabilization" located in the BestProtocols Section under the Resources tab online). All Protocols can be found in the Flow Cytometry Protocols: "Staining Intracellular Antigens for Flow Cytometry Protocol" located in the BestProtocols® Section under the Resources tab online. Excitation: 488-561 nm; Emission: 578 nm; Laser: Blue Laser, Green Laser, Yellow-Green Laser. Filtration: 0.2 µm post-manufacturing filtered.
- Reactivity
- Human, Mouse
- Host
- Mouse
- Conjugate
- Yellow dye
- Isotype
- IgG
- Antibody clone number
- MRRBY
- Vial size
- 25 Tests
- Concentration
- 5 µL/Test
- Storage
- 4°C, store in dark, DO NOT FREEZE!
Submitted references Autophagy-dependent glutaminolysis drives superior IL21 production in HIV-1-specific CD4 T cells.
Dysregulated PI3K Signaling in B Cells of CVID Patients.
Intestinal microbiota-derived short-chain fatty acids regulation of immune cell IL-22 production and gut immunity.
PRMT5 Modulates Splicing for Genome Integrity and Preserves Proteostasis of Hematopoietic Stem Cells.
mTOR-Dependent Oxidative Stress Regulates oxLDL-Induced Trained Innate Immunity in Human Monocytes.
Autophagy orchestrates the regulatory program of tumor-associated myeloid-derived suppressor cells.
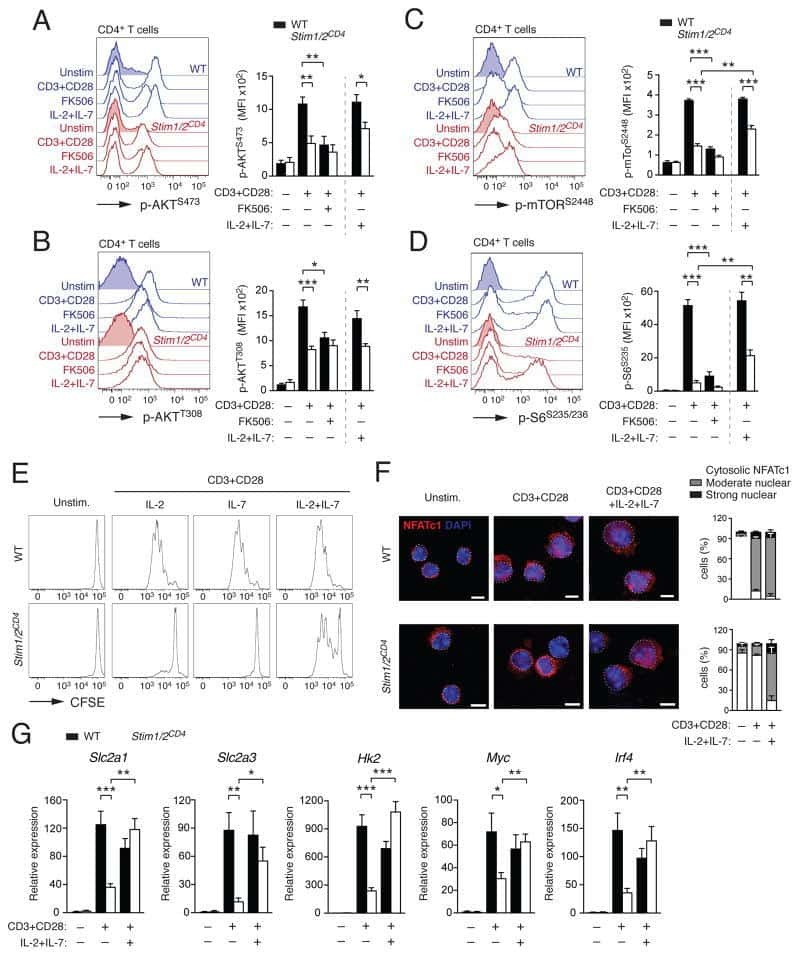
Store-Operated Ca(2+) Entry Controls Clonal Expansion of T Cells through Metabolic Reprogramming.
Mitochondrial activation chemicals synergize with surface receptor PD-1 blockade for T cell-dependent antitumor activity.
mTORC1-dependent metabolic reprogramming is a prerequisite for NK cell effector function.
Requirement for Rictor in homeostasis and function of mature B lymphoid cells.
mTOR signaling in growth control and disease.
Mammalian target of rapamycin protein complex 2 regulates differentiation of Th1 and Th2 cell subsets via distinct signaling pathways.
Loucif H, Dagenais-Lussier X, Avizonis D, Choinière L, Beji C, Cassin L, Routy JP, Fritz JH, Olagnier D, van Grevenynghe J
Autophagy 2022 Jun;18(6):1256-1273
Autophagy 2022 Jun;18(6):1256-1273
Dysregulated PI3K Signaling in B Cells of CVID Patients.
Harder I, Münchhalfen M, Andrieux G, Boerries M, Grimbacher B, Eibel H, Maccari ME, Ehl S, Wienands J, Jellusova J, Warnatz K, Keller B
Cells 2022 Jan 28;11(3)
Cells 2022 Jan 28;11(3)
Intestinal microbiota-derived short-chain fatty acids regulation of immune cell IL-22 production and gut immunity.
Yang W, Yu T, Huang X, Bilotta AJ, Xu L, Lu Y, Sun J, Pan F, Zhou J, Zhang W, Yao S, Maynard CL, Singh N, Dann SM, Liu Z, Cong Y
Nature communications 2020 Sep 8;11(1):4457
Nature communications 2020 Sep 8;11(1):4457
PRMT5 Modulates Splicing for Genome Integrity and Preserves Proteostasis of Hematopoietic Stem Cells.
Tan DQ, Li Y, Yang C, Li J, Tan SH, Chin DWL, Nakamura-Ishizu A, Yang H, Suda T
Cell reports 2019 Feb 26;26(9):2316-2328.e6
Cell reports 2019 Feb 26;26(9):2316-2328.e6
mTOR-Dependent Oxidative Stress Regulates oxLDL-Induced Trained Innate Immunity in Human Monocytes.
Sohrabi Y, Lagache SMM, Schnack L, Godfrey R, Kahles F, Bruemmer D, Waltenberger J, Findeisen HM
Frontiers in immunology 2018;9:3155
Frontiers in immunology 2018;9:3155
Autophagy orchestrates the regulatory program of tumor-associated myeloid-derived suppressor cells.
Alissafi T, Hatzioannou A, Mintzas K, Barouni RM, Banos A, Sormendi S, Polyzos A, Xilouri M, Wielockx B, Gogas H, Verginis P
The Journal of clinical investigation 2018 Aug 31;128(9):3840-3852
The Journal of clinical investigation 2018 Aug 31;128(9):3840-3852
Store-Operated Ca(2+) Entry Controls Clonal Expansion of T Cells through Metabolic Reprogramming.
Vaeth M, Maus M, Klein-Hessling S, Freinkman E, Yang J, Eckstein M, Cameron S, Turvey SE, Serfling E, Berberich-Siebelt F, Possemato R, Feske S
Immunity 2017 Oct 17;47(4):664-679.e6
Immunity 2017 Oct 17;47(4):664-679.e6
Mitochondrial activation chemicals synergize with surface receptor PD-1 blockade for T cell-dependent antitumor activity.
Chamoto K, Chowdhury PS, Kumar A, Sonomura K, Matsuda F, Fagarasan S, Honjo T
Proceedings of the National Academy of Sciences of the United States of America 2017 Jan 31;114(5):E761-E770
Proceedings of the National Academy of Sciences of the United States of America 2017 Jan 31;114(5):E761-E770
mTORC1-dependent metabolic reprogramming is a prerequisite for NK cell effector function.
Donnelly RP, Loftus RM, Keating SE, Liou KT, Biron CA, Gardiner CM, Finlay DK
Journal of immunology (Baltimore, Md. : 1950) 2014 Nov 1;193(9):4477-84
Journal of immunology (Baltimore, Md. : 1950) 2014 Nov 1;193(9):4477-84
Requirement for Rictor in homeostasis and function of mature B lymphoid cells.
Lee K, Heffington L, Jellusova J, Nam KT, Raybuck A, Cho SH, Thomas JW, Rickert RC, Boothby M
Blood 2013 Oct 3;122(14):2369-79
Blood 2013 Oct 3;122(14):2369-79
mTOR signaling in growth control and disease.
Laplante M, Sabatini DM
Cell 2012 Apr 13;149(2):274-93
Cell 2012 Apr 13;149(2):274-93
Mammalian target of rapamycin protein complex 2 regulates differentiation of Th1 and Th2 cell subsets via distinct signaling pathways.
Lee K, Gudapati P, Dragovic S, Spencer C, Joyce S, Killeen N, Magnuson MA, Boothby M
Immunity 2010 Jun 25;32(6):743-53
Immunity 2010 Jun 25;32(6):743-53
No comments: Submit comment
Supportive validation
- Submitted by
- Invitrogen Antibodies (provider)
- Main image
- Experimental details
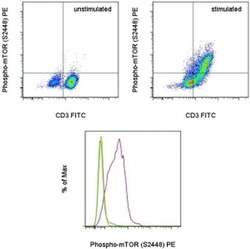
- TOP: Normal human peripheral blood cells were unstimulated (left) or stimulated with Anti-Human CD3 and CD28 Functional Grade Purifieds (Product # 16-0037-81 and Product # 16-0289-81) for 48 hours (right). The cells were then intracellularly stained with Anti-Human CD3 FITC (Product # 11-0036-42) and Anti-Human/Mouse phospho-mTOR (S2448) PE using the Intracellular Fixation & Permeabilization Buffer Set (Product # 88-8824-00) and protocol. Cells in the lymphocyte gate were used for analysis. BOTTOM: Normal human peripheral blood cells were unstimulated (orange histogram) or were stimulated with Anti-Human CD3 and CD28 Functional Grade Purifieds (Product # 16-0037-81 and Product # 16-0289-81) in the presence (green histogram) or absence (purple histogram) of the PI3 kinase inhibitor, LY294002, for 48 hours. The cells were then intracellularly stained with Anti-Human CD3 FITC (Product # 11-0036-42) and Anti-Human/Mouse phospho-mTOR (S2448) PE using the Intracellular Fixation & Permeabilization Buffer Set (Product # 88-8824-00) and protocol. CD3+ cells in the lymphocyte gate were used for analysis.
- Conjugate
- Yellow dye
- Submitted by
- Invitrogen Antibodies (provider)
- Main image
- Experimental details
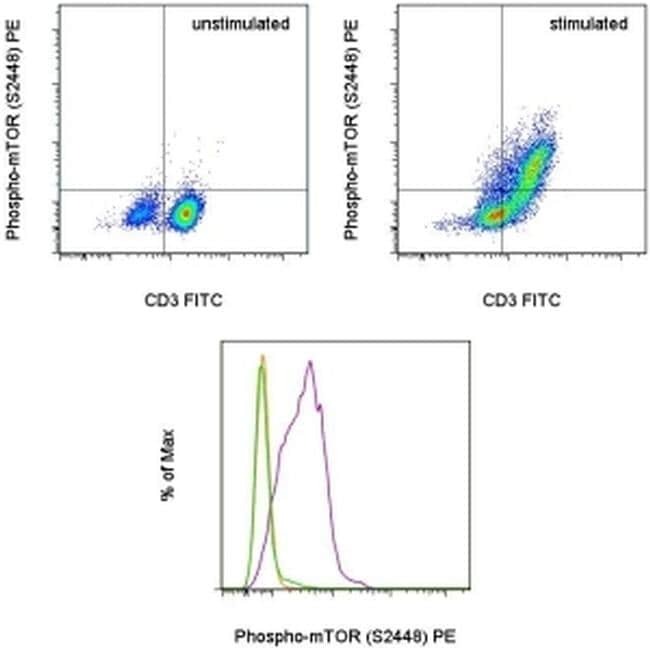
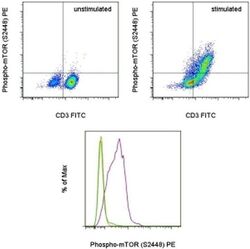
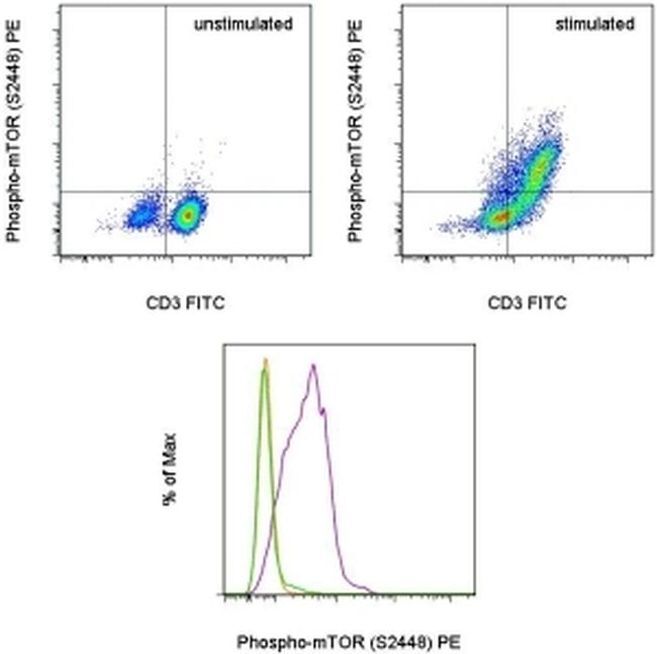
- TOP: Normal human peripheral blood cells were unstimulated (left) or stimulated with Anti-Human CD3 and CD28 Functional Grade Purifieds (Product # 16-0037-81 and Product # 16-0289-81) for 48 hours (right). The cells were then intracellularly stained with Anti-Human CD3 FITC (Product # 11-0036-42) and Anti-Human/Mouse phospho-mTOR (S2448) PE using the Intracellular Fixation & Permeabilization Buffer Set (Product # 88-8824-00) and protocol. Cells in the lymphocyte gate were used for analysis. BOTTOM: Normal human peripheral blood cells were unstimulated (orange histogram) or were stimulated with Anti-Human CD3 and CD28 Functional Grade Purifieds (Product # 16-0037-81 and Product # 16-0289-81) in the presence (green histogram) or absence (purple histogram) of the PI3 kinase inhibitor, LY294002, for 48 hours. The cells were then intracellularly stained with Anti-Human CD3 FITC (Product # 11-0036-42) and Anti-Human/Mouse phospho-mTOR (S2448) PE using the Intracellular Fixation & Permeabilization Buffer Set (Product # 88-8824-00) and protocol. CD3+ cells in the lymphocyte gate were used for analysis.
Supportive validation
- Submitted by
- Invitrogen Antibodies (provider)
- Main image

- Experimental details
- NULL
- Conjugate
- Yellow dye
- Submitted by
- Invitrogen Antibodies (provider)
- Main image
- Experimental details
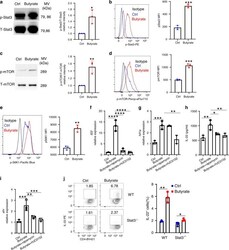
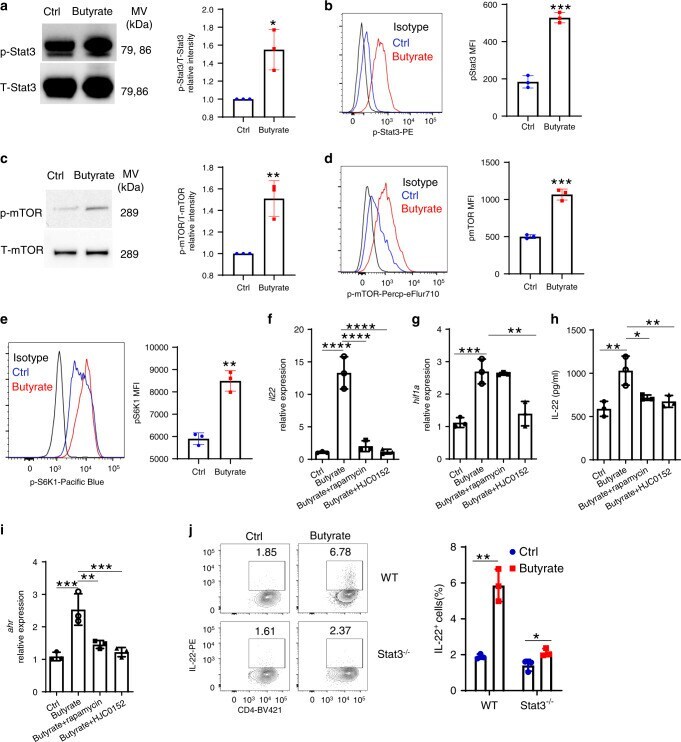
- Fig. 5 Stat3 and mTOR regulate IL-22 production by CD4 + T cells. a-d WT CD4 + T cells were activated with anti-CD3/CD28 mAbs under Th1 conditions with or without butyrate (0.5 mM) ( n = 3/group). Phosphorylated Stat3 (6 h) ( a , b ) and phosphorylated mTOR (24 h) ( c , d ) were assessed by western blot and flow cytometry. Phosphorylated S6K was analyzed by flow cytometry ( e ). f - i CBir1 Tg CD4 + T cells were activated with APCs and CBir1 peptide under Th1 conditions with butyrate (0.5 mM) +- rapamycin (1 uM) or HJC0152 (1 uM). IL-22 mRNA ( f ) and protein ( g ) were assessed by qRT-PCR and ELISA at 60 h ( n = 3/group). Expression of Hif1a ( h ) and Ahr ( i ) was analyzed at 48 h by qRT-PCR. j WT and Stat3 -/- CD4 + T cells were treated with or without butyrate (0.5 mM) for 5 days ( n = 3/group). IL-22 production was measured by flow cytometry. One representative of three independent experiments was shown. Data were expressed as mean +- SD. Statistical significance was tested by two-tailed unpaired Student t -test ( a - e , j ) or two-tailed one-way ANOVA ( f - i ). a * p = 0.0134; b *** p = 0.0002; c ** p = 0.0059; d *** p = 0.0002; e ** p = 0.0010; f , **** p < 0.0001; g ** p = 0.0019 (butyrate vs control) and 0.0069 (butyrate + rapamycin vs butyrate), * p = 0.0141; h *** p = 0.0004, ** p = 0.0012; i , *** p = 0.0004 (butyrate vs control) and 0.009 (butyrate + HJC0152 vs butyrate), ** p = 0.0030; j ** p = 0.0017, * p = 0.0338.
- Conjugate
- Yellow dye
- Submitted by
- Invitrogen Antibodies (provider)
- Main image
- Experimental details
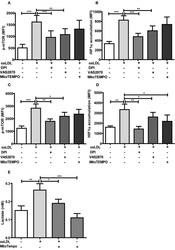
- Figure 6 Antioxidants inhibit activation of the mTOR-HIF1alpha-axis. Monocytes were pre-incubated for 1 h with 0.5 muM Diphenyleneiodonium (DPI), 25 muM VAS2870 or 40 muM Mito-TEMPO or vehicle and treated with oxLDL or vehicle for 24 h. Phosphorylation of mTOR and HIF1alpha accumulation was assessed by staining with PE-Cyanine7 anti-human p-mTOR and PE anti-human HIF1alpha Antibody and analyzed by FACS on day 1 (A,B) or day 6 (C,D) . The MFI (mean fluorescence intensity) was compared between experimental groups. (E) Cells were pre-incubated for 1 h with 40 muM Mito-TEMPO or vehicle and treated with oxLDL or vehicle for 24 h. Lactate concentration was measured on day 6 cells using a colorimetric assay kit. Graphs represent mean values +- SD of at least 6 individuals in at least 3 different experiments. * P < 0.05, ** P < 0.01 and *** P < 0.001.
- Conjugate
- Yellow dye
