Explore
 Validate
 Learn
Learn Western blot
Antibody data
- Antibody Data
- Antigen structure
- References [0]
- Comments [0]
- Validations
- Western blot [1]
- Immunocytochemistry [2]
- Other assay [2]
Submit
Validation data
Reference
Comment
Report error
- Product number
- 44-942G - Provider product page

- Provider
- Invitrogen Antibodies
- Product name
- Phospho-PAK1/2/3 (Thr423) Polyclonal Antibody
- Antibody type
- Polyclonal
- Antigen
- Synthetic peptide
- Reactivity
- Human
- Host
- Rabbit
- Isotype
- IgG
- Vial size
- 100 µL
- Storage
- -20°C
No comments: Submit comment
Supportive validation
- Submitted by
- Invitrogen Antibodies (provider)
- Main image

- Experimental details
- Peptide Competition. Cdc42-activated, His-tagged recombinant S139A/T421A double mutant (1) and wild-type PAK3 (2-5) were added to background extracts and resolved by SDS-PAGE on a 10% Tris-glycine gel and transferred to PVDF. The membrane was blocked with a 5% BSA-TBST buffer overnight at 4°C, then incubated with the PAK1/2/3 (pT423) antibody for two hours at room temperature in a 3% BSA-TBST buffer, following prior incubation with: no peptide (1, 2), the non-phosphopeptide corresponding to the phosphopeptide immunogen (3), a generic phosphothreonine-containing peptide (4), or the phosphopeptide immunogen (5). After washing, the membrane was incubated with goat F (ab’)2 anti-rabbit IgG alkaline phosphatase (Product # ALI4405) and bands were detected using the Tropix WesternStar™ method. The data show that only the phosphopeptide corresponding to PAK1/2/3 (pT423) blocks the antibody signal, and detection of the wild-type but not the mutant protein is detected by the antibody, demonstrating the specificity of the antibody.

Supportive validation
- Submitted by
- Invitrogen Antibodies (provider)
- Main image

- Experimental details
- PAK1/2/3 (pT423) phosphospecific antibody. A549 cells plated on fibronectin, serum starved overnight then stimulated with serum for 1 hour. Green = PAK (pT243), red = actin, blue = Hoechst 33342. Similar staining patterns were seen with PAK (pS141) (data not shown).

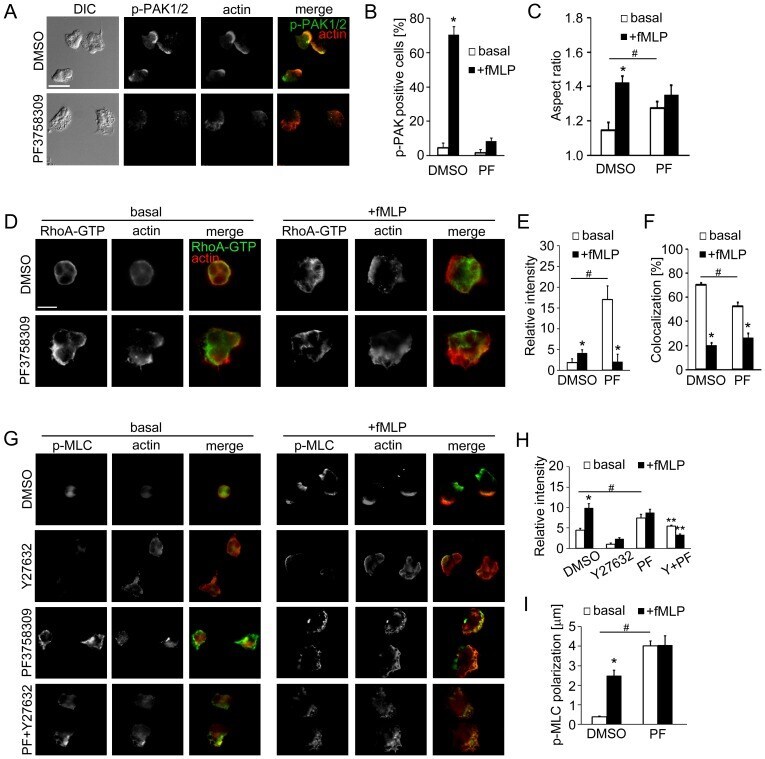
Supportive validation
- Submitted by
- Invitrogen Antibodies (provider)
- Main image

- Experimental details
- Figure 1 PAK2 localizes to the leading edge of activated neutrophils. Replicate samples of total neutrophil (PMN) cell lysates (50 ug per lane) were analyzed for (A) the expression of PAK1 (68 kD), PAK2 (61 kD), PAK3 (65 kD) and PAK4 (72 kD) or (D) phosphorylation of PAK1/2 Thr432/402 at indicated time points after the addition of fMLP (10 nM) by Western blot. Human neutrophils adherent on fibronectin surfaces were treated in the presence or absence of fMLP (10 nM) for 3 min and stained for (B) PAK1, PAK2 or PAK4 (green) and F-actin (red), (E) phospho-PAK2 Ser20 (green) and Rac1-GTP (red), (F) phospho-PAK2 Ser20 (green) and Cdc42-GTP (red), or (G) phospho-PAK1/2 Thr423/402 (green) and F-actin (red). In selected experiments, neutrophils were pretreated with vehicle (0.1% DMSO), EHT1864 (Rac1/2 inhibitor, 50 uM) or wortmannin (PI3K inhibitor, 100 nM). Results are quantified from at least 60 cells and presented as the mean percentage+-SEM of (C) neutrophils displaying PAK immunofluorescence at actin-rich leading edge, or (H) neutrophils displaying phospho-PAK1/2 immunofluorescence in the fields of view. Representative images obtained from 3 independent experiments are shown. * P

- Submitted by
- Invitrogen Antibodies (provider)
- Main image
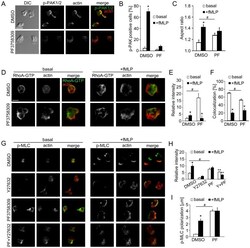
- Experimental details
- Figure 2 PAK inhibition leads to an accumulation of active RhoA and phosphorylated myosin light chain. (A) Human neutrophils adherent on fibronectin surfaces were pretreated with vehicle (0.1% DMSO) or PF3758309 (PF; PAK inhibitor, 10 uM), and stimulated with fMLP (10 nM) for 3 min and stained for phospho-PAK1/2 Thr423/402 (green) and F-actin (red). (B) The mean percentage of cells displaying phospho-PAK1/2 immunofluorescence at basal level (white bars) or after stimulation (black bars) was quantified from at least 50 cells per treatment. (C) Cell circularity was analyzed using MATLAB and presented as aspect ratio of individual neutrophils at basal level (white bars) or after fMLP stimulation (black bars). (D) Neutrophils were pretreated as indicated in (A) and stimulated with fMLP (10 nM). Cells were stained for active RhoA-GTP (green) and F-actin (red). (E) The mean relative intensity of RhoA-GTP immunofluorescence or (F) the mean percentage of RhoA-GTP/actin colocalization of individual cell area at basal level (white bars) or after fMLP stimulation (black bars). (G) Neutrophils were pretreated with the inhibitors indicated in (A), or with Y27632 (ROCK inhibitor, 10 uM), or a combination of 10 uM PF3758309 and 10 uM Y27632 (PF+Y27632) and stained for phospho-myosin light chain (p-MLC; green) and F-actin (red). (H) Relative p-MLC fluorescence intensity or (I) the distance between DIC cell centroid and p-MLC fluorescence centroid at basal level (white bars) or after fMLP sti