 Explore
 Validate
 Learn
Learn Western blot
Antibody data
- Antibody Data
- Antigen structure
- References [32]
- Comments [0]
- Validations
- Western blot [4]
- Immunocytochemistry [4]
- Immunohistochemistry [1]
- Other assay [25]
Submit
Validation data
Reference
Comment
Report error
- Product number
- MA1-91399 - Provider product page

- Provider
- Invitrogen Antibodies
- Product name
- beta Actin Monoclonal Antibody (AC-15)
- Antibody type
- Monoclonal
- Antigen
- Synthetic peptide
- Description
- Positive control of cultured human or chicken fibroblasts suggested.
- Antibody clone number
- AC-15
- Concentration
- 3 mg/mL
Submitted references Rapamycin-filgrastim combination therapy ameliorates portal hypertension-induced splenomegaly: Role of β actin and S100A9 proteins modulation.
Intrabody Targeting HIF-1α Mediates Transcriptional Downregulation of Target Genes Related to Solid Tumors.
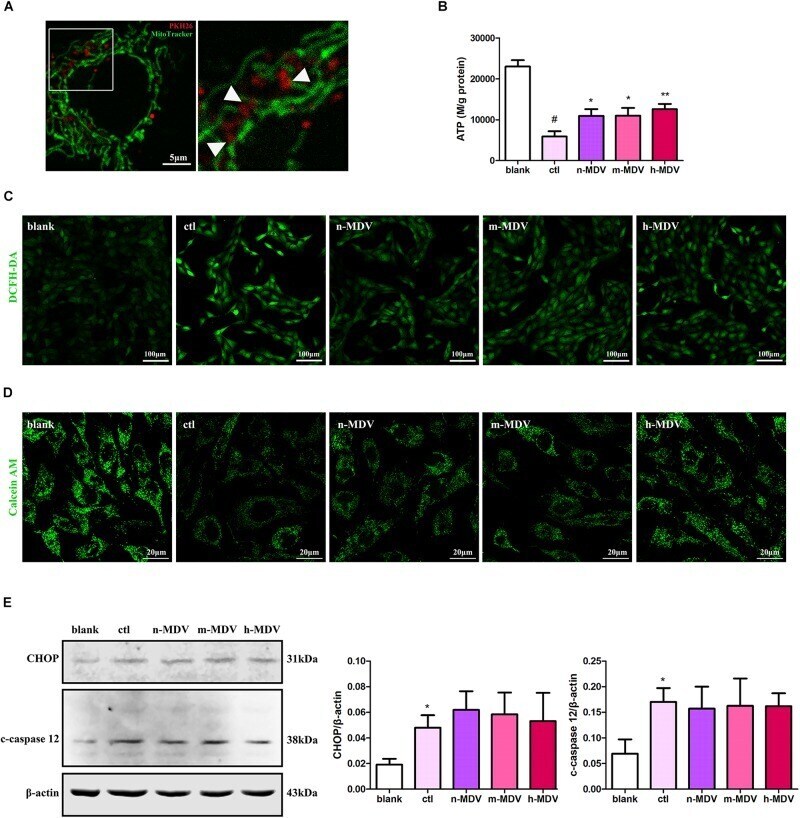
Mitochondrial-Derived Vesicles Protect Cardiomyocytes Against Hypoxic Damage.
Myeloid Differentiation Primary Response 88-Cyclin D1 Signaling in Breast Cancer Cells Regulates Toll-Like Receptor 3-Mediated Cell Proliferation.
Noncanonical function of an autophagy protein prevents spontaneous Alzheimer's disease.
Enhanced Hyaluronan Signaling and Autophagy Dysfunction by VPS35 D620N.
Regulation of histone methylation by automethylation of PRC2.
Niemann-Pick Type C Disease Reveals a Link between Lysosomal Cholesterol and PtdIns(4,5)P(2) That Regulates Neuronal Excitability.
Sensing of nutrients by CPT1C regulates late endosome/lysosome anterograde transport and axon growth.
Disease-associated mutations in Niemann-Pick type C1 alter ER calcium signaling and neuronal plasticity.
Antenatal melatonin modulates an enhanced antioxidant/pro-oxidant ratio in pulmonary hypertensive newborn sheep.
Melatonin Decreases Pulmonary Vascular Remodeling and Oxygen Sensitivity in Pulmonary Hypertensive Newborn Lambs.
Oral Pathobiont Activates Anti-Apoptotic Pathway, Promoting both Immune Suppression and Oncogenic Cell Proliferation.
Melanogenesis in uveal melanoma cells: Effect of argan oil.
A chloroquine-induced macrophage-preconditioning strategy for improved nanodelivery.
Dexamethasone Alters the Appetite Regulation via Induction of Hypothalamic Insulin Resistance in Rat Brain.
Hypothalamic Regulation of Liver and Muscle Nutrient Partitioning by Brain-Specific Carnitine Palmitoyltransferase 1C in Male Mice.
Human IDO-competent, long-lived immunoregulatory dendritic cells induced by intracellular pathogen, and their fate in humanized mice.
A small molecule identified through an in silico screen inhibits Aurora B-INCENP interaction.
DRP1-dependent apoptotic mitochondrial fission occurs independently of BAX, BAK and APAF1 to amplify cell death by BID and oxidative stress.
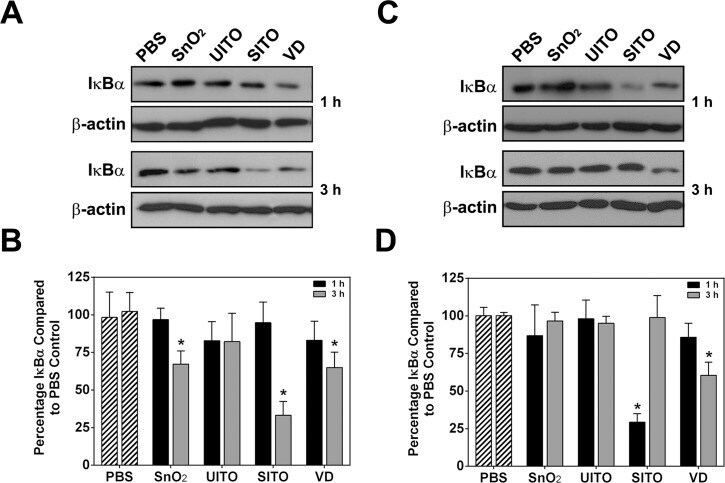
Sintered indium-tin oxide particles induce pro-inflammatory responses in vitro, in part through inflammasome activation.
Impact of Diverse Immune Evasion Mechanisms of Cancer Cells on T Cells Engaged by EpCAM/CD3-Bispecific Antibody Construct AMG 110.
Deregulated Expression of SRC, LYN and CKB Kinases by DNA Methylation and Its Potential Role in Gastric Cancer Invasiveness and Metastasis.
Sodium fluoride affects zebrafish behaviour and alters mRNA expressions of biomarker genes in the brain: Role of Nrf2/Keap1.
Quantitative comparison of a human cancer cell surface proteome between interphase and mitosis.
DIGE based proteome analysis of mammary gland tissue in water buffalo (Bubalus bubalis): lactating vis-a-vis heifer.
Cyclin C is a haploinsufficient tumour suppressor.
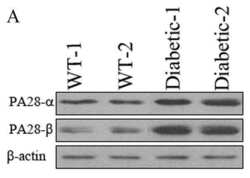
High glucose and diabetes modulate cellular proteasome function: Implications in the pathogenesis of diabetes complications.
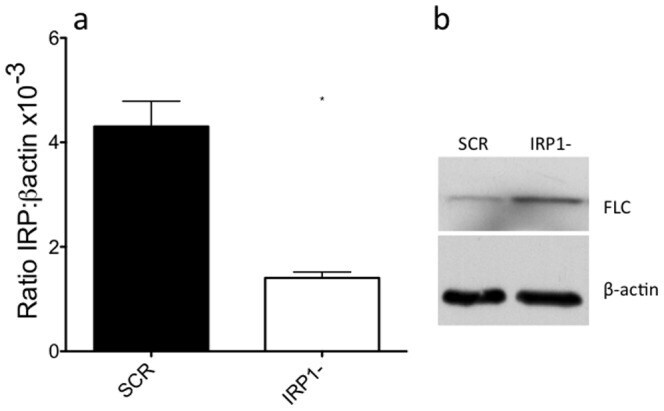
Dysregulation of IRP1-mediated iron metabolism causes gamma ray-specific radioresistance in leukemia cells.
Effect of cellular senescence on the albumin permeability of blood-derived endothelial cells.
Inhibition of intracellular hepatitis C virus replication by nelfinavir and synergistic effect with interferon-alpha.
Microcephalin is a DNA damage response protein involved in regulation of CHK1 and BRCA1.
Abdelrahman SA, Abdelfatah MM, Keshta AT
Iranian journal of basic medical sciences 2022 Jun;25(6):732-744
Iranian journal of basic medical sciences 2022 Jun;25(6):732-744
Intrabody Targeting HIF-1α Mediates Transcriptional Downregulation of Target Genes Related to Solid Tumors.
Hu Y, Romão E, Vincke C, Brys L, Elkrim Y, Vandevenne M, Liu C, Muyldermans S
International journal of molecular sciences 2021 Nov 15;22(22)
International journal of molecular sciences 2021 Nov 15;22(22)
Mitochondrial-Derived Vesicles Protect Cardiomyocytes Against Hypoxic Damage.
Li B, Zhao H, Wu Y, Zhu Y, Zhang J, Yang G, Yan Q, Li J, Li T, Liu L
Frontiers in cell and developmental biology 2020;8:214
Frontiers in cell and developmental biology 2020;8:214
Myeloid Differentiation Primary Response 88-Cyclin D1 Signaling in Breast Cancer Cells Regulates Toll-Like Receptor 3-Mediated Cell Proliferation.
Singh A, Devkar R, Basu A
Frontiers in oncology 2020;10:1780
Frontiers in oncology 2020;10:1780
Noncanonical function of an autophagy protein prevents spontaneous Alzheimer's disease.
Heckmann BL, Teubner BJW, Boada-Romero E, Tummers B, Guy C, Fitzgerald P, Mayer U, Carding S, Zakharenko SS, Wileman T, Green DR
Science advances 2020 Aug;6(33):eabb9036
Science advances 2020 Aug;6(33):eabb9036
Enhanced Hyaluronan Signaling and Autophagy Dysfunction by VPS35 D620N.
Rahman AA, Soto-Avellaneda A, Yong Jin H, Stojkovska I, Lai NK, Albright JE, Webb AR, Oe E, Valarde JP, Oxford AE, Urquhart PE, Wagner B, Brown C, Amado I, Vasquez P, Lehning N, Grozdanov V, Pu X, Danzer KM, Morrison BE
Neuroscience 2020 Aug 10;441:33-45
Neuroscience 2020 Aug 10;441:33-45
Regulation of histone methylation by automethylation of PRC2.
Wang X, Long Y, Paucek RD, Gooding AR, Lee T, Burdorf RM, Cech TR
Genes & development 2019 Oct 1;33(19-20):1416-1427
Genes & development 2019 Oct 1;33(19-20):1416-1427
Niemann-Pick Type C Disease Reveals a Link between Lysosomal Cholesterol and PtdIns(4,5)P(2) That Regulates Neuronal Excitability.
Vivas O, Tiscione SA, Dixon RE, Ory DS, Dickson EJ
Cell reports 2019 May 28;27(9):2636-2648.e4
Cell reports 2019 May 28;27(9):2636-2648.e4
Sensing of nutrients by CPT1C regulates late endosome/lysosome anterograde transport and axon growth.
Palomo-Guerrero M, Fadó R, Casas M, Pérez-Montero M, Baena M, Helmer PO, Domínguez JL, Roig A, Serra D, Hayen H, Stenmark H, Raiborg C, Casals N
eLife 2019 Dec 23;8
eLife 2019 Dec 23;8
Disease-associated mutations in Niemann-Pick type C1 alter ER calcium signaling and neuronal plasticity.
Tiscione SA, Vivas O, Ginsburg KS, Bers DM, Ory DS, Santana LF, Dixon RE, Dickson EJ
The Journal of cell biology 2019 Dec 2;218(12):4141-4156
The Journal of cell biology 2019 Dec 2;218(12):4141-4156
Antenatal melatonin modulates an enhanced antioxidant/pro-oxidant ratio in pulmonary hypertensive newborn sheep.
Gonzalez-Candia A, Veliz M, Carrasco-Pozo C, Castillo RL, Cárdenas JC, Ebensperger G, Reyes RV, Llanos AJ, Herrera EA
Redox biology 2019 Apr;22:101128
Redox biology 2019 Apr;22:101128
Melatonin Decreases Pulmonary Vascular Remodeling and Oxygen Sensitivity in Pulmonary Hypertensive Newborn Lambs.
Astorga CR, González-Candia A, Candia AA, Figueroa EG, Cañas D, Ebensperger G, Reyes RV, Llanos AJ, Herrera EA
Frontiers in physiology 2018;9:185
Frontiers in physiology 2018;9:185
Oral Pathobiont Activates Anti-Apoptotic Pathway, Promoting both Immune Suppression and Oncogenic Cell Proliferation.
Arjunan P, Meghil MM, Pi W, Xu J, Lang L, El-Awady A, Sullivan W, Rajendran M, Rabelo MS, Wang T, Tawfik OK, Kunde-Ramamoorthy G, Singh N, Muthusamy T, Susin C, Teng Y, Arce RM, Cutler CW
Scientific reports 2018 Nov 9;8(1):16607
Scientific reports 2018 Nov 9;8(1):16607
Melanogenesis in uveal melanoma cells: Effect of argan oil.
Caporarello N, Olivieri M, Cristaldi M, Rusciano D, Lupo G, Anfuso CD
International journal of molecular medicine 2017 Oct;40(4):1277-1284
International journal of molecular medicine 2017 Oct;40(4):1277-1284
A chloroquine-induced macrophage-preconditioning strategy for improved nanodelivery.
Wolfram J, Nizzero S, Liu H, Li F, Zhang G, Li Z, Shen H, Blanco E, Ferrari M
Scientific reports 2017 Oct 23;7(1):13738
Scientific reports 2017 Oct 23;7(1):13738
Dexamethasone Alters the Appetite Regulation via Induction of Hypothalamic Insulin Resistance in Rat Brain.
Chruvattil R, Banerjee S, Nath S, Machhi J, Kharkwal G, Yadav MR, Gupta S
Molecular neurobiology 2017 Nov;54(9):7483-7496
Molecular neurobiology 2017 Nov;54(9):7483-7496
Hypothalamic Regulation of Liver and Muscle Nutrient Partitioning by Brain-Specific Carnitine Palmitoyltransferase 1C in Male Mice.
Pozo M, Rodríguez-Rodríguez R, Ramírez S, Seoane-Collazo P, López M, Serra D, Herrero L, Casals N
Endocrinology 2017 Jul 1;158(7):2226-2238
Endocrinology 2017 Jul 1;158(7):2226-2238
Human IDO-competent, long-lived immunoregulatory dendritic cells induced by intracellular pathogen, and their fate in humanized mice.
Tyagi RK, Miles B, Parmar R, Garg NK, Dalai SK, Baban B, Cutler CW
Scientific reports 2017 Feb 15;7:41083
Scientific reports 2017 Feb 15;7:41083
A small molecule identified through an in silico screen inhibits Aurora B-INCENP interaction.
Unsal E, Degirmenci B, Harmanda B, Erman B, Ozlu N
Chemical biology & drug design 2016 Dec;88(6):783-794
Chemical biology & drug design 2016 Dec;88(6):783-794
DRP1-dependent apoptotic mitochondrial fission occurs independently of BAX, BAK and APAF1 to amplify cell death by BID and oxidative stress.
Oettinghaus B, D'Alonzo D, Barbieri E, Restelli LM, Savoia C, Licci M, Tolnay M, Frank S, Scorrano L
Biochimica et biophysica acta 2016 Aug;1857(8):1267-1276
Biochimica et biophysica acta 2016 Aug;1857(8):1267-1276
Sintered indium-tin oxide particles induce pro-inflammatory responses in vitro, in part through inflammasome activation.
Badding MA, Schwegler-Berry D, Park JH, Fix NR, Cummings KJ, Leonard SS
PloS one 2015;10(4):e0124368
PloS one 2015;10(4):e0124368
Impact of Diverse Immune Evasion Mechanisms of Cancer Cells on T Cells Engaged by EpCAM/CD3-Bispecific Antibody Construct AMG 110.
Deisting W, Raum T, Kufer P, Baeuerle PA, Münz M
PloS one 2015;10(10):e0141669
PloS one 2015;10(10):e0141669
Deregulated Expression of SRC, LYN and CKB Kinases by DNA Methylation and Its Potential Role in Gastric Cancer Invasiveness and Metastasis.
Mello AA, Leal MF, Rey JA, Pinto GR, Lamarão LM, Montenegro RC, Alves AP, Assumpção PP, Borges Bdo N, Smith MC, Burbano RR
PloS one 2015;10(10):e0140492
PloS one 2015;10(10):e0140492
Sodium fluoride affects zebrafish behaviour and alters mRNA expressions of biomarker genes in the brain: Role of Nrf2/Keap1.
Mukhopadhyay D, Priya P, Chattopadhyay A
Environmental toxicology and pharmacology 2015 Sep;40(2):352-9
Environmental toxicology and pharmacology 2015 Sep;40(2):352-9
Quantitative comparison of a human cancer cell surface proteome between interphase and mitosis.
Özlü N, Qureshi MH, Toyoda Y, Renard BY, Mollaoglu G, Özkan NE, Bulbul S, Poser I, Timm W, Hyman AA, Mitchison TJ, Steen JA
The EMBO journal 2015 Jan 13;34(2):251-65
The EMBO journal 2015 Jan 13;34(2):251-65
DIGE based proteome analysis of mammary gland tissue in water buffalo (Bubalus bubalis): lactating vis-a-vis heifer.
Jena MK, Janjanam J, Naru J, Kumar S, Kumar S, Singh S, Mohapatra SK, Kola S, Anand V, Jaswal S, Verma AK, Malakar D, Dang AK, Kaushik JK, Reddy VS, Mohanty AK
Journal of proteomics 2015 Apr 24;119:100-11
Journal of proteomics 2015 Apr 24;119:100-11
Cyclin C is a haploinsufficient tumour suppressor.
Li N, Fassl A, Chick J, Inuzuka H, Li X, Mansour MR, Liu L, Wang H, King B, Shaik S, Gutierrez A, Ordureau A, Otto T, Kreslavsky T, Baitsch L, Bury L, Meyer CA, Ke N, Mulry KA, Kluk MJ, Roy M, Kim S, Zhang X, Geng Y, Zagozdzon A, Jenkinson S, Gale RE, Linch DC, Zhao JJ, Mullighan CG, Harper JW, Aster JC, Aifantis I, von Boehmer H, Gygi SP, Wei W, Look AT, Sicinski P
Nature cell biology 2014 Nov;16(11):1080-91
Nature cell biology 2014 Nov;16(11):1080-91
High glucose and diabetes modulate cellular proteasome function: Implications in the pathogenesis of diabetes complications.
Aghdam SY, Gurel Z, Ghaffarieh A, Sorenson CM, Sheibani N
Biochemical and biophysical research communications 2013 Mar 8;432(2):339-44
Biochemical and biophysical research communications 2013 Mar 8;432(2):339-44
Dysregulation of IRP1-mediated iron metabolism causes gamma ray-specific radioresistance in leukemia cells.
Haro KJ, Sheth A, Scheinberg DA
PloS one 2012;7(11):e48841
PloS one 2012;7(11):e48841
Effect of cellular senescence on the albumin permeability of blood-derived endothelial cells.
Cheung TM, Ganatra MP, Peters EB, Truskey GA
American journal of physiology. Heart and circulatory physiology 2012 Dec 1;303(11):H1374-83
American journal of physiology. Heart and circulatory physiology 2012 Dec 1;303(11):H1374-83
Inhibition of intracellular hepatitis C virus replication by nelfinavir and synergistic effect with interferon-alpha.
Toma S, Yamashiro T, Arakaki S, Shiroma J, Maeshiro T, Hibiya K, Sakamoto N, Kinjo F, Tateyama M, Fujita J
Journal of viral hepatitis 2009 Jul;16(7):506-12
Journal of viral hepatitis 2009 Jul;16(7):506-12
Microcephalin is a DNA damage response protein involved in regulation of CHK1 and BRCA1.
Xu X, Lee J, Stern DF
The Journal of biological chemistry 2004 Aug 13;279(33):34091-4
The Journal of biological chemistry 2004 Aug 13;279(33):34091-4
No comments: Submit comment
Supportive validation
- Submitted by
- Invitrogen Antibodies (provider)
- Main image

- Experimental details
- Western Blot analysis of beta Actin was performed by loading (1) HeLa, (2) Jurkat, (3) COS7, (4) NIH3T3, (5) PC-12, (6) RAT2, (7) CHO, (8) MDBK and (9) MDCK lysates. Proteins were transferred to a membrane and probed with a beta Actin Monoclonal Antibody (AC-15) (Product # MA1-91399) at a dilution of 1:5,000..

- Submitted by
- Invitrogen Antibodies (provider)
- Main image

- Experimental details
- Knockout of ACTB was achieved by CRISPR-Cas9 genome editing using LentiArray™ Lentiviral sgRNA (Product # A32042, Assay ID CRISPR889078_LV) and LentiArray Cas9 Lentivirus (Product # A32064). Western blot analysis of ACTB was performed by loading 30 µg of A-375 wild type (Lane 1), A-375 Cas9 (Lane 2) and A-375 ACTB KO (Lane 3) whole cell extracts. The samples were electrophoresed using NuPAGE™ Novex™ 4-12% Bis-Tris Protein Gel (Product # NP0322BOX). Resolved proteins were then transferred onto a nitrocellulose membrane (Product # IB23001) by iBlot® 2 Dry Blotting System (Product # IB21001). The blot was probed with beta Actin Monoclonal Antibody (AC-15) (Product # MA1-91399, 1:5000 dilution) and Goat anti-Mouse IgG (H+L) Superclonal™ Recombinant Secondary Antibody, HRP (Product # A28177, 1:10,000 dilution) using the iBright™ FL1500 (Product # A44115). Chemiluminescent detection was performed usingSuperSignal™ West Dura Extended Duration Substrate (Product # 34076). Loss of signal upon CRISPR mediated knockout (KO) using the LentiArray™ CRISPR product line confirms that antibody is specific to ACTB.

- Submitted by
- Invitrogen Antibodies (provider)
- Main image

- Experimental details
- Western Blot was performed using Anti-beta Actin Monoclonal Antibody (AC-15) (Product # MA1-91399) and a ~40 kDa band corresponding to Actin, cytoplasmic 1 was observed across cell lines and tissues tested. Whole cell extracts (30 µg lysate) of HeLa (Lane 1), A549 (Lane 2), A-431 (Lane 3), U-2 OS (Lane 4), Jurkat (Lane 5), PC-12 (Lane 6), NIH/3T3 (Lane 7), Mouse Spleen (Lane 8), Mouse Liver (Lane 9), Rat Spleen (Lane 10), Rat Liver (Lane 11) were electrophoresed using NuPAGE™ 4-12% Bis-Tris Protein Gel (Product # NP0321BOX). Resolved proteins were then transferred onto a Nitrocellulose membrane (Product # LC2001) by iBlot® 2 Dry Blotting System (Product # IB21001). The Blot was probed with the primary antibody (1:5000 dilution) and detected by chemiluminescence with Goat anti-Mouse IgG (H+L) Superclonal™ Recombinant Secondary Antibody, HRP (Product # A28177, 1:4000 dilution) using the iBright FL 1000 (Product # A32752). Chemiluminescent detection was performed using Novex® ECL Chemiluminescent Substrate Reagent Kit (Product # WP20005). doi:10.1038/bcj.2014.18

Supportive validation
- Submitted by
- Invitrogen Antibodies (provider)
- Main image
- Experimental details
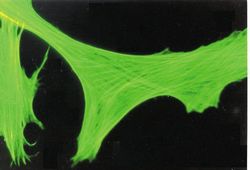
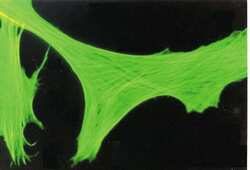
- Immunocytochemistry-Immunofluorescence analysis of beta-Actin in FS-11 cells using beta Actin Monoclonal Antibody (AC-15) (Product # MA1-91399).

- Submitted by
- Invitrogen Antibodies (provider)
- Main image
- Experimental details
- Immunocytochemistry-Immunofluorescence analysis of beta-Actin in FS-11 cells using beta Actin Monoclonal Antibody (AC-15) (Product # MA1-91399).

- Submitted by
- Invitrogen Antibodies (provider)
- Main image
- Experimental details
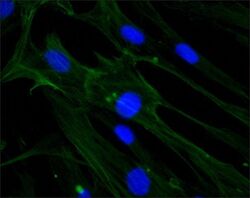
- Immunocytochemistry-Immunofluorescence analysis of beta-Actin in HS-68 cells using beta Actin Monoclonal Antibody (AC-15) (Product # MA1-91399) at 1:1000 (green) with DAPI (blue). Cells were fixed and permeabilized with methanol followed by methanol: acetone.

- Submitted by
- Invitrogen Antibodies (provider)
- Main image

- Experimental details
- Immunofluorescence analysis of Actin, cytoplasmic 1 was performed using 70% confluent log phase HeLa cells. The cells were fixed with 4% paraformaldehyde for 5 minutes, permeabilized with 0.1% Triton™ X-100 for 10 minutes, and blocked with 2% BSA for 45 minutes at room temperature. The cells were labeled with beta Actin Monoclonal Antibody (AC-15) (Product # MA1-91399) at 1:100 dilution in 0.1% BSA, incubated at 4 degree celsius overnight and then labeled with Donkey anti-Mouse IgG (H+L) Highly Cross-Adsorbed Secondary Antibody, Alexa Fluor Plus 647 (Product # A32787), (1:2000 dilution), for 45 minutes at room temperature (Panel a: Green). Nuclei (Panel b:Blue) were stained with ProLong™ Diamond Antifade Mountant with DAPI (Product # P36962). F-actin (Panel c: Red) was stained with Rhodamine Phalloidin (Product # R415, 1:300). Panel d represents the merged image showing Cytoskeleton localization. Panel e represents control cells with no primary antibody to assess background. The images were captured at 60x magnification.

Supportive validation
- Submitted by
- Invitrogen Antibodies (provider)
- Main image

- Experimental details
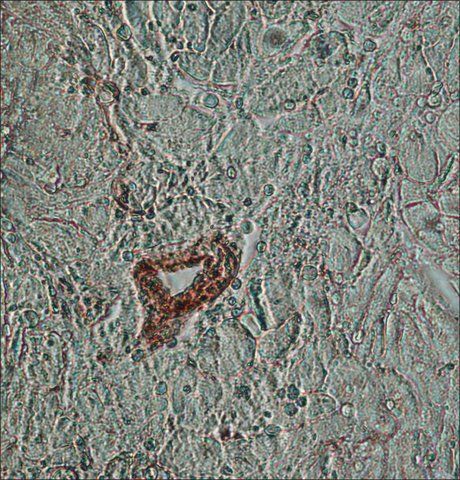
- Immunohistochemistry (Paraffin) analysis of beta Actin in human heart tissue using beta Actin Monoclonal Antibody (AC-15) (Product # MA1-91399) at a dilution of 1:1,000.
Supportive validation
- Submitted by
- Invitrogen Antibodies (provider)
- Main image

- Experimental details
- NULL
- Submitted by
- Invitrogen Antibodies (provider)
- Main image

- Experimental details
- NULL

- Submitted by
- Invitrogen Antibodies (provider)
- Main image

- Experimental details
- NULL
- Submitted by
- Invitrogen Antibodies (provider)
- Main image

- Experimental details
- NULL

- Submitted by
- Invitrogen Antibodies (provider)
- Main image

- Experimental details
- NULL

- Submitted by
- Invitrogen Antibodies (provider)
- Main image

- Experimental details
- NULL

- Submitted by
- Invitrogen Antibodies (provider)
- Main image

- Experimental details
- NULL
- Submitted by
- Invitrogen Antibodies (provider)
- Main image

- Experimental details
- NULL
- Submitted by
- Invitrogen Antibodies (provider)
- Main image
- Experimental details
- NULL

- Submitted by
- Invitrogen Antibodies (provider)
- Main image

- Experimental details
- Figure 4 Chloroquine-induced changes in Kupffer cells. ( a ) Microscopy images of chloroquine-induced vacuole formation in live cells. Cells were pretreated with 100 muM of chloroquine. Lysotracker, green. Scale bar, 50 mum (upper), 10 mum (lower). ( b ) Western blot analysis of phosphatidylinositol-binding clathrin assembly protein (PICALM), alpha-adaptin, and clathrin heavy chain expression in cells. beta-actin was used as a loading control. ( c ) Densitometric analysis of western blot results. Results represent the ratio between the protein of interest and beta-actin (mean +- s.d. of three samples), and are normalized to control cells. Statistics by Student's t -test. *** P < 0.001.

- Submitted by
- Invitrogen Antibodies (provider)
- Main image

- Experimental details
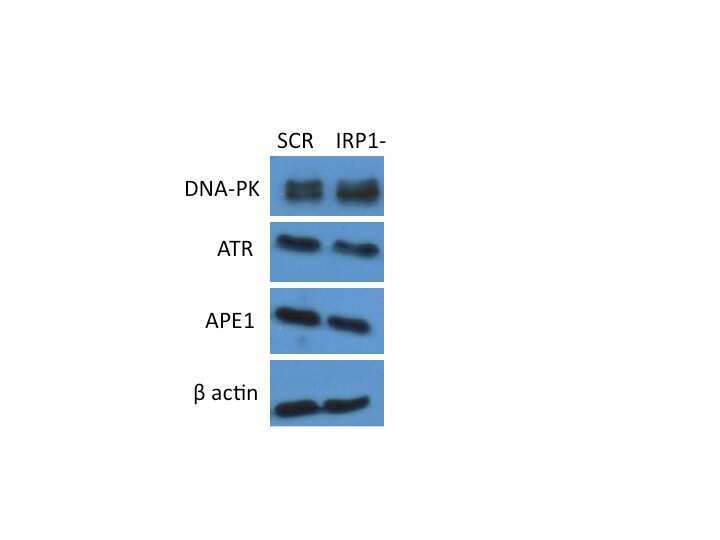
- Figure 1 shRNA-expressing viral particles reduce the level of IRP1 mRNA and increase FLC expression. Panel a: following viral infection and selection on puromycin, cells were assayed by qPCR to measure IRP1 transcript levels. Results are plotted as ratio of IRP1 transcript to beta actin transcript. Results are mean +/- SEM of three independent experiments. A paired t-test was used to test significance (* = p
- Submitted by
- Invitrogen Antibodies (provider)
- Main image

- Experimental details
- Fig 3 ITO production particles cause IkappaBalpha degradation. Representative western blot images of IkappaBalpha and actin from treated RAW ( A ) and BEAS-2B ( C ) cell lysates. Cells were treated with particle suspensions for 1 or 3 h, washed twice with PBS, and lysed. B, D . Densitometry analysis was performed and is represented as the percentage of IkappaBalpha compared to levels present in PBS control-treated lysates. Error bars represent the mean +- SD (n = 4). *, p < 0.05 compared to PBS.
- Submitted by
- Invitrogen Antibodies (provider)
- Main image

- Experimental details
- FIGURE 2 Exogenous MDVs mitigate hypoxia-induced H9C2 cardiomyocyte apoptosis. (A) Transmission electron microscopy images of the MDVs. (B) Results of particle size analysis showed that MDVs were predominantly ~50-150 nm in size. (C) H9C2 cells were treated with PKH26 (red) labeled MDVs (12 mug/mL) for 2 h. Reconstituted hypoxic MDVs were created from mitochondria isolated from ex vivo isolated Langendorff-perfused rat hearts and grouped into normoxic- (n-MDVs), mild hypoxic- (m-MDVs), and heavy hypoxic MDVs (h-MDVs). H9C2 cells were treated as indicated for 12 h: blank (without hypoxia), ctl (hypoxia alone), n-MDV (hypoxia + n-MDVs), m-MDV (hypoxia + m-MDVs), and h-MDV (hypoxia + h-MDVs). (D,E) Hypoxia significantly increased the number of apoptotic cells, which was improved by the addition of the MDVs ( n = 3); P values were estimated using one-way ANOVA with Bonferroni''s post hoc test; # P < 0.05 versus blank, * P < 0.05 versus ctl, ** P < 0.01 versus ctl. (F) Hypoxia treatment significantly increased caspase 3 activity, while all three types of MDVs reversed this trend ( n = 3); P values were estimated by one-way ANOVA with Bonferroni''s post hoc test; # P < 0.05 versus blank, * P < 0.05 versus ctl, ** P < 0.01 versus ctl. (G) H9C2 cells were treated as indicated for 12 h and immunolabeled to identify cleaved-caspase 3 (c-caspase 3, green) and nuclear material (DAPI-blue). Hypoxia significantly upregulated the expression of c-caspase 3, which could be reversed by treatme

- Submitted by
- Invitrogen Antibodies (provider)
- Main image

- Experimental details
- FIGURE 3 Exogenous MDVs protect against hypoxia-induced H9C2 cardiomyocyte apoptosis via the mitochondrial pathway. H9C2 cells were treated as follows for 12 h: blank (without hypoxia), ctl (hypoxia alone), n-MDV (hypoxia + n-MDVs), m-MDV (hypoxia + m-MDVs), and h-MDV (hypoxia + h-MDVs). (A) Hypoxia significantly increased caspase 9 activity, with all three types of MDVs reversing this trend ( n = 3); # P < 0.05 versus blank, * P < 0.05 versus ctl. (B) Hypoxia significantly upregulated the expression of cleaved-caspase 9 (c-caspase 9), and treatment with MDVs could reverse some of this increased expression ( n = 3); P values were estimated using one-way ANOVA with Bonferroni''s post hoc test; # P < 0.05 versus blank, * P < 0.05 versus ctl. (C,D) Hypoxia significantly upregulated the expression of cytoplasmic CytC and reduced the expression of mitochondrial CytC, both of which were reversed following treatment with MDVs ( n = 3); P values were estimated using one-way ANOVA with Bonferroni''s post hoc test; # P < 0.05 versus blank, * P < 0.05 versus ctl, ** P < 0.01 versus ctl.

- Submitted by
- Invitrogen Antibodies (provider)
- Main image

- Experimental details
- FIGURE 4 Exogenous MDVs exert direct protective effects on mitochondria. (A) Representative images of the colocalization of MDVs labeled with PKH26 (red) and mitochondria labeled with MitoTracker Green (green). (B) H9C2 cells were treated as indicated for 12 h. Hypoxia significantly reduced intracellular ATP levels, which could be reversed following treatment with any of the three types of MDVs ( n = 3); P values were estimated by one-way ANOVA with Bonferroni''s post hoc test; # P < 0.05 versus blank, * P < 0.05 versus ctl, ** P < 0.01 versus ctl. (C) H9C2 cells were treated as indicated for 12 h and ROS generation was evaluated using DCFH-DA dye. Hypoxia significantly increased intracellular ROS levels, which could be reversed by any of the three types of MDVs. (D) H9C2 cells were treated as indicated for 3 h and mPTP opening was assessed by co-loading calcein AM and CoCl 2 . Opening of mPTP was significantly enhanced following hypoxia and was seen to significantly decrease following the addition of MDVs. (E) H9C2 cells were treated as indicated for 12 h. Hypoxia significantly upregulated the expression of CHOP and cleaved-caspase 12 (c-caspase 12), but no significant changes were observed following the addition of any of the three types of MDVs ( n = 3); P values were estimated using one-way ANOVA with Bonferroni''s post hoc test; * P < 0.05 versus blank.
- Submitted by
- Invitrogen Antibodies (provider)
- Main image
- Experimental details
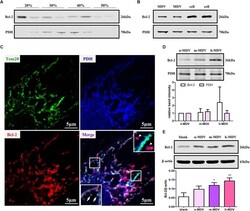
- FIGURE 5 Exogenous MDVs protect against hypoxia-induced H9C2 cardiomyocyte apoptosis by conveying Bcl-2. (A) H9C2 cells were subjected to hypoxic conditions for 1 h and then homogenized for fractionation. Light fraction containing Bcl-2 appeared at the 20/30% sucrose interface and a heavier fraction containing Bcl-2 sedimented at the 40/50% interface. (B) Proteins were collected from MDVs for Western blot (whole cell protein served as a control). (C) H9C2 cells were treated with hypoxia for 1 h and immunolabeled for TOM20 (green), Bcl-2 (red), and PDH (blue). TOM20 + vesicles could be observed (white arrow); Bcl-2 + /PDH + vesicles (white triangle) rather than Bcl-2 + /TOM20 + vesicles were observed. (D) Proteins were collected from different types of MDVs, and equal quantities of MDV proteins were used for Bcl-2 detection. (E) H9C2 cells were treated with the three types of MDVs and total proteins were collected, showing that cells treated with MDVs had more Bcl-2 than the control ( n = 3); P values were estimated using one-way ANOVA with Bonferroni''s post hoc test; * P < 0.05 versus blank, ** P < 0.01 versus blank.

- Submitted by
- Invitrogen Antibodies (provider)
- Main image
- Experimental details
- Figure 5 Western blotting for the expression of signaling protein. (A,B) Cell lysate were collected and subjected to Western blot assay to estimate the level of expression of interleukin 1 receptor-associated kinase 1 (IRAK1), transforming growth factor beta-activated kinase 1 (TAK1), TGF-beta-activated kinase 1 (TAB1), TNF receptor-associated factor 6 (TRAF6), and cyclin D1. (C,D) Expression of pIRAK1 and pTAK1. beta-actin was used as loading control. The respective bar graphs are presented as densitometry analysis as mean +- SD of experiments ( p < 0.05 is treated as significant).

- Submitted by
- Invitrogen Antibodies (provider)
- Main image

- Experimental details
- Figure 5. Mutation of the automethylated lysines decreases PRC2 HMTase activity in vitro and in vivo. ( A ) Mutation of the three lysines (K510A K514A K515A, ""methylmutant"") decreases PRC2 activity on reconstituted trinucleosomes relative to activity of WT PRC2 preincubated with SAM. Another mutant (K514A K515A) showed less perturbation of catalytic activity. Radioactive 14 C-SAM was titrated from 1.3 to 12 uM. ( Right ) Quantification of the automethylation and H3K27 methylation signal of WT and methylmutant (mean +- SD, n = 3). ( B ) Mutation of the three lysines (K > A) decreases PRC2 activity on native polynucleosome substrate, whereas the triple K > R mutant has substantially normal activity. ( C ) EZH2 automethylation is essential for de novo H3K27me3 deposition. ( Left ) WT or methylmutant EZH2 plasmid was transfected into the EZH2-depleted HEK293T strain to test for restoration of the H3K27me3 level. ( Middle ) Western blot results of the strains transfected with WT, methylmutant, or blank control, with beta-actin used as a loading control. Nine microliters or 4.5 uL of lysate was loaded on the gel for Western blot analysis. ( Right ) Quantification of the EZH2, H3K27me3, and H3K27me2 Western blot results (9 uL of lysate), normalized to beta-actin. ( D ) EZH2 automethylation is dispensable for H3K27me3 maintenance. ( Left ) CRISPR-Cas9 gene-editing scheme. cDNA encoding the remaining amino acids of full-length EZH2 is inserted into exon 2 of the EZH2 locus. The cDNA

- Submitted by
- Invitrogen Antibodies (provider)
- Main image

- Experimental details
- Figure 9 B-actin immunostained sections in the spleen showing A: Control group shows strong positive reaction in red and white pulps. B: TTA-treated group showing weak reaction in red and white pulp. C: Rapamycin-treated group showing weak reaction in the red and white pulp. D: Filgrastim-treated group showing strong positive reaction. E: Combined rapamycin and filgrastim group showing strong positive reaction (Immunoperoxidase technique for B-actin x40, scale bar 30 um) TTA: thioacetamide

- Submitted by
- Invitrogen Antibodies (provider)
- Main image

- Experimental details
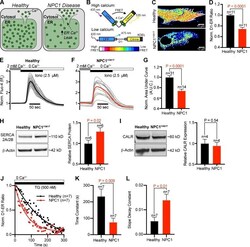
- Figure 1. NPC1 disease fibroblasts have altered cholesterol homeostasis and Ca 2+ signaling. (A) Left: Representative Western blot of NPC1 in healthy and NPC1 I1061T disease fibroblasts. Right: Quantification of NPC1 protein expression, normalized to beta-actin. (B) Representative superresolution images of healthy and NPC1 I1061T fibroblasts fixed and stained with filipin to show cholesterol distribution. Scale bar of inset represents 2.5 um. (C) Representative time series from Fluo-4-loaded healthy and NPC1 I1061T fibroblasts. (D-F) Quantification of Fluo-4 signals from healthy and NPC1 I1061T fibroblasts. (G) Comparison of resting fura-2 ratios. Error bars represent the standard error of the mean.

- Submitted by
- Invitrogen Antibodies (provider)
- Main image

- Experimental details
- Figure 2. Resting SOCE, coupled with STIM1/ORAI1 expression and distribution, is increased in NPC1 I1061T fibroblasts. (A) Diagram of SOCE in healthy cells (i), schematic of GCAMP-CAAX Ca 2+ probe in healthy cells (ii), and representative live confocal images of a healthy cell expressing GCAMP-CAAX (iii). (B) Same as A, only for NPC1 I1061T fibroblasts. (C) Quantification of resting GCAMP-CAAX fluorescence. Gray portion indicates the AnCoA4-sensitive reduction in resting fluorescence. (D) Left: Representative ORAI1 Western blot from healthy and NPC1 I1061T fibroblasts. Right: Quantification of ORAI1 protein expression in fibroblasts, normalized to beta-actin. (E) Same as D, only for STIM1. (F) Top: Representative TIRF images from healthy and NPC1 I1061T fibroblasts stained for anti-ORAI1. Bottom: Superresolution localization map from dashed boxes within the TIRF images; dashed lines delineate edges of cells. Inset: Representative ORAI1 puncta. Scale bar represents 0.25 um. (G) Quantification of anti-ORAI1 localization map. (H and I) Same as F and G, only for STIM1. Error bars represent the standard error of the mean.

- Submitted by
- Invitrogen Antibodies (provider)
- Main image
- Experimental details
- Figure 4. Resting luminal ER Ca 2+ is reduced in NPC1 I1061T fibroblasts. (A) Graphical depiction of differential ER Ca 2+ , mediated by enhanced ER Ca 2+ leak in NPC1 I1061T fibroblasts. (B) Schematic of D1-ER Ca 2+ probe. (C) Representative live confocal images of healthy and NPC1 I1061T fibroblasts expressing D1-ER. (D) Quantification of D1-ER FRET ratios. (E) Normalized individual Fluo-4 intensities (gray) and averaged intensity (black, n = 31) from healthy fibroblasts following addition of a Ca 2+ -free ionomycin-containing external solution. (F) Same as E, only NPC1 I1061T fibroblasts (red, n = 14). (G) Quantification of the normalized area under the ionomycin curve. (H) Left: Representative Western blot for SERCA 2A/2B from healthy and NPC1 I1061T lysates. Right: Quantification of protein expression, normalized to beta-actin. (I) Same as H, only for calreticulin (CALR). (J) Normalized D1-ER FRET ratios from healthy (black circles) and NPC1 I1061T fibroblasts (red squares) following application of TG. Fitted lines (healthy: black; NPC1 I1061T : red) represent one-phase decay curves. (K and L) Quantitative comparison of the slope decay and time constant from the healthy and NPC1 I1061T nonlinear regression curves. Error bars represent the standard error of the mean.

- Submitted by
- Invitrogen Antibodies (provider)
- Main image

- Experimental details
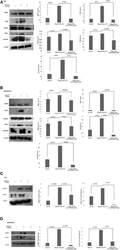
- Figure 5. Differential expression of PSEN1 alters ER Ca 2+ and SOCE in NPC1 I1061T fibroblasts. (A) Representative PSEN1-NTF and PSEN1-CTF Western blots from healthy and NPC1 I1061T cells with or without siRNA targeting PSEN1. (B) Quantification of differential protein expression, normalized to beta-actin. (C) Top: Representative PSEN1 Western blot from tsA-201 cells transfected with PSEN1 and treated with NPC1 inhibitor, UA, or vehicle control. Bottom: Quantification of differential PSEN1 protein expression, normalized to beta-actin. (D) Averaged intracellular Fluo-4 responses following ionomycin treatment in NPC1 I1061T fibroblasts transfected for 48 h with either negative control siRNA (red) or siRNA targeting PSEN1 (orange). (E) Quantification of AUC, from NPC1 I1061T fibroblasts transfected with PSEN1 (orange) or control (red) siRNA. (F) Averaged time-course of NPC1 I1061T fibroblasts transfected with control siRNA (red) or siRNA targeting PSEN1 (orange). (G) Quantification of the AUC during TG. (H) Quantification of the AUC during SOCE. (I) Representative Western blot of NPC1 in healthy and NPC1 I1061T fibroblasts with or without siRNA (24 h) targeting PSEN1. (J) Quantification of differential protein expression, normalized to beta-actin. (K) Representative superresolution images of filipin staining from NPC1 I1061T fibroblasts treated with control or PSEN1 siRNA for 72 h. (L-N) Quantification of superresolution filipin images. Error bars represent the standard error of

- Submitted by
- Invitrogen Antibodies (provider)
- Main image

- Experimental details
- Figure 1. CPT1C is necessary for proper axon growth. ( A ) Primary cortical neurons derived from WT and Cpt1c KO E16 mouse embryos were cultured and fixed at 4DIV. Then, axons were labeled with a specific marker (SMI-312; in green) and nuclei were detected with Hoechst staining (blue). CPT1C absence in KO cultures was corroborated by western blot. Axonal length was analyzed from three independent experiments performed in biological triplicates. Right graph shows the percentage of cells with axons of a certain length (intervals of 50 um), while in left graph the mean +- SEM of all axons is shown (n = 100 cells per genotype; Student's t test; ***p

- Submitted by
- Invitrogen Antibodies (provider)
- Main image

- Experimental details
- Figure 3. CPT1C-protrudin interaction. ( A ) CPT1C-protrudin binding was analyzed in HeLa cells by co-immunoprecipitation (co-IP). HeLa cells were co-transfected with mCitrine-protrudin or mCitrine-ER-5 (Citrine-KDEL) and MYC-CPT1C. 36 hr later, citrine-containing proteins were immunoprecipitated with the GFP-Trap assay, and the indicated proteins were detected by immunoblot in whole lysate (input) and immunoprecipitated samples (IP). The co-IP was performed in biological triplicates. A representative image of the experiment is shown. ( B-C ) Binding evaluation by FRET assay in HEK293 cells. Percentage of FRET was measured by the increase of donor intensity after photobleaching. mTurquoise-ER (KDEL), mTurquoise-calnexin and Tubulin-mTurquoise2 (TUB) with CPT1C-SYFP2 were used as negative interactions, while Atlastin1-mTurquoise2 (ATL1) with protrudin-SYFP2 and atlastin-1-mTurquoise2 with CPT1C-SYFP2, as positive controls. Representative images of transfected cells with proteins fused to mTurquoise2 (donor; red) or SYFP2 (acceptor; green) are shown in B. Scale bar, 20 um. Values are shown in C as mean +- SD of 2 independent experiments performed in biological duplicates (n = 5-11 cells per condition were analyzed; One-way ANOVA followed by Bonferroni's multiple comparison test; **p
