 Explore
 Validate
 Learn
Learn Western blot
Antibody data
- Antibody Data
- Antigen structure
- References [7]
- Comments [0]
- Validations
- Western blot [2]
- Immunocytochemistry [1]
- Other assay [12]
Submit
Validation data
Reference
Comment
Report error
- Product number
- MA5-15739-D800 - Provider product page

- Provider
- Invitrogen Antibodies
- Product name
- beta Actin Loading Control Monoclonal Antibody (BA3R), DyLight™ 800 4X PEG
- Antibody type
- Monoclonal
- Antigen
- Synthetic peptide
- Description
- MA5-15739-D800 has been successfully used for Western blotting and immunofluorescence. DyLight 800 4X PEG has an excitation/emission of 783/797 nm. For visualization of actin filaments by immunofluorescence, fixation and permeabilization with methanol is required.
- Reactivity
- Human, Mouse, Rat, Chicken/Avian, Rabbit
- Host
- Mouse
- Isotype
- IgG
- Antibody clone number
- BA3R
- Vial size
- 50 µL
- Concentration
- 1 mg/mL
- Storage
- 4° C, store in dark
Submitted references Genome-scale CRISPR-Cas9 screen of Wnt/β-catenin signaling identifies therapeutic targets for colorectal cancer.
Sevoflurane inhibits the proliferation and invasion of hepatocellular carcinoma cells through regulating the PTEN/Akt/GSK‑3β/β‑catenin signaling pathway by downregulating miR‑25‑3p.
CLEC14A deficiency exacerbates neuronal loss by increasing blood-brain barrier permeability and inflammation.
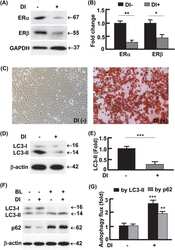
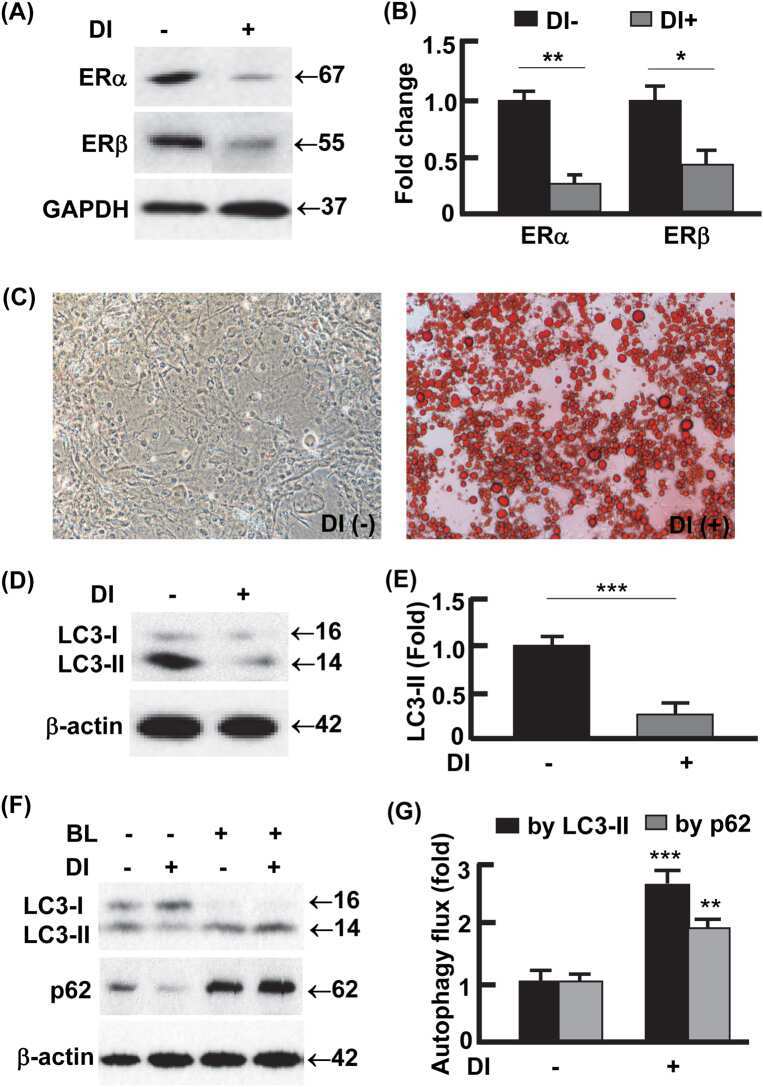
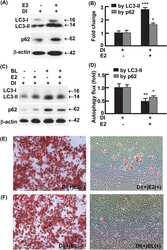
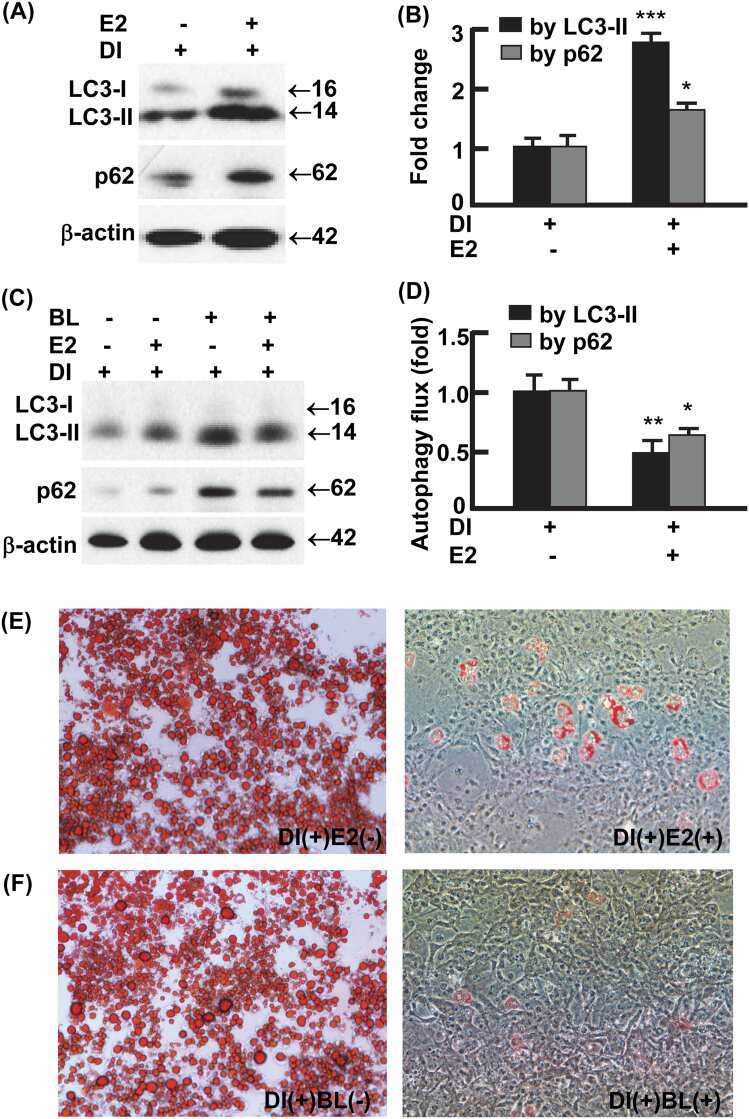
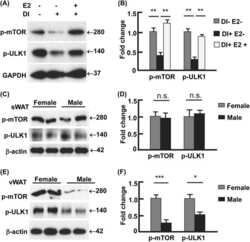
Estradiol signaling mediates gender difference in visceral adiposity via autophagy.
The SP100 component of ND10 enhances accumulation of PML and suppresses replication and the assembly of HSV replication compartments.
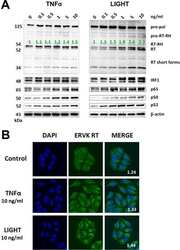
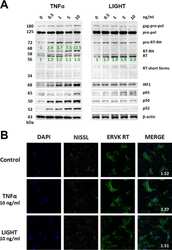
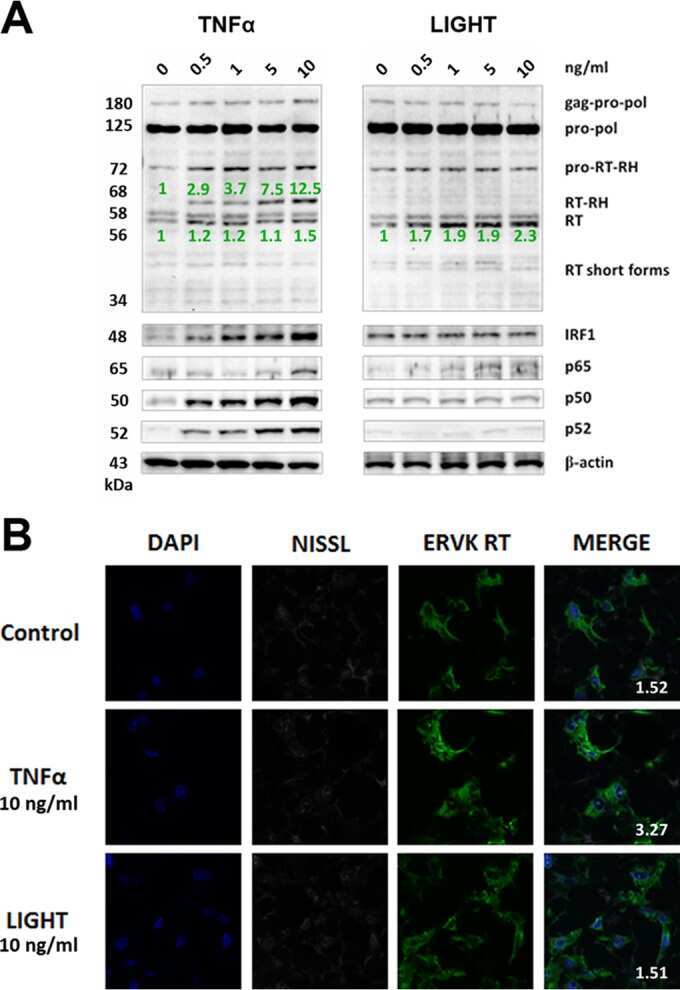
NF-κB and IRF1 Induce Endogenous Retrovirus K Expression via Interferon-Stimulated Response Elements in Its 5' Long Terminal Repeat.
A comparison of genetically matched cell lines reveals the equivalence of human iPSCs and ESCs.
Wan C, Mahara S, Sun C, Doan A, Chua HK, Xu D, Bian J, Li Y, Zhu D, Sooraj D, Cierpicki T, Grembecka J, Firestein R
Science advances 2021 May;7(21)
Science advances 2021 May;7(21)
Sevoflurane inhibits the proliferation and invasion of hepatocellular carcinoma cells through regulating the PTEN/Akt/GSK‑3β/β‑catenin signaling pathway by downregulating miR‑25‑3p.
Cao Y, Lv W, Ding W, Li J
International journal of molecular medicine 2020 Jul;46(1):97-106
International journal of molecular medicine 2020 Jul;46(1):97-106
CLEC14A deficiency exacerbates neuronal loss by increasing blood-brain barrier permeability and inflammation.
Kim Y, Lee S, Zhang H, Lee S, Kim H, Kim Y, Won MH, Kim YM, Kwon YG
Journal of neuroinflammation 2020 Feb 4;17(1):48
Journal of neuroinflammation 2020 Feb 4;17(1):48
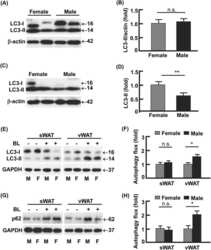
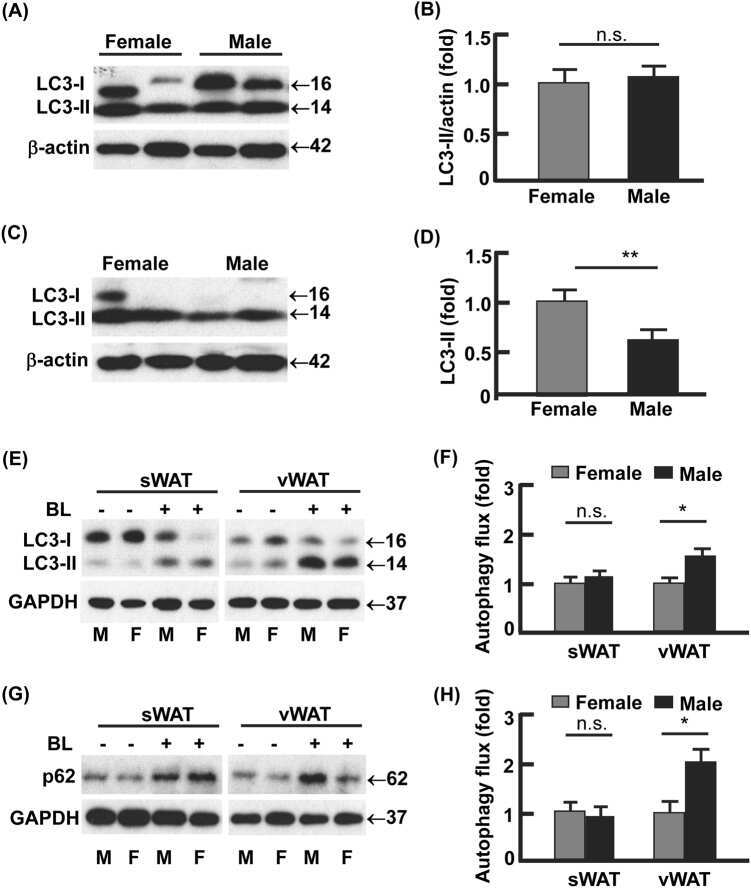
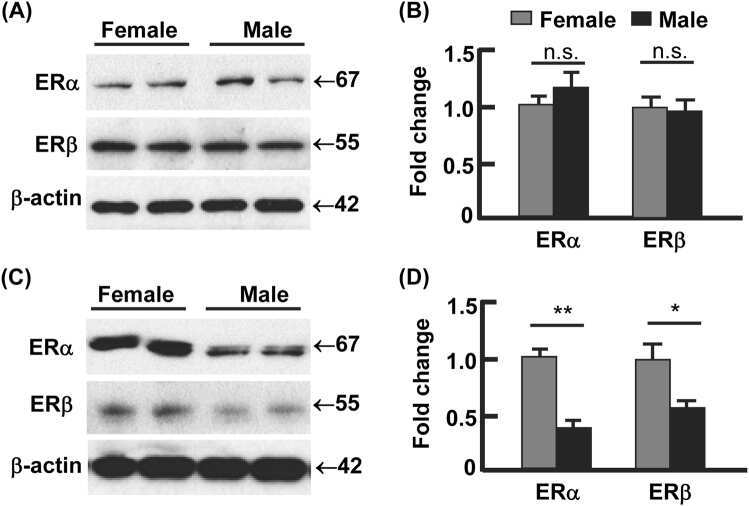
Estradiol signaling mediates gender difference in visceral adiposity via autophagy.
Tao Z, Zheng LD, Smith C, Luo J, Robinson A, Almeida FA, Wang Z, Olumi AF, Liu D, Cheng Z
Cell death & disease 2018 Feb 22;9(3):309
Cell death & disease 2018 Feb 22;9(3):309
The SP100 component of ND10 enhances accumulation of PML and suppresses replication and the assembly of HSV replication compartments.
Xu P, Roizman B
Proceedings of the National Academy of Sciences of the United States of America 2017 May 9;114(19):E3823-E3829
Proceedings of the National Academy of Sciences of the United States of America 2017 May 9;114(19):E3823-E3829
NF-κB and IRF1 Induce Endogenous Retrovirus K Expression via Interferon-Stimulated Response Elements in Its 5' Long Terminal Repeat.
Manghera M, Ferguson-Parry J, Lin R, Douville RN
Journal of virology 2016 Oct 15;90(20):9338-49
Journal of virology 2016 Oct 15;90(20):9338-49
A comparison of genetically matched cell lines reveals the equivalence of human iPSCs and ESCs.
Choi J, Lee S, Mallard W, Clement K, Tagliazucchi GM, Lim H, Choi IY, Ferrari F, Tsankov AM, Pop R, Lee G, Rinn JL, Meissner A, Park PJ, Hochedlinger K
Nature biotechnology 2015 Nov;33(11):1173-81
Nature biotechnology 2015 Nov;33(11):1173-81
No comments: Submit comment
Supportive validation
- Submitted by
- Invitrogen Antibodies (provider)
- Main image

- Experimental details
- Western blot analysis of Beta-Actin was performed by loading 50 µg of various cell lysates per well onto a 4-20% Tris-HCl polyacrylamide gel. Proteins were transferred to a nitrocellulose membrane and blocked with SEA BLOCK (Product # 37527) for at least 1 hour. The membrane was probed with a DyLight 800-conjugated Beta-Actin monoclonal antibody (Product # MA5-15739-D800) at a dilution of 1:1000 for 1 hour at room temperature on a rocking platform and washed in TBS-0.1% Tween-20. Detection was performed using the LI-COR Odyssey.

Supportive validation
- Submitted by
- Invitrogen Antibodies (provider)
- Main image
- Experimental details
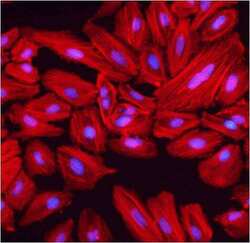
- Immunofluorescent analysis of beta-actin (red) in HeLa cells. Cells were fixed and permeabilized with ice-cold methanol for 10 minutes at room temperature, blocked with 0.3% BSA in PBS for 15 minutes, and probed with a DyLight 800-conjugated beta-actin monoclonal antibody (Product # MA5-15739-D800) at a dilution of 1:100 overnight at 4°C. Nuclei (blue) were stained with DAPI (Product # 62247). Images were taken on an EVOS® FL Auto Cell Imaging Station at 20X magnification.

Supportive validation
- Submitted by
- Invitrogen Antibodies (provider)
- Main image
- Experimental details
- NULL
- Submitted by
- Invitrogen Antibodies (provider)
- Main image

- Experimental details
- NULL
- Submitted by
- Invitrogen Antibodies (provider)
- Main image
- Experimental details
- NULL
- Submitted by
- Invitrogen Antibodies (provider)
- Main image
- Experimental details
- NULL
- Submitted by
- Invitrogen Antibodies (provider)
- Main image
- Experimental details
- NULL

- Submitted by
- Invitrogen Antibodies (provider)
- Main image
- Experimental details
- NULL

- Submitted by
- Invitrogen Antibodies (provider)
- Main image
- Experimental details
- NULL
- Submitted by
- Invitrogen Antibodies (provider)
- Main image

- Experimental details
- NULL

- Submitted by
- Invitrogen Antibodies (provider)
- Main image
- Experimental details
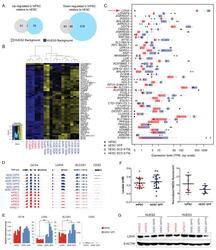
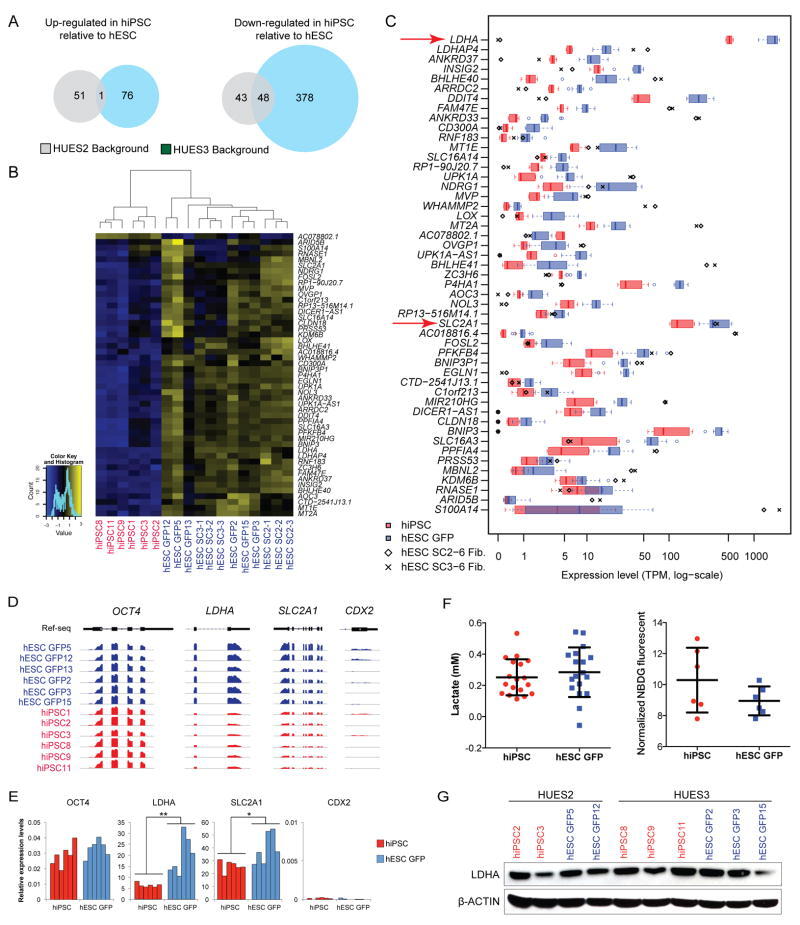
- Figure 3 Differentially expressed genes (DEGs) between isogenic hESC and hiPSC lines (a) Venn diagram showing the number of genes consistently up- or down- regulated in 3 biological replicate hiPSC lines when compared to 3 biological replicate hESC GFP lines from the same genetic background. (FDR
- Submitted by
- Invitrogen Antibodies (provider)
- Main image

- Experimental details
- Fig. 6 Targeting KMT2A-menin association suppresses beta-catenin activity and preferentially reduced the viability of beta-catenin-active CRC cells and CRC organoids. ( A ) RT-qPCR analysis of ASCL2, cMYC, and LGR5 expression in control and KMT2A-N-overexpressing CRC cells. NC, negative control. ( B ) Western blot analysis of cMYC, beta-catenin, and KMT2A-N expression in DLD1 and SW480 cells 14 days after infection with lentiviruses harboring the KMT2A-N fragment or a vector control. ( C ) The cell confluency curves of control and KMT2A-N-overexpressing DLD1 cells. Control and KMT2A-N-overexpressing DLD1 cells were seeded into 96-well plates at day 7 after infection and subjected to confluency analysis (Incucyte). Statistical difference was examined using two-way ANOVA and Dunnett's post hoc test. ( D ) The viability of beta-catenin-active and beta-catenin-inactive cells was determined following exposure to KMT2A chemical inhibitors MI-463. ( E ) RT-qPCR analysis of c MYC expression in DLD1 and RKO cells following vehicle or different doses of MI-436 treatment. Differences among vehicle and MI-436 groups were analyzed using one-way ANOVA and Dunnett's post hoc test. ( F ) The colony formation of DLD1 and RKO cells following exposure to 100 or 200 nM MI-463. Differences among groups were assessed using one-way ANOVA and Dunnett's post hoc test. ( G ) Normalized viability of nontumoral and tumoral organoids following treatment with different concentrations of MI-463 for 3 weeks

- Submitted by
- Invitrogen Antibodies (provider)
- Main image

- Experimental details
- Fig. 2 Loss of CLEC14A exacerbated cerebral injury with VEGFR2 activation in MCAO stroke model. a , c Images of whole brains and comparison of Evans blue dye (EB) leakage in brains (P8 and adult) after EB injection (intraperitoneal route) in WT and CLEC14A KO mice ( n = 6, each group). b , d The quantitative analysis of Evans blue (EB) dye extravasation using spectrophotometer, 24 h after intraperitoneal injection of EB dye. e TTC staining of brain slices in the sham, WT, and CLEC14A KO groups 24-h post ischemia-reperfusion. Severe infarction was present in the CLEC14A KO group. Scale bar = 1 mm. f Percentage of infarct volume in the WT and CLEC14A KO groups 24 h after ischemia-reperfusion. g Neurological scores of WT and CLEC14A KO mice were evaluated. h VEGFR2, pVEGFR2 protein expression in ipsilateral brain lysate after ischemia-reperfusion injury. i , j Quantification data of relative pVEGFR2 and VEGFR2 protein expression. n = 6 per group; * P < 0.05, ** P < 0.01, *** P < 0.001. The results are mean values and the error bars represent the mean +- SD

- Submitted by
- Invitrogen Antibodies (provider)
- Main image

- Experimental details
- Fig. 4 CLEC14A deletion attenuated tight junctional proteins in cerebral ischemic regions. a Immunofluorescence staining for Occludin, Claudin-5, ZO-1, and CD31 with DAPI in the ischemic cortex of WT and CLEC14A KO mice 24 h after ischemia-reperfusion. n = 6 per group. Scale bars: 20 mum. b Quantitative analysis of Occludin/CD31 ratio. c Quantitative analysis of Claudin-5/CD31 ratio. d Quantitative analysis of ZO-1/CD31 ratio. e , f Western blot analysis of tight junctional proteins from ischemic brain and quantitative graph. * P < 0.05, ** P < 0.01, and *** P < 0.001. The results are mean values and the error bars represent the mean +- SD
