Explore
 Validate
 Learn
Learn Western blot
 Immunoprecipitation
Antibody data
- Antibody Data
- Antigen structure
- References [29]
- Comments [0]
- Validations
- Western blot [11]
- Immunocytochemistry [1]
- Immunohistochemistry [2]
- Other assay [31]
Submit
Validation data
Reference
Comment
Report error
- Product number
- PA1-16889 - Provider product page

- Provider
- Invitrogen Antibodies
- Product name
- beta Actin Polyclonal Antibody
- Antibody type
- Polyclonal
- Antigen
- Other
- Description
- Suggested positive control: Hela whole cell extract.
- Reactivity
- Human, Mouse, Canine
- Host
- Rabbit
- Isotype
- IgG
- Vial size
- 100 µg
- Concentration
- 1 mg/mL
- Storage
- Store at 4°C short term. For long term storage, store at -20°C, avoiding freeze/thaw cycles.
Submitted references Regulation of rod photoreceptor function by farnesylated G-protein γ-subunits.
Optimization of small extracellular vesicle isolation from expressed prostatic secretions in urine for in-depth proteomic analysis.
EML1 is essential for retinal photoreceptor migration and survival.
Spatiotemporal analysis of soluble aggregates and autophagy markers in the R6/2 mouse model.
ECRG4 Represses Cell Proliferation and Invasiveness via NFIC/OGN/NF-κB Signaling Pathway in Bladder Cancer.
An acidic polysaccharide (AGC3) isolated from North American ginseng (Panax quinquefolius) suspension culture as a potential immunomodulatory nutraceutical.
Dl-3-n-Butylphthalide promotes neovascularization and neurological recovery in a rat model of intracerebral hemorrhage.
Nedd4 ubiquitylates VDAC2/3 to suppress erastin-induced ferroptosis in melanoma.
Towards Age-Related Anti-Inflammatory Therapy: Klotho Suppresses Activation of ER and Golgi Stress Response in Senescent Monocytes.
Radiation-induced DNA damage and repair effects on 3D genome organization.
Neuronal life or death linked to depression treatment: the interplay between drugs and their stress-related outcomes relate to single or combined drug therapies.
C-reactive protein expression in adipose tissue of children with acute appendicitis.
Immune stimuli shape the small non-coding transcriptome of extracellular vesicles released by dendritic cells.
Melatonin receptors subtypes (MT1 and MT2) in the uterus masculinus of mature male european bison. Biological and seasonal reproductive role.
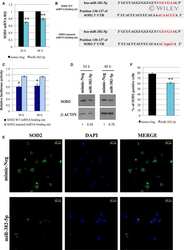
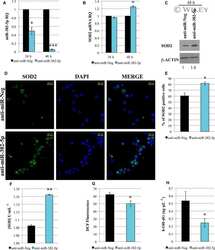
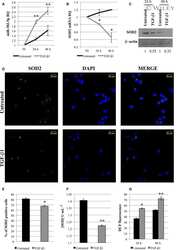
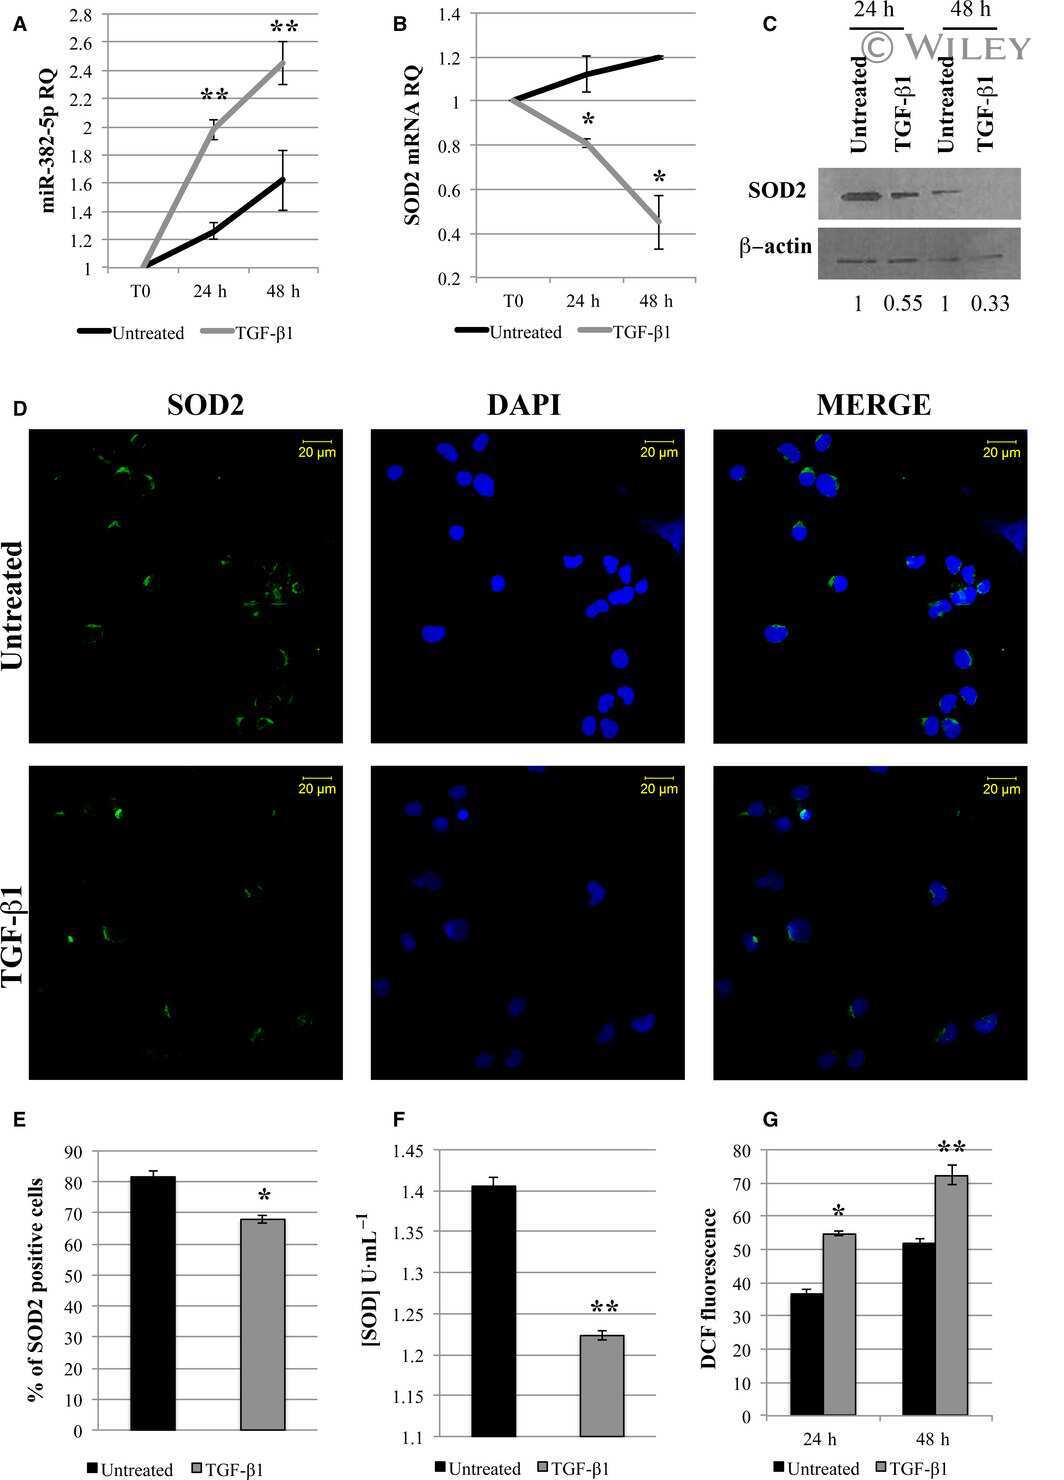
Role of TGF-β1/miR-382-5p/SOD2 axis in the induction of oxidative stress in CD34+ cells from primary myelofibrosis.
miR-494-3p overexpression promotes megakaryocytopoiesis in primary myelofibrosis hematopoietic stem/progenitor cells by targeting SOCS6.
Deregulated expression of miR-29a-3p, miR-494-3p and miR-660-5p affects sensitivity to tyrosine kinase inhibitors in CML leukemic stem cells.
Protective role of klotho protein on epithelial cells upon co-culture with activated or senescent monocytes.
Role of miR-34a-5p in Hematopoietic Progenitor Cells Proliferation and Fate Decision: Novel Insights into the Pathogenesis of Primary Myelofibrosis.
EBI2 receptor regulates myelin development and inhibits LPC-induced demyelination.
Long-term culture with lipopolysaccharide induces dose-dependent cytostatic and cytotoxic effects in THP-1 monocytes.
Identification of the epigenetic reader CBX2 as a potential drug target in advanced prostate cancer.
MyD88/CD40 Genetic Adjuvant Function in Cutaneous Atypical Antigen-Presenting Cells Contributes to DNA Vaccine Immunogenicity.
miR-382-5p Controls Hematopoietic Stem Cell Differentiation Through the Downregulation of MXD1.
Dose-dependent autophagic effect of titanium dioxide nanoparticles in human HaCaT cells at non-cytotoxic levels.
MYB controls erythroid versus megakaryocyte lineage fate decision through the miR-486-3p-mediated downregulation of MAF.
Evaluation of PAX5 gene in the early stages of leukemic B cells in the childhood B cell acute lymphoblastic leukemia.
DGAT enzymes are required for triacylglycerol synthesis and lipid droplets in adipocytes.
The lysine demethylase LSD1 (KDM1) is required for maintenance of global DNA methylation.
Kolesnikov AV, Lobysheva E, Gnana-Prakasam JP, Kefalov VJ, Kisselev OG
PloS one 2022;17(8):e0272506
PloS one 2022;17(8):e0272506
Optimization of small extracellular vesicle isolation from expressed prostatic secretions in urine for in-depth proteomic analysis.
Correll VL, Otto JJ, Risi CM, Main BP, Boutros PC, Kislinger T, Galkin VE, Nyalwidhe JO, Semmes OJ, Yang L
Journal of extracellular vesicles 2022 Feb;11(2):e12184
Journal of extracellular vesicles 2022 Feb;11(2):e12184
EML1 is essential for retinal photoreceptor migration and survival.
Poria D, Sun C, Santeford A, Kielar M, Apte RS, Kisselev OG, Chen S, Kefalov VJ
Scientific reports 2022 Feb 21;12(1):2897
Scientific reports 2022 Feb 21;12(1):2897
Spatiotemporal analysis of soluble aggregates and autophagy markers in the R6/2 mouse model.
Kumar MJV, Shah D, Giridharan M, Yadav N, Manjithaya R, Clement JP
Scientific reports 2021 Jan 8;11(1):96
Scientific reports 2021 Jan 8;11(1):96
ECRG4 Represses Cell Proliferation and Invasiveness via NFIC/OGN/NF-κB Signaling Pathway in Bladder Cancer.
Liang X, Gao J, Wang Q, Hou S, Wu C
Frontiers in genetics 2020;11:846
Frontiers in genetics 2020;11:846
An acidic polysaccharide (AGC3) isolated from North American ginseng (Panax quinquefolius) suspension culture as a potential immunomodulatory nutraceutical.
Ghosh R, Bryant DL, Arivett BA, Smith SA, Altman E, Kline PC, Farone AL
Current research in food science 2020 Nov;3:207-216
Current research in food science 2020 Nov;3:207-216
Dl-3-n-Butylphthalide promotes neovascularization and neurological recovery in a rat model of intracerebral hemorrhage.
Tu E, Chen Q, Tan L, Wang Y
BMC neuroscience 2020 May 29;21(1):24
BMC neuroscience 2020 May 29;21(1):24
Nedd4 ubiquitylates VDAC2/3 to suppress erastin-induced ferroptosis in melanoma.
Yang Y, Luo M, Zhang K, Zhang J, Gao T, Connell DO, Yao F, Mu C, Cai B, Shang Y, Chen W
Nature communications 2020 Jan 23;11(1):433
Nature communications 2020 Jan 23;11(1):433
Towards Age-Related Anti-Inflammatory Therapy: Klotho Suppresses Activation of ER and Golgi Stress Response in Senescent Monocytes.
Mytych J, Sołek P, Będzińska A, Rusinek K, Warzybok A, Tabęcka-Łonczyńska A, Koziorowski M
Cells 2020 Jan 21;9(2)
Cells 2020 Jan 21;9(2)
Radiation-induced DNA damage and repair effects on 3D genome organization.
Sanders JT, Freeman TF, Xu Y, Golloshi R, Stallard MA, Hill AM, San Martin R, Balajee AS, McCord RP
Nature communications 2020 Dec 2;11(1):6178
Nature communications 2020 Dec 2;11(1):6178
Neuronal life or death linked to depression treatment: the interplay between drugs and their stress-related outcomes relate to single or combined drug therapies.
Solek P, Koszla O, Mytych J, Badura J, Chelminiak Z, Cuprys M, Fraczek J, Tabecka-Lonczynska A, Koziorowski M
Apoptosis : an international journal on programmed cell death 2019 Oct;24(9-10):773-784
Apoptosis : an international journal on programmed cell death 2019 Oct;24(9-10):773-784
C-reactive protein expression in adipose tissue of children with acute appendicitis.
de Dios O, Gavela-Pérez T, Aguado-Roncero P, Pérez-Tejerizo G, Ricote M, González N, Garcés C, Soriano-Guillén L
Pediatric research 2018 Oct;84(4):564-567
Pediatric research 2018 Oct;84(4):564-567
Immune stimuli shape the small non-coding transcriptome of extracellular vesicles released by dendritic cells.
Driedonks TAP, van der Grein SG, Ariyurek Y, Buermans HPJ, Jekel H, Chow FWN, Wauben MHM, Buck AH, 't Hoen PAC, Nolte-'t Hoen ENM
Cellular and molecular life sciences : CMLS 2018 Oct;75(20):3857-3875
Cellular and molecular life sciences : CMLS 2018 Oct;75(20):3857-3875
Melatonin receptors subtypes (MT1 and MT2) in the uterus masculinus of mature male european bison. Biological and seasonal reproductive role.
Tabecka-Lonczynska A, Mytych J, Solek P, Kulpa-Greszta M, Koziorowski M
Journal of physiology and pharmacology : an official journal of the Polish Physiological Society 2018 Feb;69(1):67-73
Journal of physiology and pharmacology : an official journal of the Polish Physiological Society 2018 Feb;69(1):67-73
Role of TGF-β1/miR-382-5p/SOD2 axis in the induction of oxidative stress in CD34+ cells from primary myelofibrosis.
Rossi C, Zini R, Rontauroli S, Ruberti S, Prudente Z, Barbieri G, Bianchi E, Salati S, Genovese E, Bartalucci N, Guglielmelli P, Tagliafico E, Rosti V, Barosi G, Vannucchi AM, Manfredini R, AGIMM (AIRC-Gruppo Italiano Malattie Mieloproliferative) investigators
Molecular oncology 2018 Dec;12(12):2102-2123
Molecular oncology 2018 Dec;12(12):2102-2123
miR-494-3p overexpression promotes megakaryocytopoiesis in primary myelofibrosis hematopoietic stem/progenitor cells by targeting SOCS6.
Rontauroli S, Norfo R, Pennucci V, Zini R, Ruberti S, Bianchi E, Salati S, Prudente Z, Rossi C, Rosti V, Guglielmelli P, Barosi G, Vannucchi A, Tagliafico E, Manfredini R
Oncotarget 2017 Mar 28;8(13):21380-21397
Oncotarget 2017 Mar 28;8(13):21380-21397
Deregulated expression of miR-29a-3p, miR-494-3p and miR-660-5p affects sensitivity to tyrosine kinase inhibitors in CML leukemic stem cells.
Salati S, Salvestrini V, Carretta C, Genovese E, Rontauroli S, Zini R, Rossi C, Ruberti S, Bianchi E, Barbieri G, Curti A, Castagnetti F, Gugliotta G, Rosti G, Bergamaschi M, Tafuri A, Tagliafico E, Lemoli R, Manfredini R
Oncotarget 2017 Jul 25;8(30):49451-49469
Oncotarget 2017 Jul 25;8(30):49451-49469
Protective role of klotho protein on epithelial cells upon co-culture with activated or senescent monocytes.
Mytych J, Wos I, Solek P, Koziorowski M
Experimental cell research 2017 Jan 15;350(2):358-367
Experimental cell research 2017 Jan 15;350(2):358-367
Role of miR-34a-5p in Hematopoietic Progenitor Cells Proliferation and Fate Decision: Novel Insights into the Pathogenesis of Primary Myelofibrosis.
Bianchi E, Ruberti S, Rontauroli S, Guglielmelli P, Salati S, Rossi C, Zini R, Tagliafico E, Vannucchi AM, Manfredini R
International journal of molecular sciences 2017 Jan 13;18(1)
International journal of molecular sciences 2017 Jan 13;18(1)
EBI2 receptor regulates myelin development and inhibits LPC-induced demyelination.
Rutkowska A, Sailer AW, Dev KK
Journal of neuroinflammation 2017 Dec 16;14(1):250
Journal of neuroinflammation 2017 Dec 16;14(1):250
Long-term culture with lipopolysaccharide induces dose-dependent cytostatic and cytotoxic effects in THP-1 monocytes.
Mytych J, Romerowicz-Misielak M, Koziorowski M
Toxicology in vitro : an international journal published in association with BIBRA 2017 Aug;42:1-9
Toxicology in vitro : an international journal published in association with BIBRA 2017 Aug;42:1-9
Identification of the epigenetic reader CBX2 as a potential drug target in advanced prostate cancer.
Clermont PL, Crea F, Chiang YT, Lin D, Zhang A, Wang JZ, Parolia A, Wu R, Xue H, Wang Y, Ding J, Thu KL, Lam WL, Shah SP, Collins CC, Wang Y, Helgason CD
Clinical epigenetics 2016;8:16
Clinical epigenetics 2016;8:16
MyD88/CD40 Genetic Adjuvant Function in Cutaneous Atypical Antigen-Presenting Cells Contributes to DNA Vaccine Immunogenicity.
Collinson-Pautz MR, Slawin KM, Levitt JM, Spencer DM
PloS one 2016;11(10):e0164547
PloS one 2016;11(10):e0164547
miR-382-5p Controls Hematopoietic Stem Cell Differentiation Through the Downregulation of MXD1.
Zini R, Rossi C, Norfo R, Pennucci V, Barbieri G, Ruberti S, Rontauroli S, Salati S, Bianchi E, Manfredini R
Stem cells and development 2016 Oct 1;25(19):1433-43
Stem cells and development 2016 Oct 1;25(19):1433-43
Dose-dependent autophagic effect of titanium dioxide nanoparticles in human HaCaT cells at non-cytotoxic levels.
Lopes VR, Loitto V, Audinot JN, Bayat N, Gutleb AC, Cristobal S
Journal of nanobiotechnology 2016 Mar 22;14:22
Journal of nanobiotechnology 2016 Mar 22;14:22
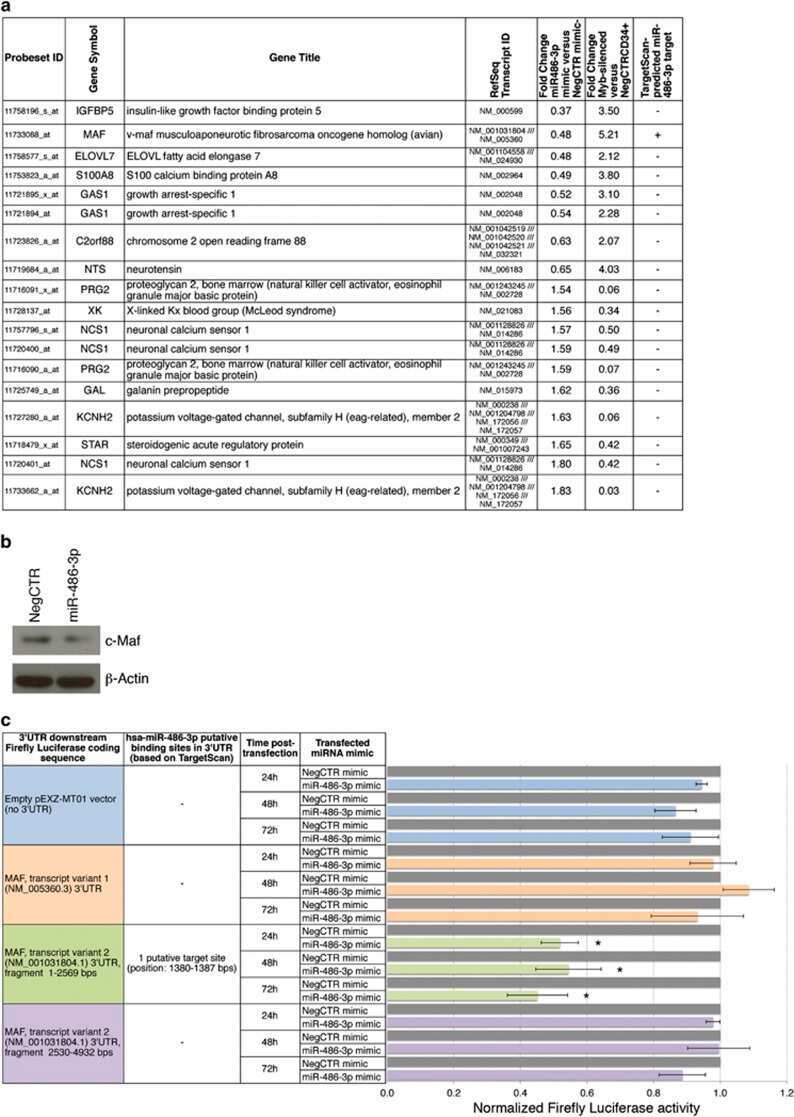
MYB controls erythroid versus megakaryocyte lineage fate decision through the miR-486-3p-mediated downregulation of MAF.
Bianchi E, Bulgarelli J, Ruberti S, Rontauroli S, Sacchi G, Norfo R, Pennucci V, Zini R, Salati S, Prudente Z, Ferrari S, Manfredini R
Cell death and differentiation 2015 Dec;22(12):1906-21
Cell death and differentiation 2015 Dec;22(12):1906-21
Evaluation of PAX5 gene in the early stages of leukemic B cells in the childhood B cell acute lymphoblastic leukemia.
Firtina S, Sayitoglu M, Hatirnaz O, Erbilgin Y, Oztunc C, Cinar S, Yildiz I, Celkan T, Anak S, Unuvar A, Devecioglu O, Timur C, Aydogan G, Akcay A, Atay D, Turkkan E, Karaman S, Orhaner B, Sarper N, Deniz G, Ozbek U
Leukemia research 2012 Jan;36(1):87-92
Leukemia research 2012 Jan;36(1):87-92
DGAT enzymes are required for triacylglycerol synthesis and lipid droplets in adipocytes.
Harris CA, Haas JT, Streeper RS, Stone SJ, Kumari M, Yang K, Han X, Brownell N, Gross RW, Zechner R, Farese RV Jr
Journal of lipid research 2011 Apr;52(4):657-67
Journal of lipid research 2011 Apr;52(4):657-67
The lysine demethylase LSD1 (KDM1) is required for maintenance of global DNA methylation.
Wang J, Hevi S, Kurash JK, Lei H, Gay F, Bajko J, Su H, Sun W, Chang H, Xu G, Gaudet F, Li E, Chen T
Nature genetics 2009 Jan;41(1):125-9
Nature genetics 2009 Jan;41(1):125-9
No comments: Submit comment
Supportive validation
- Submitted by
- Invitrogen Antibodies (provider)
- Main image

- Experimental details
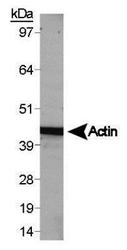
- Western blot analysis of Actin (Product # PA1-16889) using HepG2 whole cell lysate.

- Submitted by
- Invitrogen Antibodies (provider)
- Main image

- Experimental details
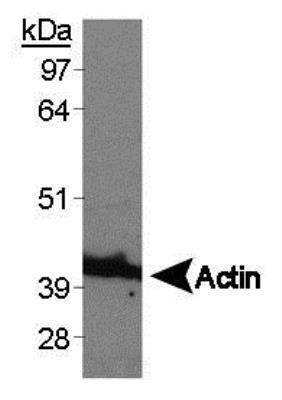
- Western blot analysis of Actin (Product # PA1-16889) using RCC4 whole cell lysate.

- Submitted by
- Invitrogen Antibodies (provider)
- Main image

- Experimental details
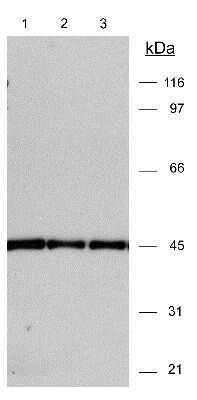
- Western Blot detection of actin in 3T3 (20 µg) lysates ECL Western Blot detection 30 seconds. Lane 1 - 1:15,000 dilution Lane 2 - 1:10,000 dilution Lane 3 - 1:15,000 dilution

- Submitted by
- Invitrogen Antibodies (provider)
- Main image

- Experimental details
- Western blot analysis of beta Actin in 20 µg 3T3 lysates. Samples were incubated in beta Actin polyclonal antibody (Product # PA1-16889). ECL detection 30 seconds. A specific band is seen using different dilutions: Lane 1: (1:15,000); Lane 2: (1:10,000); Lane 3: (1:15,000).
- Submitted by
- Invitrogen Antibodies (provider)
- Main image

- Experimental details
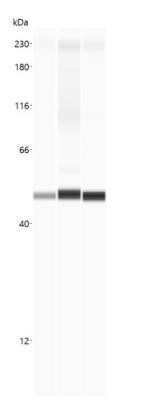
- Western blot analysis of beta Actin in A431, C2C12 and C6 cell lysates. Samples were incubated in beta Actin polyclonal antibody (Product # PA1-16889) using a dilution of 1:200. This experiment was performed under reducing conditions using the 12-230 kDa separation system.
- Submitted by
- Invitrogen Antibodies (provider)
- Main image

- Experimental details
- Western blot analysis was performed on whole cell extracts (30 µg lysate) of A-431 (Lane 1), A549 (Lane 2), COS-7 (Lane 3), MDCK (Lane 4), NIH/3T3 (Lane 5), HT-29 (Lane 6), PC-12 (Lane 7), Neuro-2a (Lane 8), tissue extracts of Mouse Brain (Lane 9) and Mouse Heart (Lane 10). The blot was probed with beta Actin Polyclonal Antibody (Product # PA1-16889, 1:5000 dilution) and detected by chemiluminescence using Goat anti-Rabbit IgG (H+L) Superclonal™ Secondary Antibody, HRP conjugate (Product # A27036, 0.25 µg/mL, 1:4000 dilution). A 42 kDa band corresponding to beta Actin was observed across the cell lines and tissues tested.

- Submitted by
- Invitrogen Antibodies (provider)
- Main image
- Experimental details
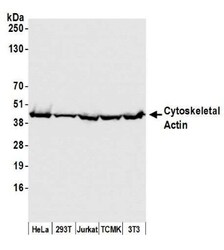
- Western blot analysis of beta Actin in 50 µg whole cell lysate from HeLa, HEK293T, Jurkat, mouse TCMK-1, and mouse NIH 3T3 cells. Samples were incubated in beta Actin polyclonal antibody (Product # PA1-16889 using a dilution of 0.1 µg/mL. Detection: Chemiluminescence with an exposure time of 1 second.

- Submitted by
- Invitrogen Antibodies (provider)
- Main image

- Experimental details
- Western blot analysis of beta Actin in 20 µg 3T3 lysates. Samples were incubated in beta Actin polyclonal antibody (Product # PA1-16889). ECL detection 30 seconds. A specific band is seen using different dilutions: Lane 1: (1:15,000); Lane 2: (1:10,000); Lane 3: (1:15,000).

- Submitted by
- Invitrogen Antibodies (provider)
- Main image
- Experimental details
- Western blot analysis of beta Actin in HepG2 whole cell lysate. Sample was incubated in beta Actin polyclonal antibody (Product # PA1-16889).

- Submitted by
- Invitrogen Antibodies (provider)
- Main image

- Experimental details
- Western blot analysis of beta Actin in RCC4 whole cell lysate. Sample was incubated in beta Actin polyclonal antibody (Product # PA1-16889).
- Submitted by
- Invitrogen Antibodies (provider)
- Main image

- Experimental details
- Western blot analysis of beta Actin in A431, C2C12 and C6 cell lysates. Samples were incubated in beta Actin polyclonal antibody (Product # PA1-16889) using a dilution of 1:200. This experiment was performed under reducing conditions using the 12-230 kDa separation system.

Supportive validation
- Submitted by
- Invitrogen Antibodies (provider)
- Main image
- Experimental details
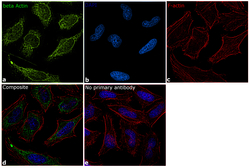
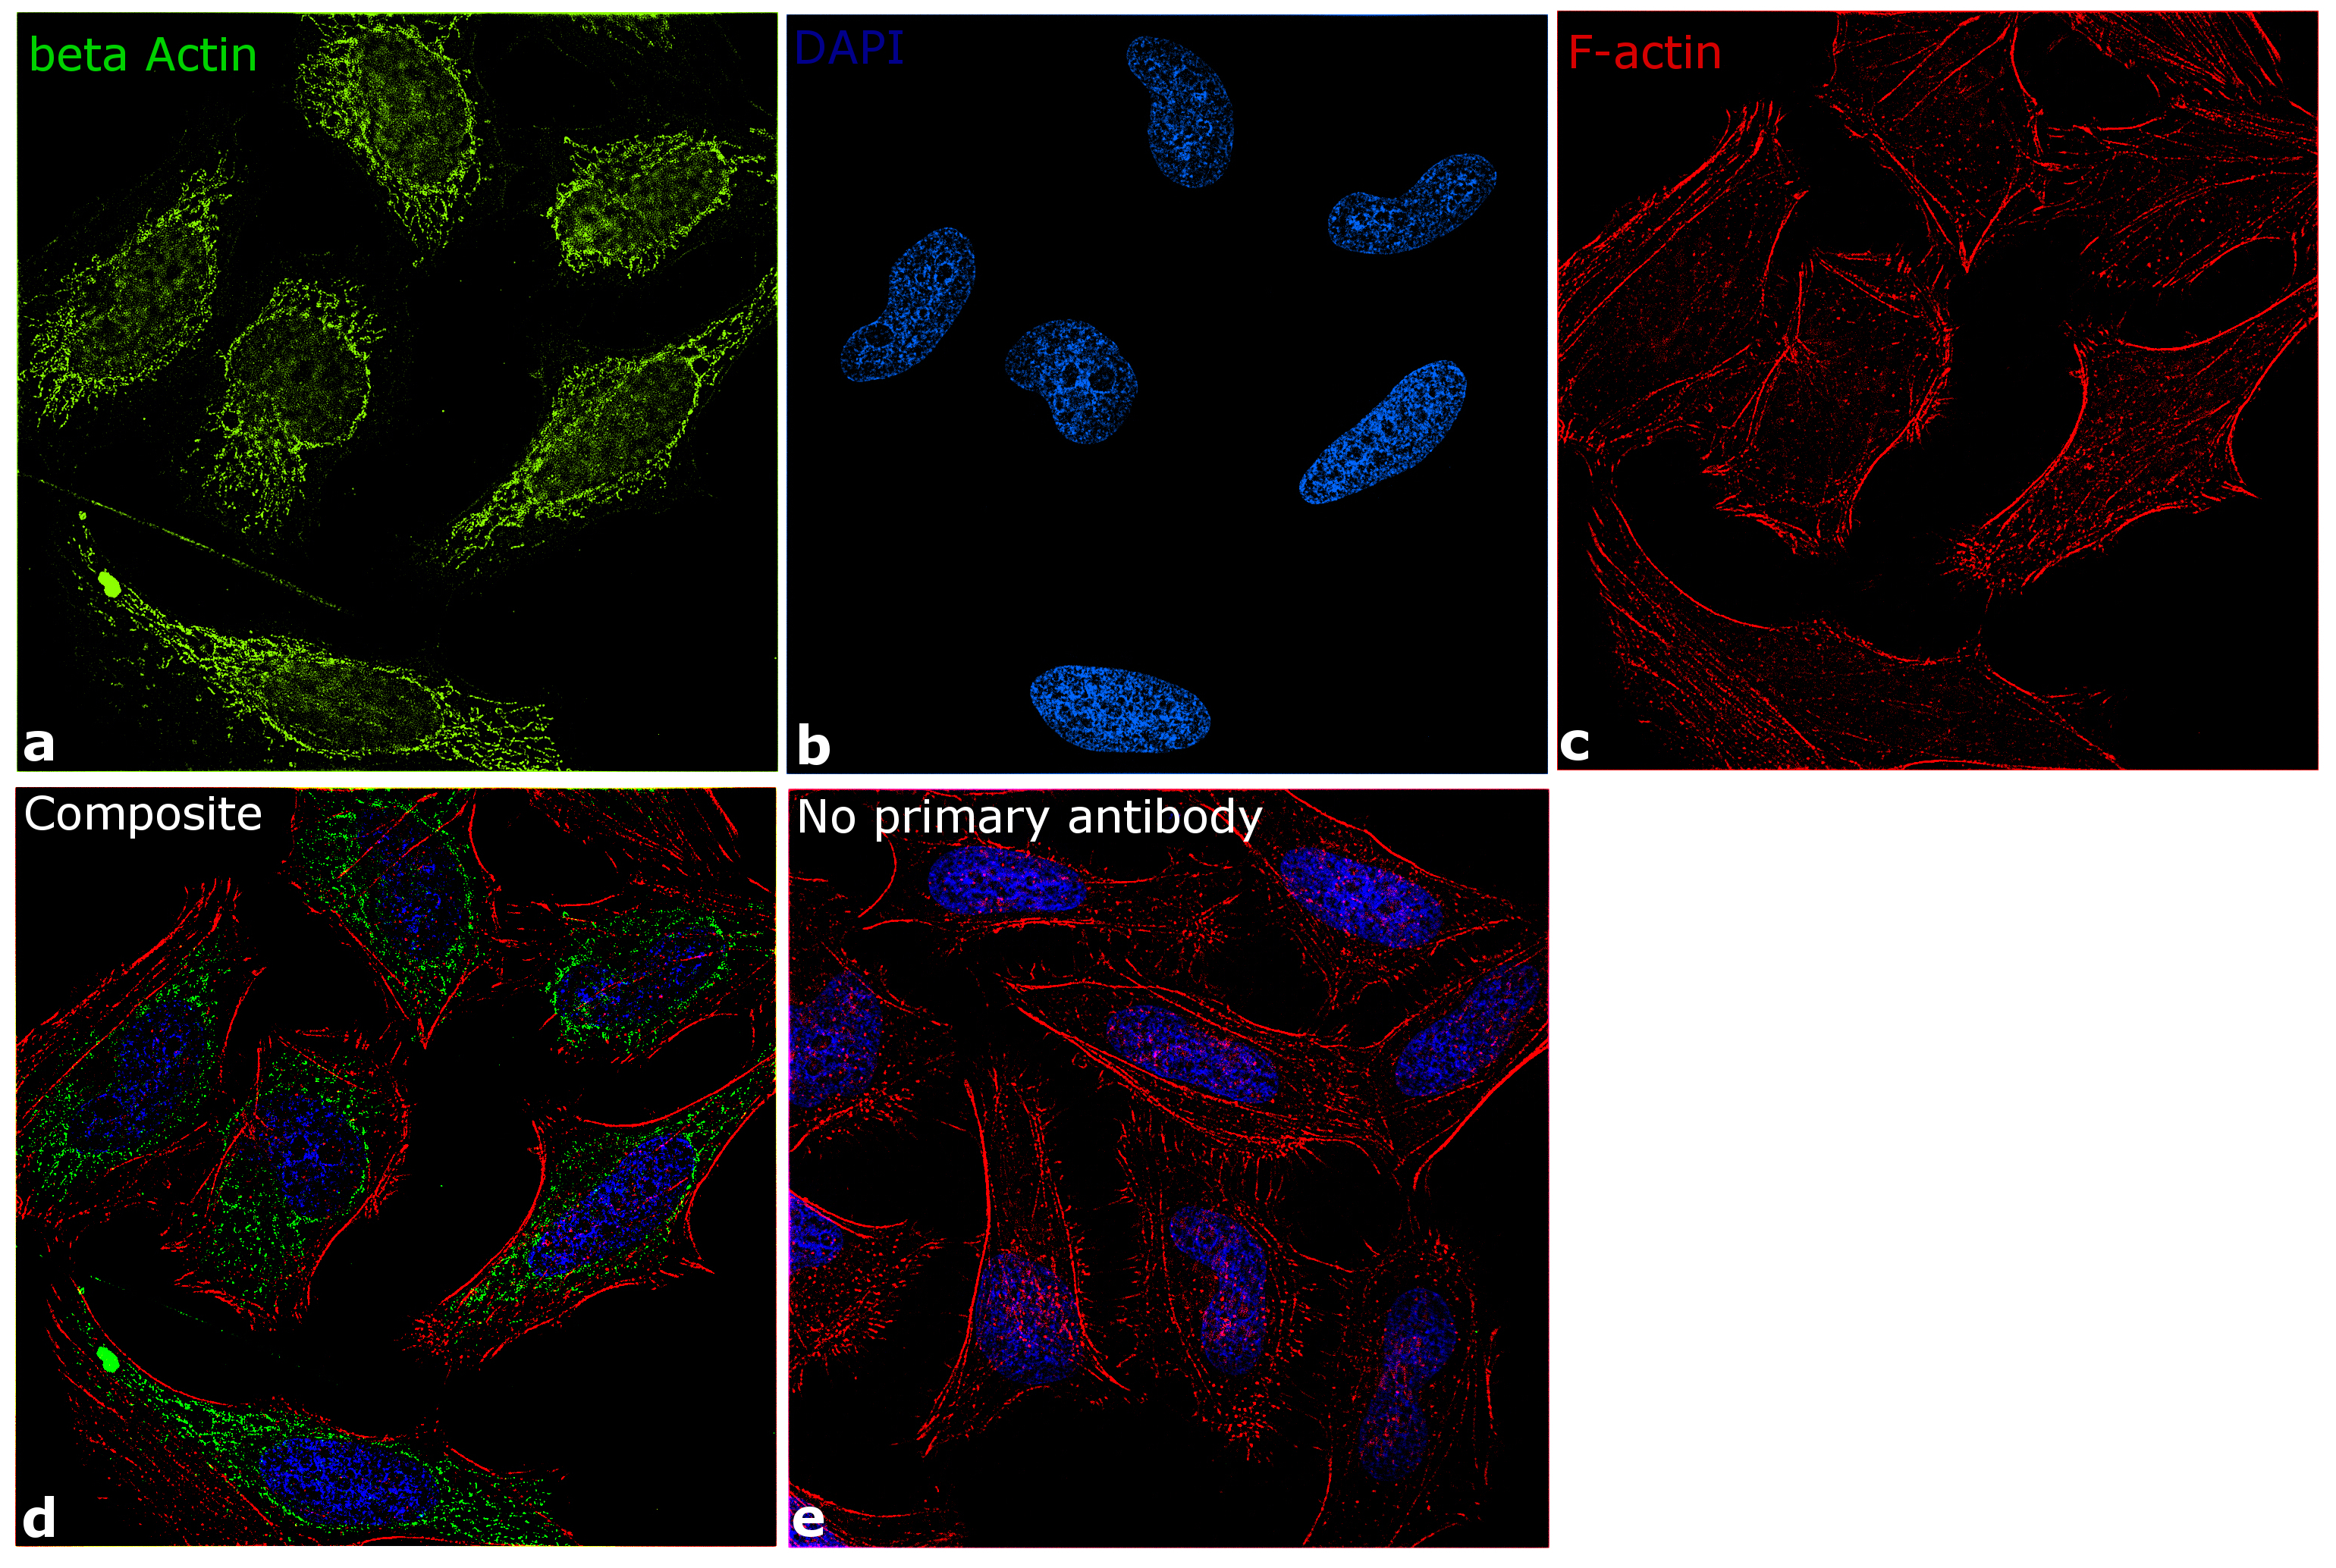
- Immunofluorescence analysis of beta Actin was performed using 70% confluent log phase HeLa cells. The cells were fixed with 4% paraformaldehyde for 10 minutes, permeabilized with 0.1% Triton™ X-100 for 10 minutes, and blocked with 1% BSA for 1 hour at room temperature. The cells were labeled with beta Actin Polyclonal Antibody (Product # PA1-16889) at 5 µg/mL in 0.1% BSA and incubated overnight at 4 degree and then labeled with Goat anti-Rabbit IgG (H+L) Superclonal™ Secondary Antibody, Alexa Fluor® 488 conjugate (Product # A27034) at a dilution of 1:2000 for 45 minutes at room temperature (Panel a: green). Nuclei (Panel b: blue) were stained with SlowFade® Gold Antifade Mountant with DAPI (Product # S36938). F-actin (Panel c: red) was stained with Rhodamine Phalloidin (Product # R415, 1:300). Panel d represents the merged image showing cytoskeletal localization. Panel e represents control cells with no primary antibody to assess background. The images were captured at 60X magnification.
Supportive validation
- Submitted by
- Invitrogen Antibodies (provider)
- Main image
- Experimental details
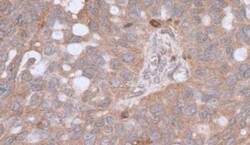
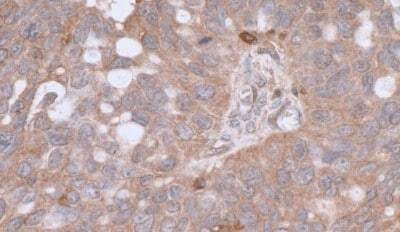
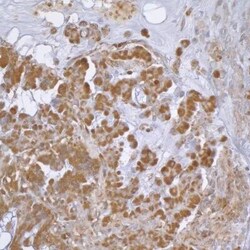
- Immunohistochemical analysis of beta Actin in formalin-fixed paraffin-embedded section of human ovarian cancer. Samples were incubated in beta Actin polyclonal antibody (Product # PA1-16889). Detection: DAB.
- Submitted by
- Invitrogen Antibodies (provider)
- Main image
- Experimental details
- Immunohistochemical analysis of beta Actin in formalin-fixed paraffin-embedded section of human lung carcinoma. Samples were incubated in beta Actin polyclonal antibody (Product # PA1-16889) using a dilution of 1:1,000. Detection: DAB.

Supportive validation
- Submitted by
- Invitrogen Antibodies (provider)
- Main image

- Experimental details
- NULL
- Submitted by
- Invitrogen Antibodies (provider)
- Main image

- Experimental details
- NULL
- Submitted by
- Invitrogen Antibodies (provider)
- Main image
- Experimental details
- NULL

- Submitted by
- Invitrogen Antibodies (provider)
- Main image
- Experimental details
- NULL
- Submitted by
- Invitrogen Antibodies (provider)
- Main image
- Experimental details
- NULL
- Submitted by
- Invitrogen Antibodies (provider)
- Main image
- Experimental details
- NULL
- Submitted by
- Invitrogen Antibodies (provider)
- Main image
- Experimental details
- NULL
- Submitted by
- Invitrogen Antibodies (provider)
- Main image
- Experimental details
- NULL
- Submitted by
- Invitrogen Antibodies (provider)
- Main image

- Experimental details
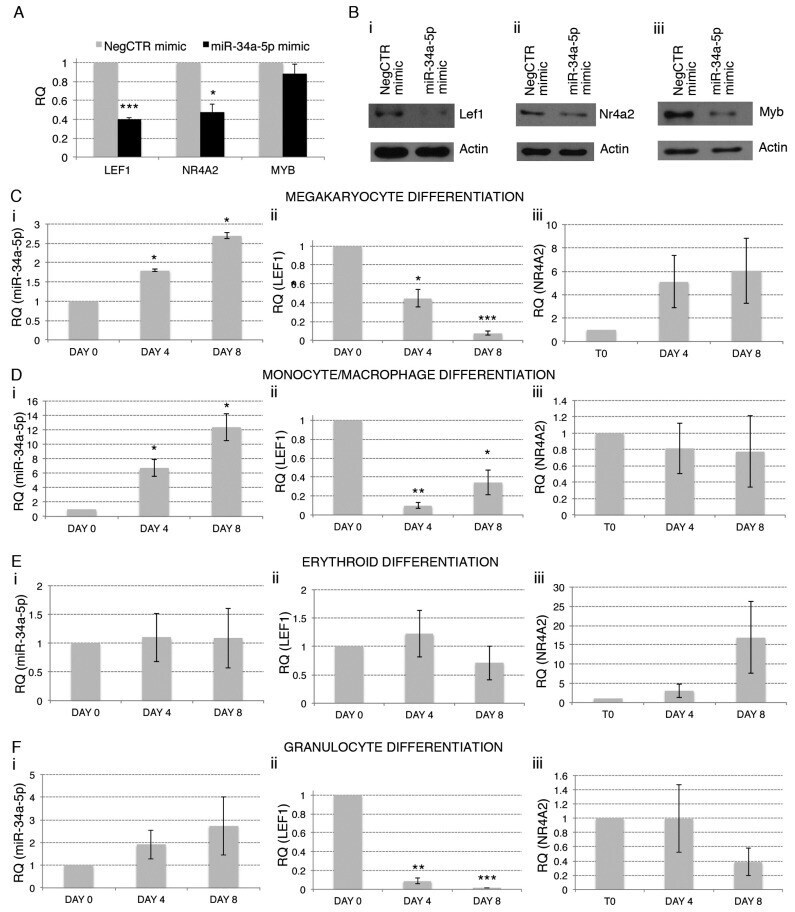
- Figure 4 Relationship between the expression of miR-34a-5p and that of the miR-34a-5p targets during the HPCs commitment. ( A ) Detection of lymphoid enhancer-binding factor 1 ( LEF1 ), nuclear receptor subfamily 4, group A, member 2 ( NR4A2 ) and MYB expression levels by Reverse Transcription Quantitative Polymerase Chain Reaction (RT-qPCR) in Negative Control (NegCTR) mimic and miR-34a-5p mimic-transfected CD34+ cells at 24 h post-nucleofection; ( B ) Western Blotting analysis of Lef1 ( i ), Nr4a2 ( ii ) and Myb ( iii ) protein levels in protein lysates from miR-34a-5p mimic-transfected compared to NegCTR mimic-transfected CD34+ cells at 24 h after the last of two nucleofection cycles. Actin protein levels are reported as loading control; ( C - F ) Expression kinetics of miR34a ( i ), LEF1 ( ii ) and NR4A2 ( iii ) during the megakaryocyte ( C ); monocyte/macrophage ( D ); erythroid ( E ) and granulocyte ( F ) differentiation of CD34+ cells. miR-34a-5p, LEF1 and NR4A2 expression levels were monitored by RT-qPCR at day 4 and day 8 post-CD34+ cells purification. Modulations of miR-34a-5p, LEF1 and NR4A2 transcripts are reported as Relative Quantity (RQ) respect to freshly purified CD34+ cells (DAY 0) sample, which was set as calibrator. Data are from n = 3 independent experiments performed with different healthy donor-derived cord blood units. Values in the graph are reported as mean +- SEM. * p
- Submitted by
- Invitrogen Antibodies (provider)
- Main image
- Experimental details
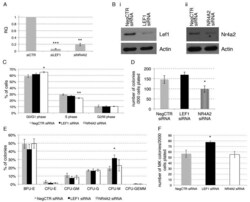
- Figure 5 Effects of LEF1 and NR4A2 silencing on CD34+ hematopoietic progenitor cells proliferation and clonogenic activity. ( A ) Detection of LEF1 and NR4A2 expression levels by RT-qPCR in NegCTR siRNA, LEF1 siRNA and NR4A2 siRNA-transfected CD34+ cells at 24 h post-nucleofection; ( B ) Western Blotting analysis of Lef1 ( i ) and Nr4a2 ( ii ) protein levels in LEF1 siRNA ( i ) or NR4A2 siRNA ( ii ) compared to NegCTR siRNA-transfected CD34+ cells at 24 h after the last of two nucleofection cycles. Actin protein levels are reported as loading control; ( C ) Statistical analysis results (mean +- SEM; n = 3) for the percentage of cells in the different cell cycle phases performed by propidium iodide staining 24 h post-nucleofection; ( D , E ) Methylcellulose clonogenic assay results (mean +- SEM; n = 3). The colony scoring results are reported as total number of colonies grown from 200 cells plated ( D ) and percentages of each colony type ( E ); Colonies were scored according to the manufacturer's guidelines; ( F , G ) Megakaryocyte clonogenic assay results (mean +- SEM; n = 3) in terms of megakaryocyte colony number ( F ) and size ( G ). Values are reported as number of megakaryocyte colonies for 2000 plated cells. Error bars in the graphs represent SEM. * p

- Submitted by
- Invitrogen Antibodies (provider)
- Main image
- Experimental details
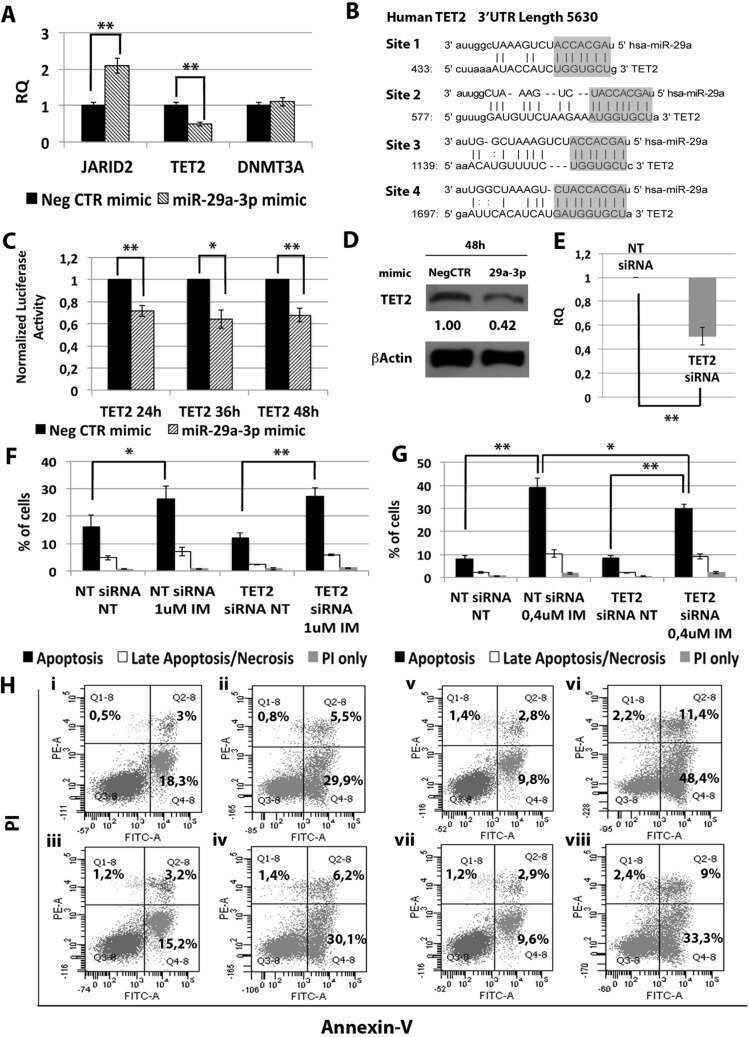
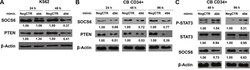
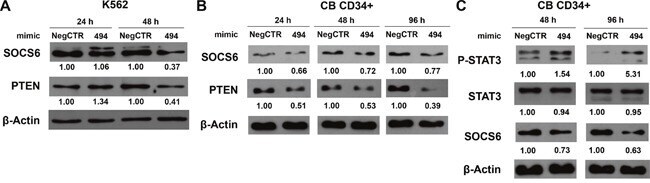
- Figure 6 miR-494-3p overexpression reduces SOCS6 expression and enhances STAT3 phosphorilation A-B. Western blot analysis of SOCS6 protein levels in whole cell lysates from K562 (A) and CB CD34+ (B) cells overexpressing miR-494-3p at different time-points after mimic nucleofection. SOCS6 protein levels in miR-494-3p overexpressing cells were compared with control samples nucleofected with mimic Negative Control (Neg CTR). beta-actin was included as loading control while PTEN was selected as positive control. C. Immunoblots representing phospho-STAT3 increase in CB CD34+ cells overexpressing miR-494-3p compared with negative control (Neg CTR) 48 and 96 hours after nucleofection. beta-actin was included as loading control.
- Submitted by
- Invitrogen Antibodies (provider)
- Main image
- Experimental details
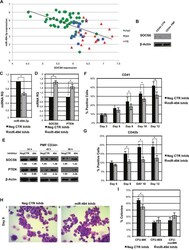
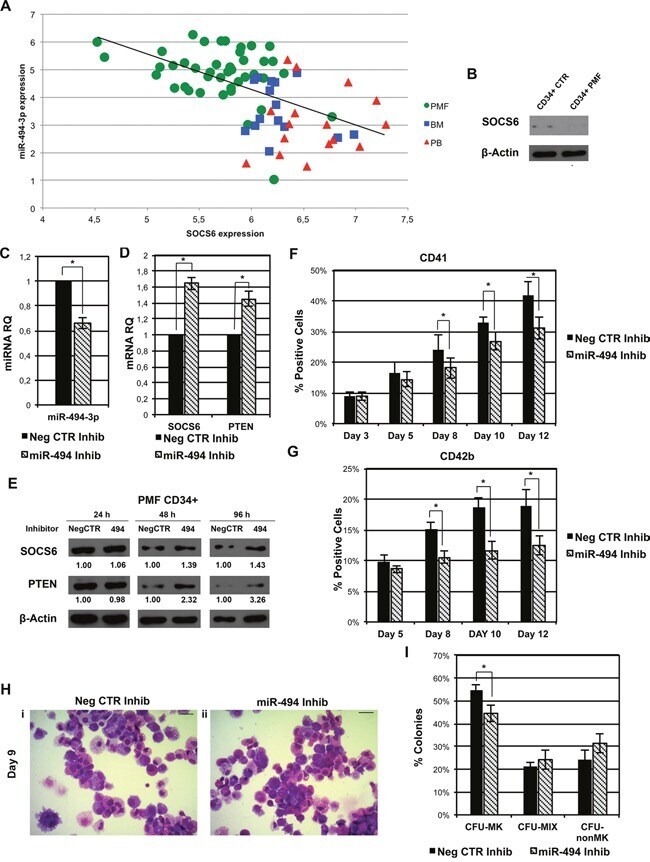
- Figure 8 miR-494-3p inhibition impairs MK differentiation of PMF CD34+ cells A. Scatter plot representing the correlation between miR-494-3p and SOCS6 expression levels according to the microarray analysis in our initial dataset of 42 PMF samples and 31 healthy donors. The Spearman rank correlation coefficient (r) was used to measure and identify the degree of linear dependence between the ranked variables (r = -0.57, p = 1.12 x 10 -7 ). Green circles = PMF CD34+ cells, Red triangles = PB CD34+ cells, Blue squares = BM CD34+ cells. Abbreviations: PMF, primary myelofibrosis; PB, peripheral blood; BM, bone marrow; CTR, control. B. Western blot analysis of SOCS6 protein levels in PMF CD34+ cells compared to CB CD34+ cells. beta-actin was included as loading control. C-D. Expression levels of miR-494-3p, SOCS6, and PTEN in PMF CD34+ cells after miRNA inhibition evaluated by means of qRT-PCR. Data are reported as RQ mean +- S.E.M (n=3). E. Immunoblots representing SOCS6 protein levels in whole cell lysates from PMF CD34+ cells after miR-494-3p inhibition. SOCS6 protein levels were evaluated 24, 48 and 96 hours after miR-494-3p inhibitors nucleofection and were compared with control samples electroporated with Negative Control inhibitors (NegCTR). beta-actin was included as loading control while PTEN was selected as positive control. F-G. Results of flow cytometry analysis of the percentages of CD41+ (F) and CD42b+ (G) cells evaluated at days 3, 5, 8, 10 and 12 in serum-free MK uni
- Submitted by
- Invitrogen Antibodies (provider)
- Main image
- Experimental details
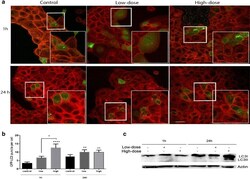
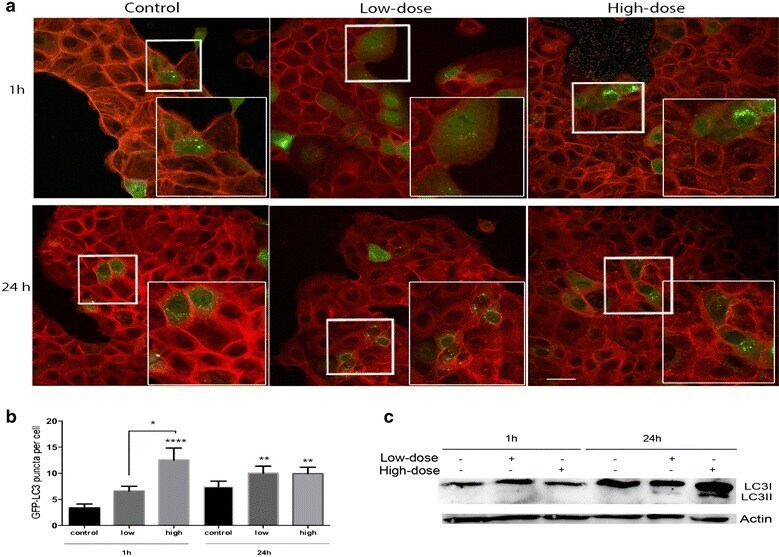
- Fig. 6 TiO 2 -NPs trigger autophagic response in HaCaT cells by forming autophagosomes and increasing LC3 translocation. Representative images of GFP-LC3 puncta. a Evaluation of LC3 puncta on transiently transfected eGFP-LC3-HaCaT cells treated with TiO 2 -NPs by confocal microscopy. The green color represents the GFP-LC3 puncta and the red color represents the cytoskeleton. Control cells were transfected with eGFP-LC3 plasmid and grown only in DMEM complete cell media and later cells were treated with 0.16 ug/mL (low-dose) and 25.0 ug/mL (high-dose) TiO 2 -NPs for 1 and 24 h before fixation. b Quantification of GFP-LC3 dots per cell ( green dots ). Up to twenty cells were analyzed. c Representative western blots probed with anti-LC3B antibody (Novus) from cells treated for 1 and 24 h; cells without treatment were used as a control. Data obtained was analyzed for the conversation of LC3I (cytoplasmatic) to LC3II (membrane-bound) by western blotting using an LC3B antibody. Actin was used as a loading control. Values represent mean +- SD. * P < 0.05, ** P < 0.01 and **** P < 0.0001. Scale bar ( bottom-left ) represents 20 um
- Submitted by
- Invitrogen Antibodies (provider)
- Main image
- Experimental details
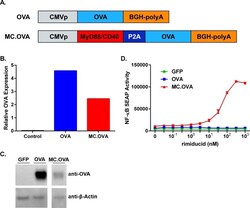
- Fig 1 Design and Function of OVA and MC.OVA Vaccine Vectors. (A) Linear diagrams showing the functional features of the OVA (upper) and MC.OVA (lower) vaccine constructs. (B, C) 293 cells were transfected with 1 mug of the indicated plasmid. Lysates were probed for OVA expression by Western blot and expression was measured relative to beta-actin. (D) 293 cells transfected with NF-kappaB SEAP reporter and either GFP, OVA, or MC.OVA expression plasmids. Cells were plated with increasing concentrations of rim.

- Submitted by
- Invitrogen Antibodies (provider)
- Main image
- Experimental details
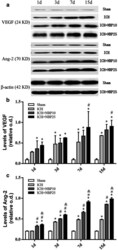
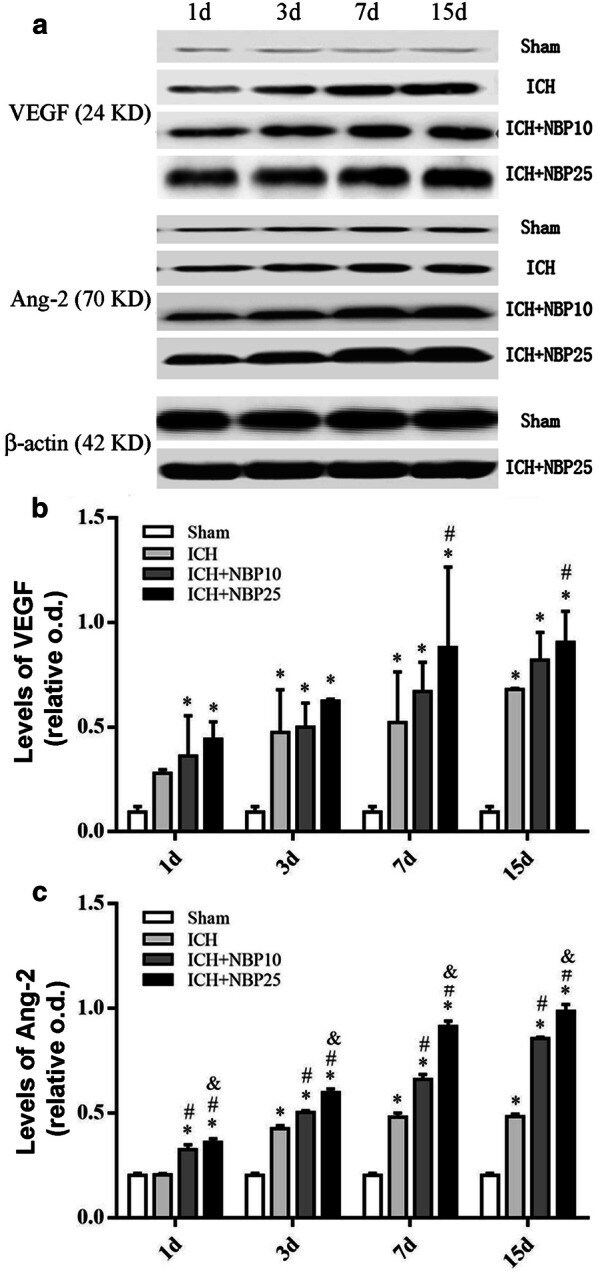
- Fig. 5 Effect of NBP treatment on the expression of the vascular endothelial growth factor (VEGF) and angiopoietins-2 (Ang-2) proteins in tissue lysates of the injection site in a rat model of ICH. Panel ( a ) shows representative immunoblot images (upper two sets) of VEGF and Ang-2 in the groups as indicated, with representative images (bottom set) showing equal protein loading as blotted with the beta-actin antibody. Panels ( b , c ) plot the protein levels expressed as relative optic densities (o.d.) normalized to the internal control beta-actin. Results from two-way ANOVA followed by Bonferroni's post hoc tests are marked with symbols, with * indicating significantly different comparing to the Sham groups; # indicating significantly different comparing to the ICH groups; and & indicating significantly different comparing to the ICH + NBP10 groups
- Submitted by
- Invitrogen Antibodies (provider)
- Main image
- Experimental details
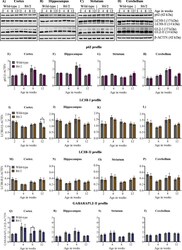
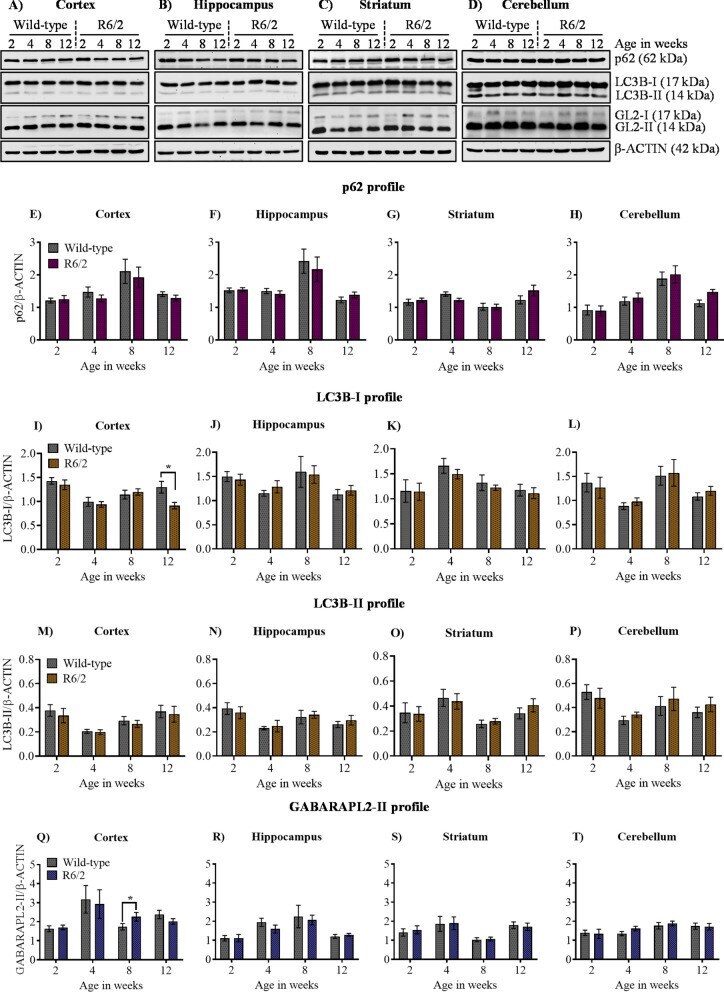
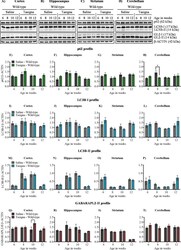
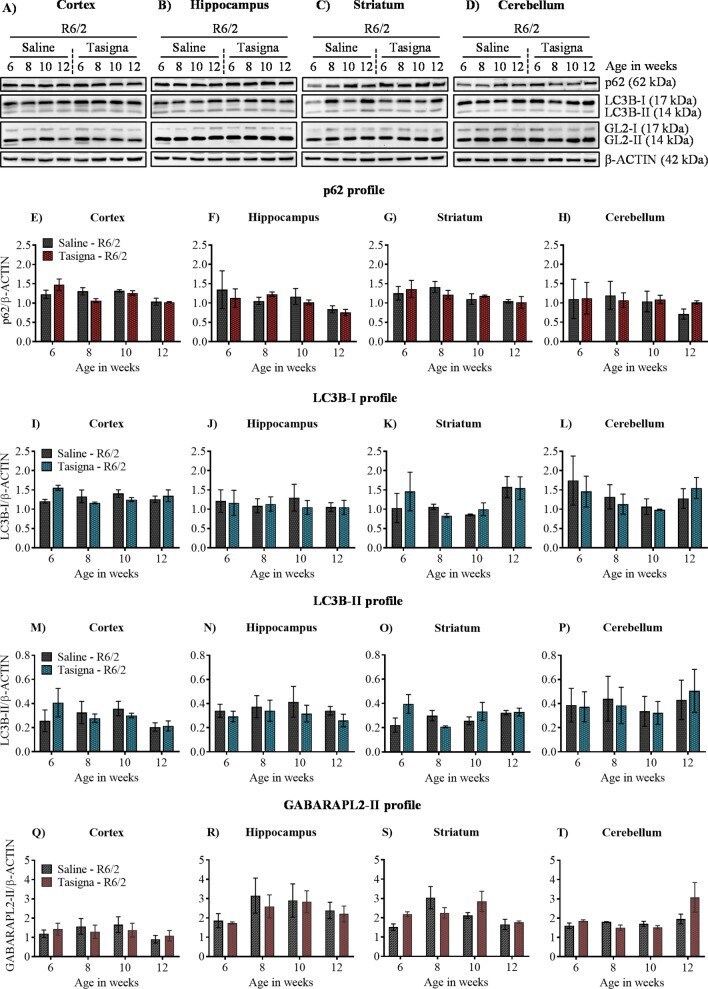
- Figure 2 Basal autophagy is not altered across different stages of disease progression in R6/2. ( A )-( D ) Representative immunoblot for the expression of ATG proteins p62/SQSTM1, LC3B, GABARAPL2 (GL2) from 2, 4, 8, and 12 weeks in cortex, hippocampus, striatum and cerebellum, respectively. beta-ACTIN is used as a loading control. ( E )-( H ) Pooled quantified bar graphs for p62 for cortex: Age x Genotype (F (3,54) = 0.1322, p = 0.94), hippocampus: Age x Genotype (F (3,54) = 0.4656, p = 0.70), striatum: Age x Genotype (F (3,54) = 1.394, p = 0.25), and cerebellum: Age x Genotype (F (3,54) = 0.6080, p = 0.61) respectively. ( I )-( L ) Pooled quantified bar graphs for LC3B-I for cortex: Age x Genotype (F (3,54) = 2.380, p = 0.07); (12 weeks: *p < 0.05), hippocampus: Age x Genotype (F (3,54) = 0.1890, p = 0.90), striatum: Age x Genotype (F (3,54) = 0.09385, p = 0.96), and cerebellum: Age x Genotype (F (3,54) = 0.1832, p = 0.90) respectively. ( M )-( P ) Quantified bar graphs for LC3B-II for cortex: Age x Genotype (F (3,54) = 0.03193, p = 0.99), hippocampus: Age x Genotype (F (3,54) = 0.2341, p = 0.87), striatum: Age x Genotype (F (3,54) = 0.3311, p = 0.80), and cerebellum: Age x Genotype (F (3,54) = 0.2769, p = 0.84) respectively. ( Q )-( T ) Summary of quantified bar graphs for GABARAPL2-II (GL2) for cortex: Age x Genotype (F (3,54) = 0.5814, p = 0.62), hippocampus: Age x Genotype (F (3,54) = 0.3486, p = 0.79), striatum: Age x Genotype (F (3,54) = 0.07321, p = 0.97), and cerebe
- Submitted by
- Invitrogen Antibodies (provider)
- Main image
- Experimental details
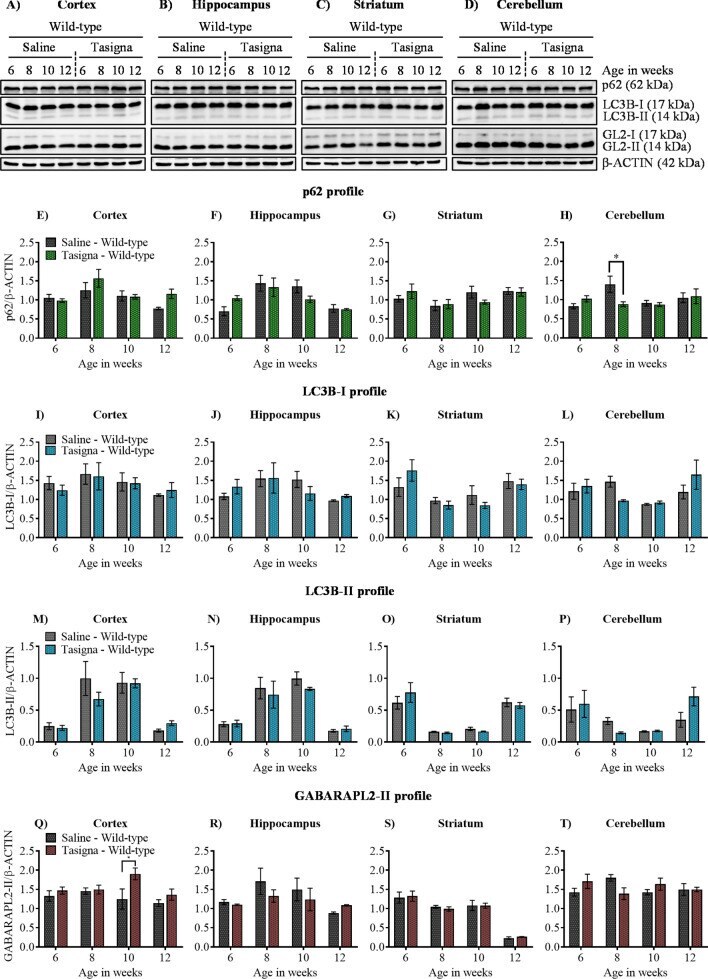
- Figure 5 Nilotinib (Tasigna(tm)) does not affect inducing autophagy in wild-type control mice. ( A )-( D ) Representative immunoblot for the expression of ATG proteins p62/SQSTM1, LC3B, GABARAPL2 (GL2) from 6, 8, 10 and 12 weeks in cortex, hippocampus, striatum and cerebellum, respectively. beta-ACTIN is used as a loading control. ( E )-( H ) Pooled quantified bar graphs for p62/SQSTM1 for cortex: Age x treatment (F (3,12) = 2.32, p = 0.12), hippocampus: Age x treatment (F (3,12) = 1.87, p = 0.18), striatum: Age x treatment (F (3,12) = 0.99, p = 0.42), and cerebellum: Age x treatment (F (3,12) = 5.40, p = 0.01); (8 weeks: *p < 0.01) respectively. ( I )-( L ) Pooled quantified bar graphs for LC3B-I for cortex: Age x treatment (F (3,12) = 0.59, p = 0.63), hippocampus: Age x treatment (F (3,12) = 1.72, p = 0.21), striatum: Age x treatment (F (3,12) = 1.13, p = 0.37), and cerebellum: Age x treatment (F (3,12) = 3.06, p = 0.06) respectively. ( M )-( P ) Pooled quantified bar graphs for LC3B-II for cortex: Age x treatment (F (3,12) = 1.65, p = 0.22), hippocampus: Age x treatment (F (3,12) = 0.57, p = 0.64), striatum: Age x treatment (F (3,12) = 1.22, p = 0.34), and cerebellum: Age x treatment (F (3,12) = 2.22, p = 0.13) respectively. ( Q )-( T ) Pooled quantified bar graphs for GABARAPL2-II (GL2) for cortex: Age x treatment (F (3,12) = 1.86, p = 0.18); (10 weeks: *p < 0.05), hippocampus: Age x treatment (F (3,12) = 1.01, p = 0.42), striatum: Age x treatment (F (3,12) = 0.08, p = 0.
- Submitted by
- Invitrogen Antibodies (provider)
- Main image
- Experimental details
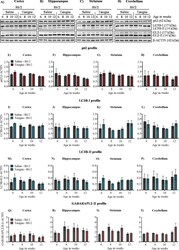
- Figure 6 Nilotinib (Tasigna(tm)) is ineffective in inducing autophagy across different stages of disease progression in R6/2. ( A )-( D ) Representative immunoblot for the expression of ATG proteins p62/SQSTM1, LC3B, GABARAPL2 (GL2) in cortex, hippocampus, striatum and cerebellum respectively from 6, 8, 10 and 12 weeks. beta-ACTIN is used as a loading control. ( E )-( H ) Pooled quantified bar graphs for p62/SQSTM1 for cortex: Age x treatment (F (3,12) = 2.29, p = 0.12), hippocampus: Age x treatment (F (3,12) = 0.28, p = 0.83), striatum: Age x treatment (F (3,12) = 0.39, p = 0.76), and cerebellum: Age x treatment (F (3,12) = 0.27, p = 0.84) respectively. ( I )-( L ) Pooled quantified bar graphs for LC3B-I for cortex: Age x treatment (F (3,12) = 3.27, p = 0.05), hippocampus: Age x treatment (F (3,12) = 0.27, p = 0.84), striatum: Age x treatment (F (3,12) = 0.85, p = 0.49), and cerebellum: Age x treatment (F (3,12) = 0.55, p = 0.65) respectively. ( M )-( P ) Summary of quantified bar graphs for LC3B-II for cortex: Age x treatment (F (3,12) = 0.91, p = 0.46), hippocampus: Age x treatment (F (3,12) = 0.13, p = 0.93), striatum: Age x treatment (F (3,12) = 4.68, p = 0.02), and cerebellum: Age x treatment (F (3,12) = 0.43, p = 0.73) respectively. ( Q )-( T ) Pooled quantified bar graphs for GABARAPL2-II (GL2) for cortex: Age x treatment (F (3,12) = 3.30, p = 0.05), hippocampus: Age x treatment (F (3,12) = 0.20, p = 0.88), striatum: Age x treatment (F (3,12) = 3.09, p = 0.06), and ce
- Submitted by
- Invitrogen Antibodies (provider)
- Main image
- Experimental details
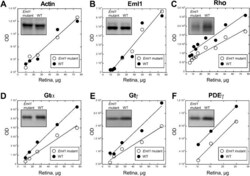
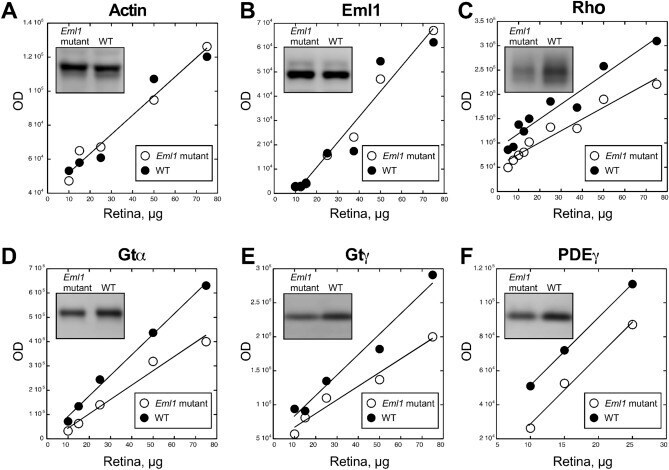
- Figure 6 Western blot analysis of Eml1 mutant retinas. Graphs showing optical density of Western blot bands against amount of total retina protein, n = 3. Eml1 mutant retinas (empty circles) as compared to the wild type retinas (filled circles). Linearity of plots demonstrates sub-saturating ECL signal ensuring direct quantitative comparison. ( A ) Actin, ( B ) EML1, ( C ) Rhodopsin, Rh, ( D ) transducin alpha, Gtalpha, ( E ) transducin gamma, Gtgamma, and ( F ) phosphodiesterase gamma (PDEgamma). Representative staining for each protein is shown in insets (for complete blot pictures see supplementary Fig. 4 ).
- Submitted by
- Invitrogen Antibodies (provider)
- Main image

- Experimental details
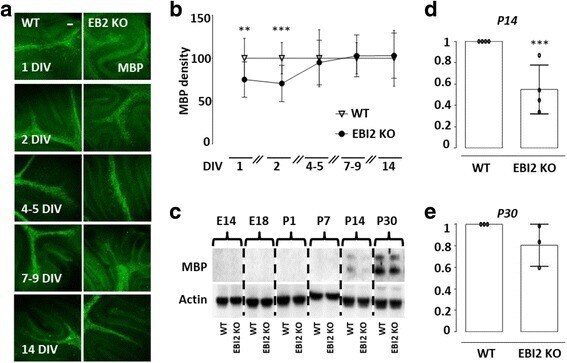
- Fig. 2 EBI2 deficiency results in transient delay in MBP expression. a Representative confocal images show mice cerebellar slices prepared from P10 mice and cultured for 1, 2, 4 to 5, 7 to 9, and 14 DIV. Myelin (MBP, green) staining is shown. Myelin development was determined by quantification of MBP staining density. Analysis showed significant differences in myelin development between one to two DIV. Images taken at x10 magnification. Scale bar, 100 muM. b Graph showing quantification of MBP immunofluorescence in images such as those shown in ( a ). Data presented as mean +- SD (five to six animals per group), unpaired t test, ** p < 0.01, *** p < 0.001 versus corresponding control. c Representative WBs show differential expression of MBP in whole brain lysates prepared from embryonic (E14 and E18) and postnatal (P1, P7, P14, and P30) WT and EBI2 KO mice. d, e Densitometric quantification of blots such as that shown in ( c ). Normalized WB data presented as mean +- SD (three to four WB data per time point; one animal per blot), unpaired t test, *** p < 0.001 versus corresponding control
- Submitted by
- Invitrogen Antibodies (provider)
- Main image

- Experimental details
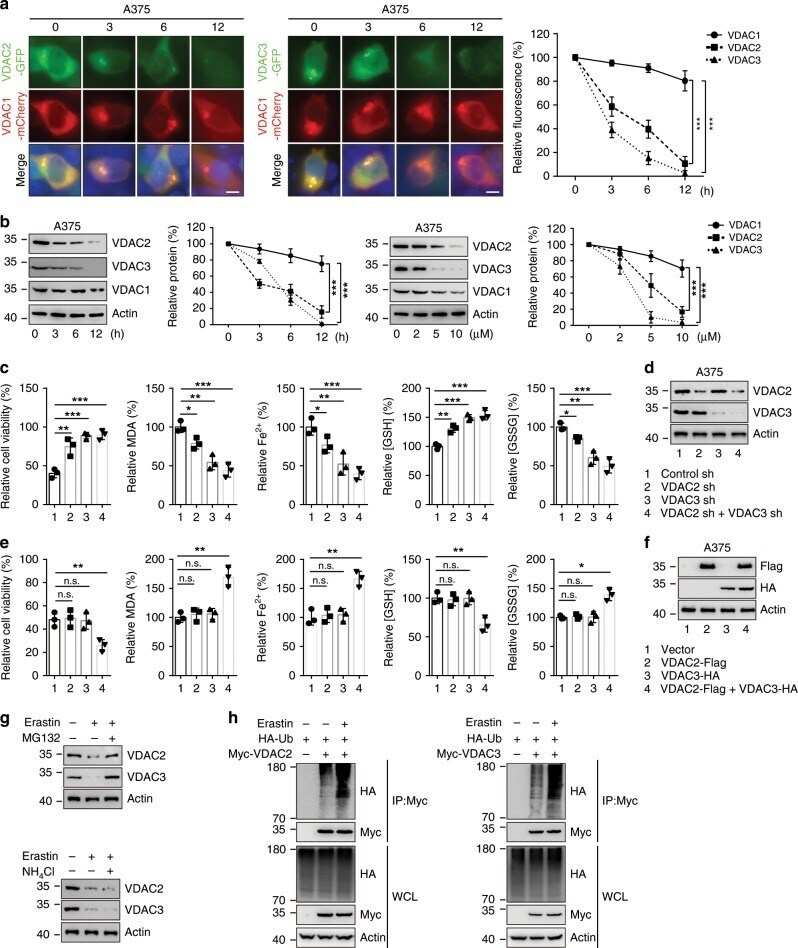
- Fig. 1 Erastin treatment promotes ubiquitin-proteasomal degradation of VDAC2/3. a A375 cells expressing GFP-VDAC2 or GFP-VDAC3 and mCherry-VDAC1 were treated with erastin (5 uM). Representative images were taken at the indicated time after treatment. Scale bars, 10 mum. Fluorescence intensity was assayed using Image J software. b A375 cells were treated with erastin at the indicated time (0-12 h, 10 uM) or indicated concentrations (0-10 uM, 12 h). Western blot analysis shows the expression of VDAC2, VDAC3, and VDAC1 in indicated cells. c , d Knockdown of VDAC2 and VDAC3 individually or in combination suppressed erastin-induced ferroptotic cell death. Indicated cells were treated with erastin (5 uM) for 24 h. Cell viability was assayed using a CCK8 kit. The lipid formation was measured by MDA assay. The accumulation of Fe 2+ was measured by iron detection assay. The concentrations of GSH and GSSG were detected by relative assay kits ( c ). The protein level of VDAC2/3 was assessed by immunoblotting ( d ). e , f Overexpression of VDAC2 and VDAC3 together increased erastin-induced ferroptotic cell death. Indicated cells were treated with erastin (5 uM) for 24 h. Cell viability, intracellular MDA, Fe 2+ , GSH, and GSSG levels were measured ( e ). The overexpression of VDAC2/3 was assessed by immunoblotting ( f ). g A375 cells were treated with erastin (5 uM) for 8 h, then MG132 (50 mM) or NH 4 Cl (50 mM) were added into the culture medium for 4 h. The protein level of VDAC2/3 was
- Submitted by
- Invitrogen Antibodies (provider)
- Main image

- Experimental details
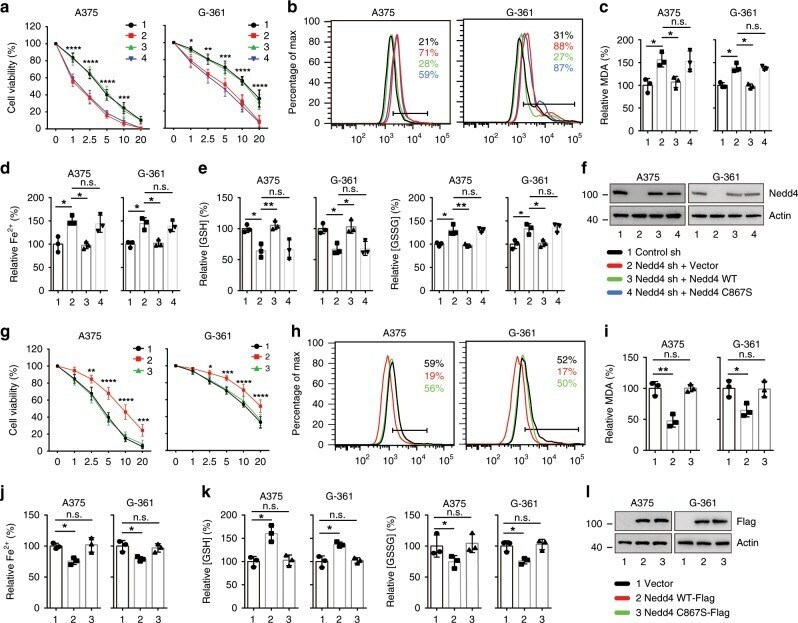
- Fig. 4 Nedd4 regulates erastin-induced ferroptosis. a - f Knockdown of Nedd4 enhanced erastin-induced ferroptotic cell death. Indicated cells were treated with erastin (1-20 uM) for 24 h, and cell viability was assayed using a CCK8 kit ( a ). Indicated cells were treated with erastin (5 uM) for 24 h, the lipid ROS level was assessed by flow cytometry using C11-BODIPY ( b ), and the lipid formation was measured by MDA assay ( c ). The accumulation of Fe 2+ was measured by iron detection assay ( d ), concentrations of GSH, and GSSG were detected by relative assay kits ( e ). The expression of Nedd4 was assessed by immunoblotting and compared to actin levels ( f ). Number 1 and black color represent control sh group; number 2 and red color represent Nedd4 sh + Vector group; number 3 and green color represent Nedd4 sh + Nedd4 WT group; number 4 and blue color represent Nedd4 sh + Nedd4 C867S group. g - l Overexpression of Nedd4 suppressed erastin-induced ferroptotic cell death. Indicated cells were treated with erastin (1-20 uM) for 24 h, and cell viability was assayed using a CCK8 kit ( g ). Indicated cells were treated with erastin (5 uM) for 24 h, the lipid ROS level was assessed by flow cytometry using C11-BODIPY ( h ), and the lipid formation was measured by MDA assay ( i ). The accumulation of Fe 2+ was measured by iron detection assay ( j ), concentrations of GSH and GSSG were detected by relative assay kits ( k ). The expression of Nedd4 was assessed by immunoblotting and
- Submitted by
- Invitrogen Antibodies (provider)
- Main image
- Experimental details
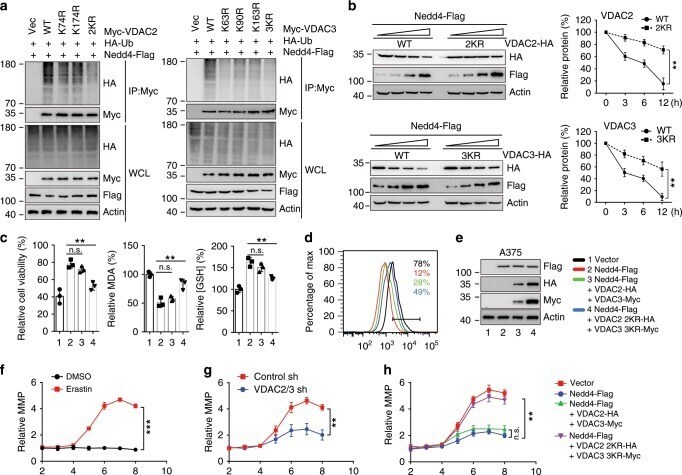
- Fig. 5 Nedd4 regulates VDAC2/3 degradation through specific ubiquitination sites. a A375 cells were transfected with combinations of DNA constructs as indicated and treated with MG132 for 4 h. Lysates were immunoprecipitated with anti-Myc, and western blots were performed to analyze the presence of indicated proteins and levels of ubiquitination. b A375 cells were transfected with combinations of DNA constructs as indicated and treated with erastin (5 uM) for indicated time. Cell lysates were analyzed by immunoblotting with indicated antibodies. The protein level of VDAC2/3 was quantitated by Image J and normalized to actin levels. c - e Overexpression of KR mutants of VDAC2/3 partially rescued the cell sensitivity to erastin, which was inhibited by Nedd4. A375 cells were transfected with indicated DNA constructs for 48 h and treated with erastin (5 uM) for 12 h. Cell viability, intracellular MDA, and GSH levels were measured ( c ). The lipid ROS level was assessed by flow cytometry using C11-BODIPY ( d ). The protein levels of overexpressed constructs were assessed by immunoblotting ( e ). f Quantification of MMP during erastin-induced ferroptosis. A375 cells were treated with erastin and 50 nM TMRE was added 20 min before each indicated time point. g Suppression of VDAC2/3 inhibited ferroptosis-associated MMP hyperpolarization. A375 cells expressing indicated shRNA constructs were treated with erastin and 50 nM TMRE was added 20 min before each indicated time point. h Overe
- Submitted by
- Invitrogen Antibodies (provider)
- Main image
- Experimental details
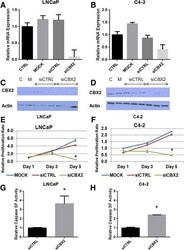
- Fig. 3 CBX2 depletion induces proliferation arrest and apoptosis in advanced PCa cell lines. a , b Confirmation of CBX2 mRNA knockdown in LNCaP and C4-2 cells by qPCR; c , d Confirmation of CBX2 protein knockdown in LNCaP and C4-2 cells; e , f MTT analysis of cell viability following CBX2 silencing in LNCaP and C4-2 cells; g , h Assessment of caspase 3-7 activity in LNCaP and C4-2 cells following CBX2 depletion

- Submitted by
- Invitrogen Antibodies (provider)
- Main image
- Experimental details
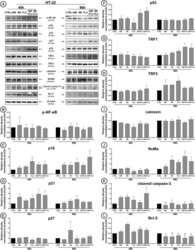
- Fig. 4 Antidepressants-mediated effect on cellular protein content. HT-22 cells were treated with antidepressants for 48 and 96 h and densitometry analysis of NF-kappaB ( b ), p16 ( c ), p21 ( d ), p27 ( e ), p53 ( f ), TRF1 ( g ), TRF2 ( h ), calnexin ( i ), NuMa ( j ), cleaved caspase 3 ( k ), Bcl-2 ( l ) was evaluated. Representative Western Blots are presented ( a ). Bars indicate SD, n = 3, *** /^^^ p < 0.001, ** /^^ p < 0.01, * /^ p < 0.05, no indication--no statistical significance (one-way ANOVA and Dunnett's a posteriori test)

- Submitted by
- Invitrogen Antibodies (provider)
- Main image
- Experimental details
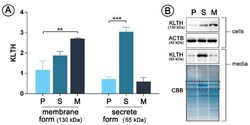
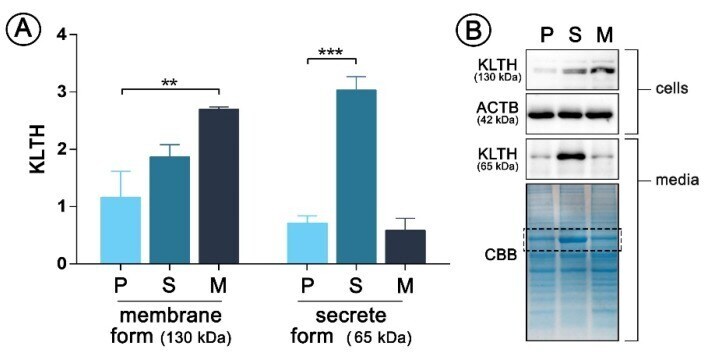
- Figure 1 pDNA(plasmid DNA)-mediated klotho overexpression in human monocytic cells Cells were transfected with pDNA and selected in antibiotics to obtain stable clones and then Western Blot analysis of klotho membrane (130 kDa) and secrete (65 kDa) forms expression was performed ( A ). Representative images of Western Blot membrane and Coomassie staining are presented ( B ). The bands were quantified and normalized to their corresponding beta-actin bands in the case of membrane form of klotho or to CBB staining in the case of secrete form. Bars indicate SD, n = 3, *** p < 0.001, ** p < 0.01 (one-way ANOVA and Dunnett's a posteriori test). ACTB actin, KLTH klotho, CBB Coomassie Brilliant Blue staining.
- Submitted by
- Invitrogen Antibodies (provider)
- Main image
- Experimental details
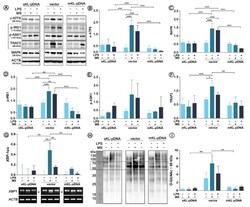
- Figure 2 Expression of proteins involved in the Golgi stress response. Klotho expression was upregulated with pDNA, cells were treated for 72 h with monensin sodium or 168 h with LPS and expression of proteins involved in CREB34L-, HSP47- and TFE3-mediated pathways was evaluated with Western Blot method (A), i.e.,: CREB34L (B), ARF4 (C), HSP47 (D), and TFE3 (E). The bands were quantified and normalized to their corresponding β-actin bands. Bars indicate SD, n = 3, *** p < 0.001, ** p < 0.01, * p < 0.05, no indication - no statistical significance (one-way ANOVA and Dunnett’s a posteriori test).

- Submitted by
- Invitrogen Antibodies (provider)
- Main image

- Experimental details
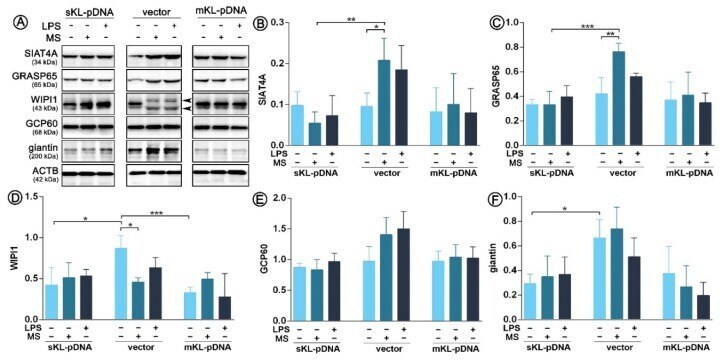
- Figure 3 Expression of proteins involved in the Golgi-mediated stress response. Klotho expression was upregulated with pDNA, cells were treated for 72 h with monensin sodium or 168 h with LPS and the expression of TFE3-related proteins was evaluated with Western Blot method ( A ), i.e.,: SIAT4A ( B ), GRASP65 ( C ), WIPI1 ( D ), GCP60 ( E ), and giantin ( F ). The bands were quantified and normalized to their corresponding beta-actin bands. Bars indicate SD, n = 3, *** p < 0.001, ** p < 0.01, * p < 0.05, no indication - no statistical significance (one-way ANOVA and Dunnett's a posteriori test).
- Submitted by
- Invitrogen Antibodies (provider)
- Main image
- Experimental details
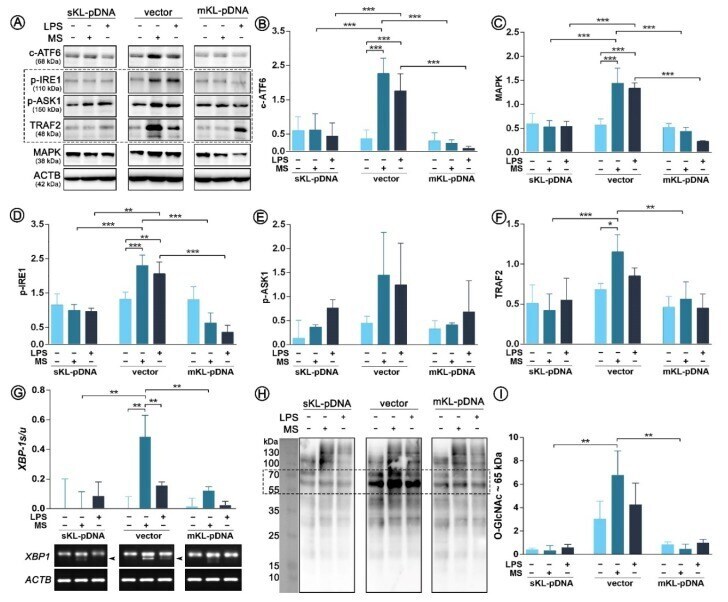
- Figure 4 Expression of factors involved in ER stress response. Klotho expression was upregulated with pDNA, cells were treated for 72 h with monensin sodium or 168 h with LPS and expression of proteins involved in ATF6- and IRE1-mediated pathways was evaluated with Western Blot method ( A ), i.e.,: c-ATF6 ( B ), MAPK ( C ), p-IRE1 ( D ), p-ASK1 ( E ), and TRAF2 ( F ). XBP-1 splicing was evaluated by RT-PCR ( G ) and O-GlcNAc levels by WB ( H , I ). The bands were quantified and normalized to their corresponding beta-actin bands. Bars indicate SD, n = 3, *** p < 0.001, ** p < 0.01, * p < 0.05, no indication - no statistical significance (one-way ANOVA and Dunnett's a posteriori test).
- Submitted by
- Invitrogen Antibodies (provider)
- Main image
- Experimental details
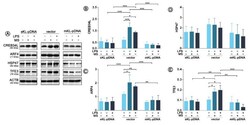
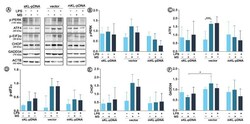
- Figure 5 Expression of factors involved in ER stress response. Klotho expression was upregulated with pDNA, cells were treated for 72 h with monensin sodium or 168 h with LPS and expression of proteins involved in PERK-mediated pathway was evaluated with Western Blot method ( A ), i.e.,: p-PERK ( B ), ATF4 ( C ), p-eIF2alpha ( D ), CHOP ( E ), and GADD34 ( F ). The bands were quantified and normalized to their corresponding beta-actin bands. Bars indicate SD, n = 3, *** p

- Submitted by
- Invitrogen Antibodies (provider)
- Main image
- Experimental details
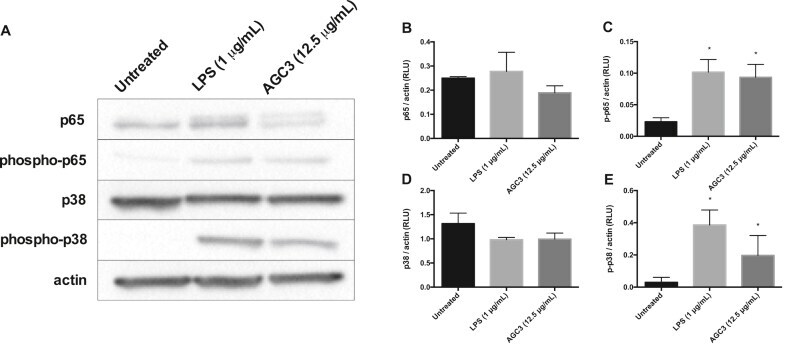
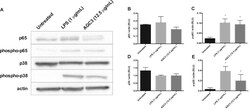
- Fig. 4 AGC3 activates NF-kappaB (p65) and MAPK (p38) in RAW 264.7 Macrophages. RAW 264.7 macrophages were treated with AGC3 (12.5 mug/mL), LPS (1 mug/mL), or culture medium for 15 min. Total protein was extracted using RIPA buffer and changes in phosphorylated p65 (phospho-p65) and phosphorylated p38 (phospho-p38) were analyzed using Western blots and densitometry. beta-actin was used as a loading control. (A) Western blot of p65 and p38 activation; (B) Ratio of p65:beta-actin; (C) Ratio of phospho-p65:beta-actin; (D) Ratio of p38:beta-actin; (E) Ratio of phospho-p38:beta-actin. Results are shown as the mean of the ratio for each protein to beta-actin +- SEM for three independent treatments. Densitometry values were determined using ImageJ and compared (untreated versus LPS; untreated versus AGC3) by non-parametric Mann-Whitney's U test (* p