Explore
 Validate
 Learn
Learn Western blot
 Immunocytochemistry
Antibody data
- Antibody Data
- Antigen structure
- References [3]
- Comments [0]
- Validations
- Immunocytochemistry [1]
- Immunohistochemistry [3]
- Flow cytometry [1]
Submit
Validation data
Reference
Comment
Report error
- Product number
- 34-2200 - Provider product page

- Provider
- Invitrogen Antibodies
- Product name
- Anti-Cullin 3 Polyclonal Antibody
- Antibody type
- Polyclonal
- Antigen
- Synthetic peptide
- Reactivity
- Human, Mouse
- Host
- Rabbit
- Isotype
- IgG
- Vial size
- 100 µg
- Concentration
- 0.25 mg/ml
- Storage
- -20°C
Submitted references Mechanism of cullin3 E3 ubiquitin ligase dimerization.
Neddylation-induced conformational control regulates cullin RING ligase activity in vivo.
Cullin 3 promotes proteasomal degradation of the topoisomerase I-DNA covalent complex.
Choo YY, Hagen T
PloS one 2012;7(7):e41350
PloS one 2012;7(7):e41350
Neddylation-induced conformational control regulates cullin RING ligase activity in vivo.
Boh BK, Smith PG, Hagen T
Journal of molecular biology 2011 Jun 3;409(2):136-45
Journal of molecular biology 2011 Jun 3;409(2):136-45
Cullin 3 promotes proteasomal degradation of the topoisomerase I-DNA covalent complex.
Zhang HF, Tomida A, Koshimizu R, Ogiso Y, Lei S, Tsuruo T
Cancer research 2004 Feb 1;64(3):1114-21
Cancer research 2004 Feb 1;64(3):1114-21
No comments: Submit comment
Supportive validation
- Submitted by
- Invitrogen Antibodies (provider)
- Main image
- Experimental details
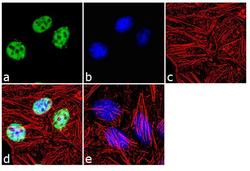
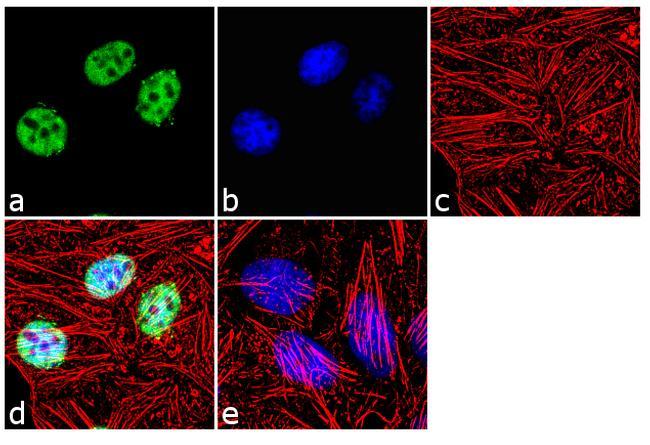
- Immunofluorescence analysis of CUL-3 was performed using 70% confluent log phase HeLa cells. The cells were fixed with 4% paraformaldehyde for 10 minutes, permeabilized with 0.1% Triton™ X-100 for 10 minutes, and blocked with 2% BSA for 1 hour at room temperature. The cells were labeled with CUL-3 Rabbit Polyclonal Antibody (Product # 34-2200) at 2 µg/mL in 0.1% BSA and incubated for 3 hours at room temperature and then labeled with Goat anti-Rabbit IgG (H+L) Superclonal™ Secondary Antibody, Alexa Fluor® 488 conjugate (Product # A27034) a dilution of 1:2000 for 45 minutes at room temperature (Panel a: green). Nuclei (Panel b: blue) were stained with SlowFade® Gold Antifade Mountant with DAPI (Product # S36938). F-actin (Panel c: red) was stained with Alexa Fluor® 555 Rhodamine Phalloidin (Product # R415, 1:300). Panel d represents the merged image showing nuclear localization. Panel e shows the no primary antibody control. The images were captured at 60X magnification.
Supportive validation
- Submitted by
- Invitrogen Antibodies (provider)
- Main image
- Experimental details
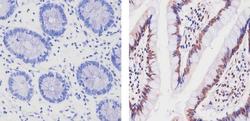
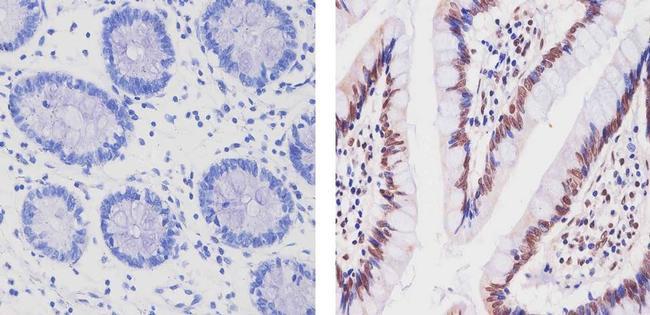
- Immunohistochemistry analysis of CUL-3 showing staining in the nucleus and weak staining in the cytoplasm of paraffin-embedded human colon tissue (right) compared to a negative control without primary antibody (left). To expose target proteins, antigen retrieval was performed using 10mM sodium citrate (pH 6.0), microwaved for 8-15 min. Following antigen retrieval, tissues were blocked in 3% H2O2-methanol for 15 min at room temperature, washed with ddH2O and PBS, and then probed with a CUL-3 Rabbit Polyclonal Antibody (Product # 34-2200) diluted in 3% BSA-PBS at a dilution of 1:20 for 1 hour at 37ºC in a humidified chamber. Tissues were washed extensively in PBST and detection was performed using an HRP-conjugated secondary antibody followed by colorimetric detection using a DAB kit. Tissues were counterstained with hematoxylin and dehydrated with ethanol and xylene to prep for mounting.
- Submitted by
- Invitrogen Antibodies (provider)
- Main image
- Experimental details
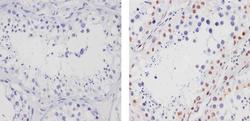
- Immunohistochemistry analysis of CUL-3 showing staining in the nucleus of paraffin-embedded human testis tissue (right) compared to a negative control without primary antibody (left). To expose target proteins, antigen retrieval was performed using 10mM sodium citrate (pH 6.0), microwaved for 8-15 min. Following antigen retrieval, tissues were blocked in 3% H2O2-methanol for 15 min at room temperature, washed with ddH2O and PBS, and then probed with a CUL-3 Rabbit Polyclonal Antibody (Product # 34-2200) diluted in 3% BSA-PBS at a dilution of 1:100 for 1 hour at 37ºC in a humidified chamber. Tissues were washed extensively in PBST and detection was performed using an HRP-conjugated secondary antibody followed by colorimetric detection using a DAB kit. Tissues were counterstained with hematoxylin and dehydrated with ethanol and xylene to prep for mounting.

- Submitted by
- Invitrogen Antibodies (provider)
- Main image
- Experimental details
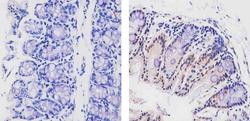
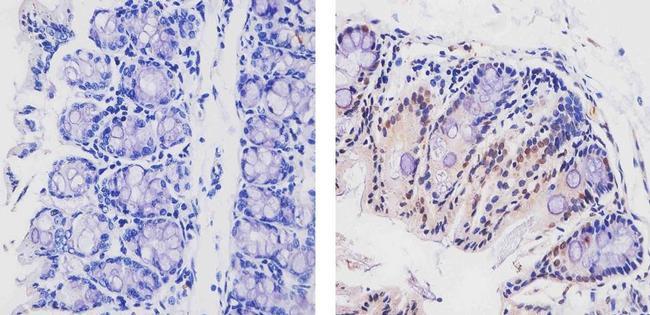
- Immunohistochemistry analysis of CUL-3 showing staining in the nucleus and weak staining in the cytoplasm of paraffin-embedded mouse colon tissue (right) compared to a negative control without primary antibody (left). To expose target proteins, antigen retrieval was performed using 10mM sodium citrate (pH 6.0), microwaved for 8-15 min. Following antigen retrieval, tissues were blocked in 3% H2O2-methanol for 15 min at room temperature, washed with ddH2O and PBS, and then probed with a CUL-3 Rabbit Polyclonal Antibody (Product # 34-2200) diluted in 3% BSA-PBS at a dilution of 1:20 for 1 hour at 37ºC in a humidified chamber. Tissues were washed extensively in PBST and detection was performed using an HRP-conjugated secondary antibody followed by colorimetric detection using a DAB kit. Tissues were counterstained with hematoxylin and dehydrated with ethanol and xylene to prep for mounting.
Supportive validation
- Submitted by
- Invitrogen Antibodies (provider)
- Main image
- Experimental details
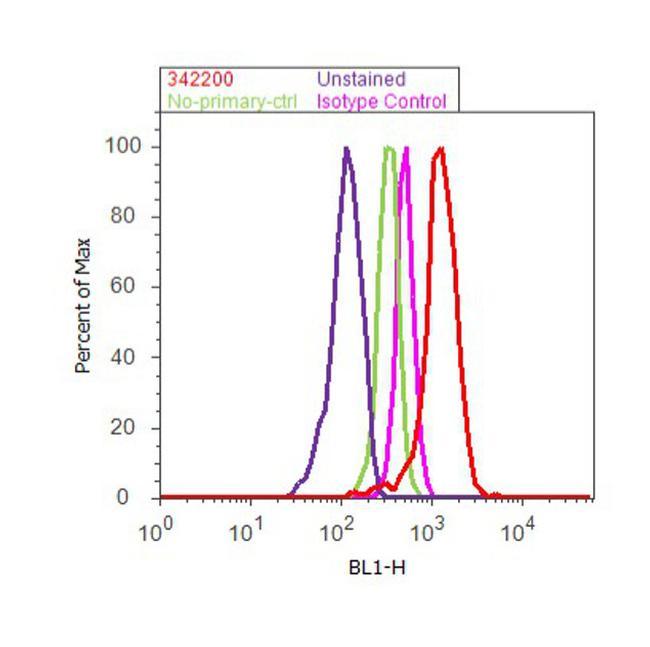
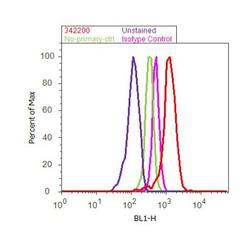
- Flow cytometry analysis of CUL-3 was done on HEL cells. Cells were fixed with 70% ethanol for 10 minutes, permeabilized with 0.25% Triton™ X-100 for 20 minutes, and blocked with 5% BSA for 30 minutes at room temperature. Cells were labeled with CUL-3 Rabbit Polyclonal Antibody (342200, red histogram) or with rabbit isotype control (pink histogram) at 3-5 ug/million cells in 2.5% BSA. After incubation at room temperature for 2 hours, the cells were labeled with Alexa Fluor® 488 Goat Anti-Rabbit Secondary Antibody (A11008) at a dilution of 1:400 for 30 minutes at room temperature. The representative 10,000 cells were acquired and analyzed for each sample using an Attune® Acoustic Focusing Cytometer. The purple histogram represents unstained control cells and the green histogram represents no-primary-antibody control..