Explore
 Validate
 Learn
Learn Western blot
 Immunocytochemistry
Antibody data
- Antibody Data
- Antigen structure
- References [4]
- Comments [0]
- Validations
- Immunocytochemistry [3]
- Immunohistochemistry [1]
- Other assay [3]
Submit
Validation data
Reference
Comment
Report error
- Product number
- PA5-22260 - Provider product page

- Provider
- Invitrogen Antibodies
- Product name
- GAD65 Polyclonal Antibody
- Antibody type
- Polyclonal
- Antigen
- Recombinant full-length protein
- Description
- Recommended positive controls: mouse brain, rat brain. Predicted reactivity: Mouse (96%), Rat (96%), Zebrafish (86%), Dog (96%), Pig (95%), Rhesus Monkey (100%), Bovine (93%). Store product as a concentrated solution. Centrifuge briefly prior to opening the vial.
- Reactivity
- Human, Mouse, Rat
- Host
- Rabbit
- Isotype
- IgG
- Vial size
- 100 μL
- Concentration
- 0.25 mg/mL
- Storage
- Store at 4°C short term. For long term storage, store at -20°C, avoiding freeze/thaw cycles.
Submitted references Lithium treatment reverses irradiation-induced changes in rodent neural progenitors and rescues cognition.
Increased Frataxin Expression Induced in Friedreich Ataxia Cells by Platinum TALE-VP64s or Platinum TALE-SunTag.
GABAergic signaling linked to autophagy enhances host protection against intracellular bacterial infections.
Anatomical and Electrophysiological Clustering of Superficial Medial Entorhinal Cortex Interneurons.
Zanni G, Goto S, Fragopoulou AF, Gaudenzi G, Naidoo V, Di Martino E, Levy G, Dominguez CA, Dethlefsen O, Cedazo-Minguez A, Merino-Serrais P, Stamatakis A, Hermanson O, Blomgren K
Molecular psychiatry 2021 Jan;26(1):322-340
Molecular psychiatry 2021 Jan;26(1):322-340
Increased Frataxin Expression Induced in Friedreich Ataxia Cells by Platinum TALE-VP64s or Platinum TALE-SunTag.
Cherif K, Gérard C, Rousseau J, Ouellet DL, Chapdelaine P, Tremblay JP
Molecular therapy. Nucleic acids 2018 Sep 7;12:19-32
Molecular therapy. Nucleic acids 2018 Sep 7;12:19-32
GABAergic signaling linked to autophagy enhances host protection against intracellular bacterial infections.
Kim JK, Kim YS, Lee HM, Jin HS, Neupane C, Kim S, Lee SH, Min JJ, Sasai M, Jeong JH, Choe SK, Kim JM, Yamamoto M, Choy HE, Park JB, Jo EK
Nature communications 2018 Oct 10;9(1):4184
Nature communications 2018 Oct 10;9(1):4184
Anatomical and Electrophysiological Clustering of Superficial Medial Entorhinal Cortex Interneurons.
Martínez JJ, Rahsepar B, White JA
eNeuro 2017 Sep-Oct;4(5)
eNeuro 2017 Sep-Oct;4(5)
No comments: Submit comment
Supportive validation
- Submitted by
- Invitrogen Antibodies (provider)
- Main image
- Experimental details
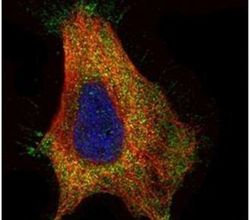
- Immunofluorescent analysis of GAD65 in paraformaldehyde-fixed HeLa cells using a GAD65 polyclonal antibody (Product # PA5-22260) (Green) at a 1:500 dilution. Alpha-tubulin filaments were labeled with Product # PA5-29281 (Red) at a 1:2500.
- Submitted by
- Invitrogen Antibodies (provider)
- Main image

- Experimental details
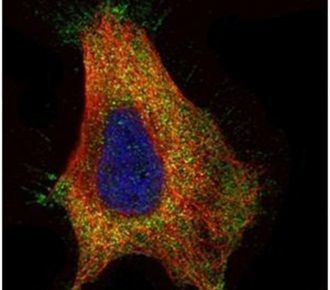
- Immunocytochemistry-Immunofluorescence analysis of GAD65 was performed in DIV9 rat E18 primary hippocampal neuron cells fixed in 4% paraformaldehyde at RT for 15 min. Green: GAD65 Polyclonal Antibody (Product # PA5-22260) diluted at 1:500. Red: beta Tubulin 3/ Tuj1, stained by beta Tubulin 3/ Tuj1 antibody. Blue: Fluoroshield with DAPI.

- Submitted by
- Invitrogen Antibodies (provider)
- Main image
- Experimental details
- Immunocytochemistry-Immunofluorescence analysis of GAD65 was performed in DIV9 rat E18 primary hippocampal neuron cells fixed in 4% paraformaldehyde at RT for 15 min. Green: GAD65 Polyclonal Antibody (Product # PA5-22260) diluted at 1:500. Red: beta Tubulin 3/ Tuj1, stained by beta Tubulin 3/ Tuj1 antibody. Blue: Fluoroshield with DAPI.

Supportive validation
- Submitted by
- Invitrogen Antibodies (provider)
- Main image
- Experimental details
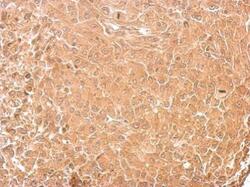
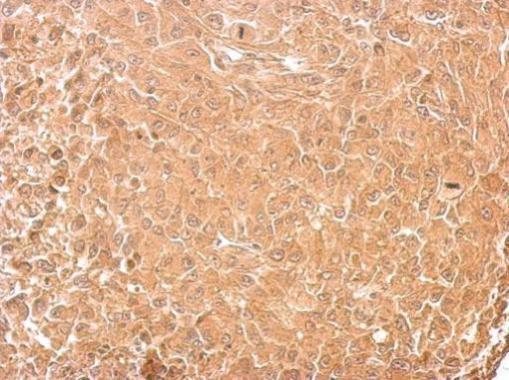
- GAD65 Polyclonal Antibody detects GAD2 protein at cytosol on RT2 xenograft by immunohistochemical analysis. Sample: Paraffin-embedded RT2 xenograft. GAD65 Polyclonal Antibody (Product # PA5-22260) dilution: 1:500. Antigen Retrieval: EDTA based buffer, pH 8.0, 15 min.
Supportive validation
- Submitted by
- Invitrogen Antibodies (provider)
- Main image

- Experimental details
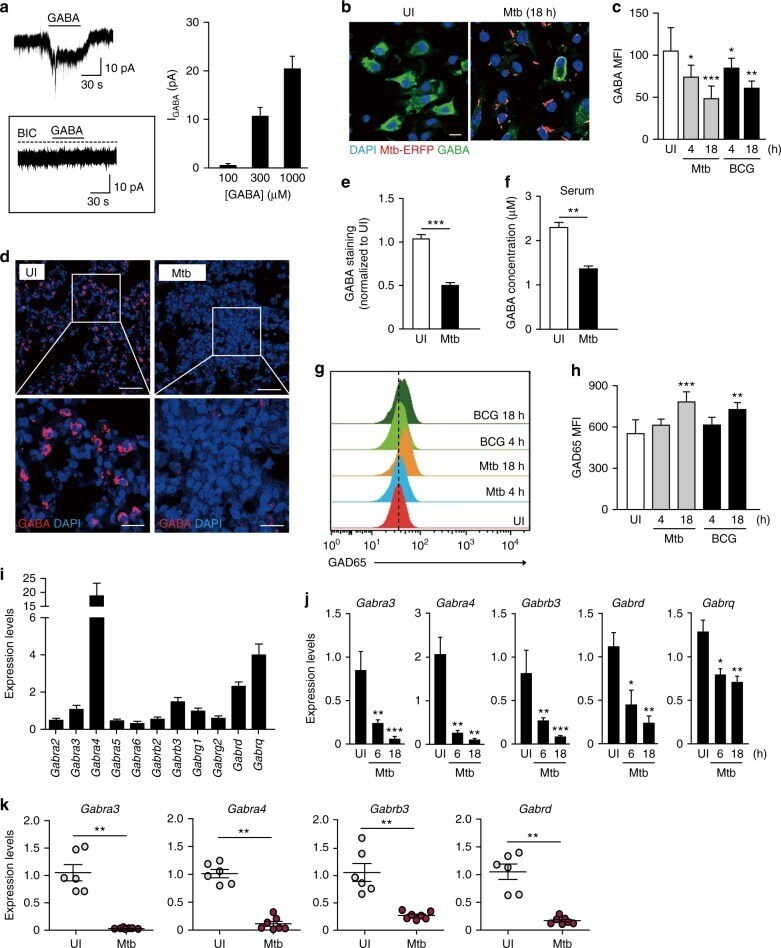
- Fig. 1 The macrophage GABAergic system and GABA levels during infection. a Representative GABA-induced whole-cell currents in BMDMs (GABA, 300 uM). Bottom, the effects by GABA A R antagonist bicuculline (BIC, 50 uM). Right, quantification of GABA-induced currents at each GABA concentration. b , c BMDMs were infected with Mtb-ERFP (MOI of 5) for the indicated times and stained with GABA (green) and DAPI (nuclei; blue). b Cells were visualized by confocal microscopy. Scale bars, 15 mum. c Average mean fluorescence intensities (MFIs) of GABA. d - f Mice were infected i.v. with Mtb (1 x 10 6 CFU), and monitored at 14 dpi. Lung tissues were stained with GABA (red) and DAPI (nuclei; blue). d Representative in vivo imaging data from multiple lesions of Mtb-infected or -uninfected lungs ( n = 8 per group). Scale bars, 50 mum (top) and 20 mum (bottom). e Average MFIs of GABA staining ( n = 4 per group). f GABA in serum was measured by ELISA ( n = 8 per group). g , h BMDMs were infected with Mtb (MOI of 5) or BCG (MOI of 5) for the indicated times. g GAD65 expression analyzed by flow cytometry. The units of the horizontal axis are the fluorescence (FITC) intensity. Representative gating strategy is shown in Supplementary Fig. 5 . h Average MFIs of GAD65. i In BMDMs, 11 GABA A R subunit mRNAs were determined using the Ct method, and normalized to the reference gene Gapdh . j BMDMs were infected with Mtb (MOI of 5) for the indicated times and GABA A R su
- Submitted by
- Invitrogen Antibodies (provider)
- Main image
- Experimental details
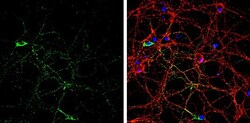
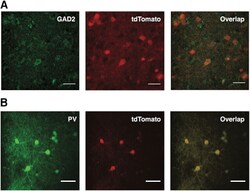
- Figure 2. Immunohistochemical validation of transgenic mouse lines. A , Representative image showing overlap of GAD2 labeling with tdTomato cells of transgenic mice. The great majority of the tdTomato-positive cells are labeled for GAD2 as well (91.2% of 74 cells counted; n = 2 animals). Scale bar: 25 mum. B , Representative image showing overlap of staining for PV with tdTomato cells. Nearly all tdTomato-positive cells are labeled for PV as well (97% of 74 cells counted; n = 2 animals). Scale bar: 15 mum.

- Submitted by
- Invitrogen Antibodies (provider)
- Main image

- Experimental details
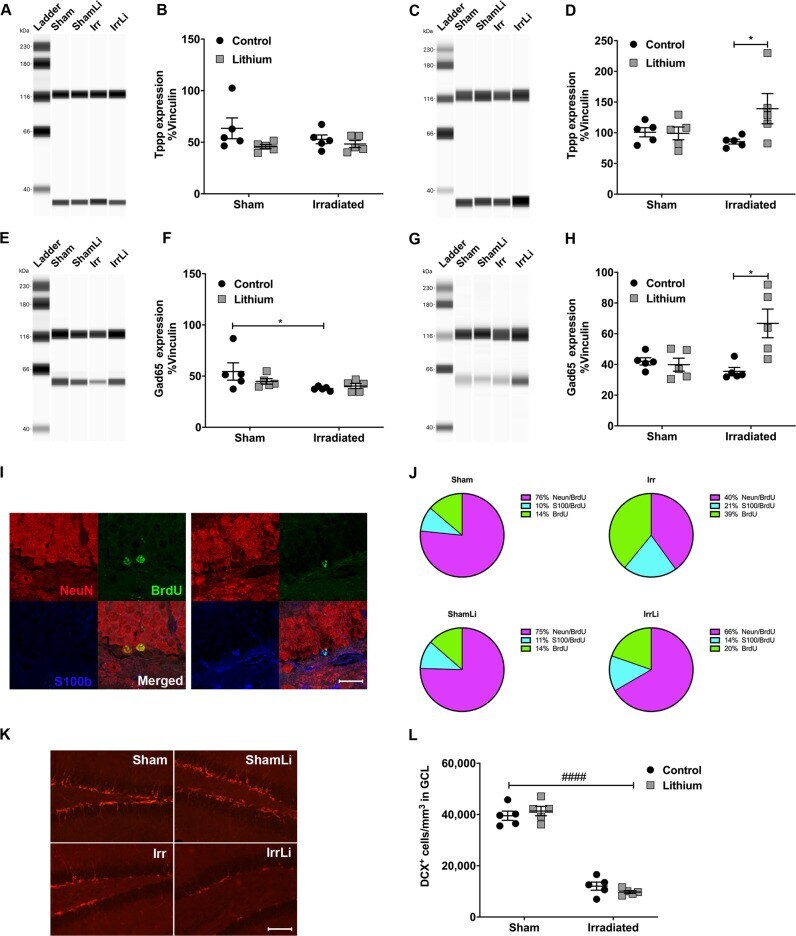
- Fig. 4 Lithium regulated the expression of cell cycle and neuronal transmission proteins in vivo and reverted the irradiation-induced changes in NSPC fate progression in the mouse DG. a Representative western blot lanes of Tppp migration at PND 77. Tppp signal was observed at the MW of 37 kDa. Vinculin, used as a loading control, was observed at the expected MW of 118 kDa. b Dot plot graph showing the quantification of the normalized chemiluminescence peak of Tppp against its loading control vinculin at PND 77. Tppp expression levels in the DG were unaltered in all treatment groups. Two-way ANOVA: irradiation ( F 1,16 = 0.4998, p = 0.4898), lithium ( F 1,16 = 3.654, p = 0.0740). c Representative western blot lanes of Tppp migration at PND 91. d Dot plot graph showing the quantification of the normalized chemiluminescence peak of Tppp against its loading control vinculin at PND 91. The Tppp expression level in the DG was significantly increased in the IrrLi group (* p = 0.0313). Two-way ANOVA: irradiation ( F 1,16 = 0.7927, p = 0.3865), lithium ( F 1,16 = 3.414, p = 0.0832). e Representative western blot lanes of GAD65 migration at PND 77. GAD65 signal was observed at the MW of 65 kDa. Vinculin, used as a loading control, was observed at the expected MW of 118 kDa. f Dot plot graph showing the quantification of the normalized chemiluminescence peak of GAD65 against its loading control, vinculin at PND 77. GAD65 expression level in the DG was significantly reduced in the Irr gr