Explore
 Validate
 Learn
Learn Western blot
 Flow cytometry
Antibody data
- Antibody Data
- Antigen structure
- References [1]
- Comments [0]
- Validations
- Flow cytometry [3]
- Other assay [1]
Submit
Validation data
Reference
Comment
Report error
- Product number
- MA5-24164 - Provider product page

- Provider
- Invitrogen Antibodies
- Product name
- CEACAM6 Monoclonal Antibody (439424)
- Antibody type
- Monoclonal
- Antigen
- Recombinant full-length protein
- Description
- In direct ELISAs and Western blots, no cross-reactivity with recombinant human CEACAM-1, -3, or -5 is observed. Reconstitute at 0.5 mg/mL in sterile PBS.
- Reactivity
- Human, Mouse
- Host
- Mouse
- Isotype
- IgG
- Antibody clone number
- 439424
- Vial size
- 100 µg
- Concentration
- 0.5 mg/mL
- Storage
- -20° C, Avoid Freeze/Thaw Cycles
Submitted references Biological Functions and Identification of Novel Biomarker Expressed on the Surface of Breast Cancer-Derived Cancer Stem Cells via Proteomic Analysis.
Koh EY, You JE, Jung SH, Kim PH
Molecules and cells 2020 Apr 30;43(4):384-396
Molecules and cells 2020 Apr 30;43(4):384-396
No comments: Submit comment
Supportive validation
- Submitted by
- Invitrogen Antibodies (provider)
- Main image

- Experimental details
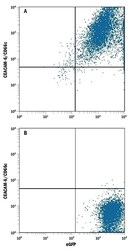
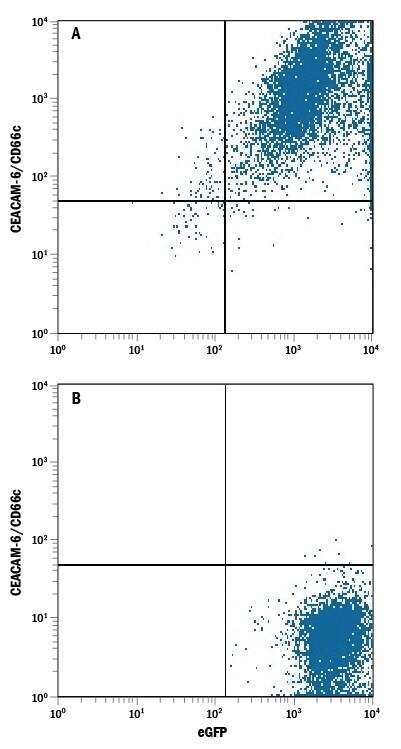
- Flow cytometric analysis of HEK293 human embryonic kidney cell line transfected with (A) human CEACAM-6/CD66c or (B) irrelevant transfectants and eGFP was stained with Mouse Anti-Human CEACAM-6/CD66c Monoclonal Antibody (Product # MA5-24164) followed by Allophycocyanin-conjugated Anti-Mouse IgG Secondary Antibody. Quadrant markers were set based on control antibody staining.

- Submitted by
- Invitrogen Antibodies (provider)
- Main image
- Experimental details
- Flow cytometry of CEACAM6 in HEK293 human embryonic kidney cell line transfected with (A) human CEACAM-6/CD66c or (B) irrelevant transfectants and eGFP. Samples were incubated in CEACAM6 monoclonal antibody (Product # MA5-24164) followed by Allophycocyanin-conjugated Anti-Mouse IgG Secondary Antibody. Quadrant markers were set based on control antibody staining.
- Submitted by
- Invitrogen Antibodies (provider)
- Main image
- Experimental details
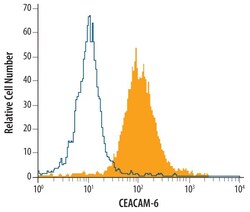
- Flow cytometry of CEACAM6 in Human whole blood granulocytes. Samples were incubated in CEACAM6 monoclonal antibody (Product # MA5-24164) or isotype control antibody followed by Phycoerythrin-conjugated Anti-Mouse IgG F(ab)2 Secondary Antibody.

Supportive validation
- Submitted by
- Invitrogen Antibodies (provider)
- Main image
- Experimental details
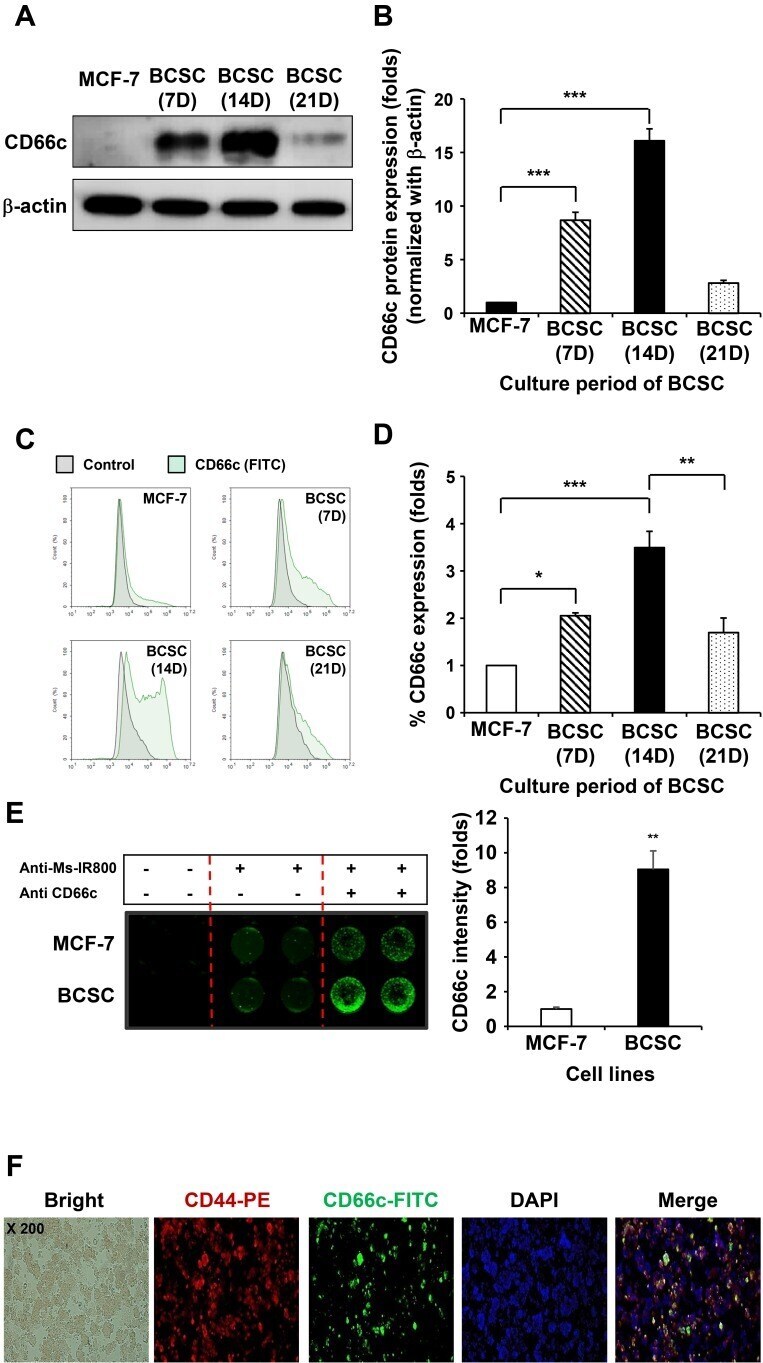
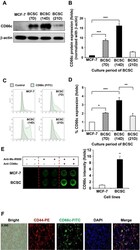
- Fig. 7 The expression of CD66c at the protein level in cultured BCSCs in a time-dependent manner. The expression of CD66c protein increased in a time-dependent manner in BSCSs compared to MCF-7 cells, in agreement with the transcriptomic results. These results indicate that the expression of CD66c is related to the maintenance period in CSCs, but not in cancer cells. (A) Confirmation of the expression of CD66c protein by western blotting. (B) Quantitative graph of the western blot. Data are expressed as the mean +- SEM. *** P < 0.01 versus MCF-7 group. (C) Resulting peaks of the CD66c protein levels as a factor of time expressed on the surface of BCSCs in the form of a histogram according to FACS data. (D) Quantitative graph of the shifted peak in the FACS data. Data are expressed as the mean +- SEM. * P < 0.05 and *** P < 0.01 for MCF-7 versus BCSC (7 days) or BCSC (14 days); **P < 0.02 for BCSC (14 days) versus BCSC (21 days). (E) The images of CD66c expressed on the surface of the BCSCs according to cell binding assay. Data are expressed as the mean +- SEM. ** P < 0.02 versus MCF-7 group. (F) Identification of the characteristics of CSCs in BCSCs expressing CD66c by immunocytochemistry.