Explore
 Validate
 Learn
Learn Flow cytometry
Antibody data
- Antibody Data
- Antigen structure
- References [8]
- Comments [0]
- Validations
- Flow cytometry [1]
- Other assay [7]
Submit
Validation data
Reference
Comment
Report error
- Product number
- 56-0106-42 - Provider product page

- Provider
- Invitrogen Antibodies
- Product name
- CD10 Monoclonal Antibody (eBioCB-CALLA (CB-CALLA)), Alexa Fluor™ 700, eBioscience™
- Antibody type
- Monoclonal
- Antigen
- Other
- Description
- Description: The eBioCB-CALLA monoclonal antibody recognizes human CD10 (CALLA, NEP, enkephalinase, Neprilysin), which is a 100 kDa, type II cell surface glycoprotein originally identified for its expression on most acute lymphoblastic leukemias (ALL). Subsequently, CD10 was shown to be the same molecule as the neutral endopeptidase (NEP), or KII-NA. CD10 is a Zn2+-dependent metallo-peptidase with endothelin, glucagon, gastrin, neurotensin and bradykinin included among its substrates. CD10 is involved in the regulation of chemotactic and inflammatory processes involving neutrophils. In B cells, CD10 regulates stromal cell-dependent B lymphopoiesis and expression has also been reported on mature B cells in germinal centres. In addition to the hematopoietic compartment, other major sites of CD10 expression are the brush border of enterocytes and renal tubules and glomeruli. There is partial blocking of the eBioCB-CALLA and MEM-78 monoclonal antibodies indicating that they recognize similar epitopes. Applications Reported: This eBioCB-CALLA (CB-CALLA) antibody has been reported for use in flow cytometric analysis. Applications Tested: This eBioCB-CALLA (CB-CALLA) antibody has been pre-titrated and tested by flow cytometric analysis of normal human peripheral blood cells. This can be used at 5 µL (0.25 µg) per test. A test is defined as the amount (µg) of antibody that will stain a cell sample in a final volume of 100 µL. Cell number should be determined empirically but can range from 10^5 to 10^8 cells/test. Alexa Fluor® 700 emits at 723 nm and can be excited with the red laser (633 nm). Most instruments will require a 685 LP mirror and 710/20 filter. Please make sure that your instrument is capable of detecting this fluorochrome. Excitation: 633-647 nm; Emission: 723 nm; Laser: Red Laser. Filtration: 0.2 µm post-manufacturing filtered.
- Reactivity
- Human
- Host
- Mouse
- Conjugate
- Near infrared dye
- Isotype
- IgG
- Antibody clone number
- eBioCB-CALLA (CB-CALLA)
- Vial size
- 100 Tests
- Concentration
- 5 µL/Test
- Storage
- 4° C, store in dark, DO NOT FREEZE!
Submitted references A CD10-OGP Membrane Peptolytic Signaling Axis in Fibroblasts Regulates Lipid Metabolism of Cancer Stem Cells via SCD1.
Elevated Calprotectin and Abnormal Myeloid Cell Subsets Discriminate Severe from Mild COVID-19.
Maternal Immunity Influences Vertical Transmission of Hepatitis B to Newborns.
Simvastatin inhibits the apoptosis of hippocampal cells in a mouse model of Alzheimer's disease.
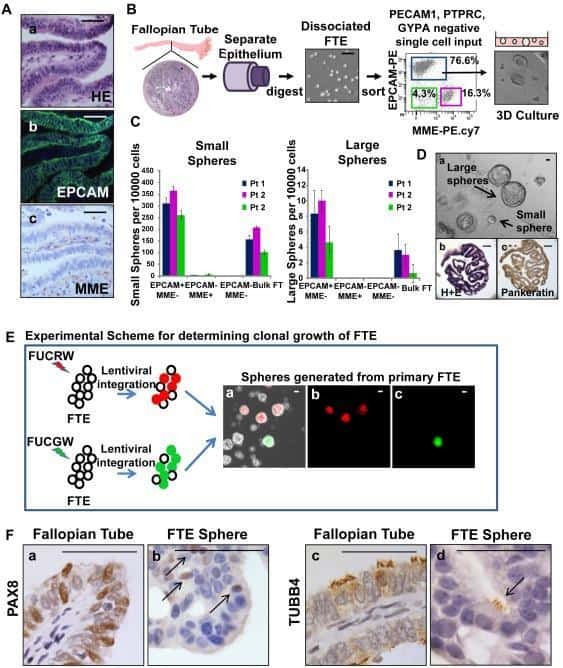
Stem-like epithelial cells are concentrated in the distal end of the fallopian tube: a site for injury and serous cancer initiation.
Structure/function studies of the common acute lymphoblastic leukemia antigen (CALLA/CD10) expressed on human neutrophils.
Distribution and modulation of a human leukemia-associated antigen (CALLA).
A monoclonal antibody to human acute lymphoblastic leukaemia antigen.
Yu S, Lu Y, Su A, Chen J, Li J, Zhou B, Liu X, Xia Q, Li Y, Li J, Huang M, Ye Y, Zhao Q, Jiang S, Yan X, Wang X, Di C, Pan J, Su S
Advanced science (Weinheim, Baden-Wurttemberg, Germany) 2021 Oct;8(19):e2101848
Advanced science (Weinheim, Baden-Wurttemberg, Germany) 2021 Oct;8(19):e2101848
Elevated Calprotectin and Abnormal Myeloid Cell Subsets Discriminate Severe from Mild COVID-19.
Silvin A, Chapuis N, Dunsmore G, Goubet AG, Dubuisson A, Derosa L, Almire C, Hénon C, Kosmider O, Droin N, Rameau P, Catelain C, Alfaro A, Dussiau C, Friedrich C, Sourdeau E, Marin N, Szwebel TA, Cantin D, Mouthon L, Borderie D, Deloger M, Bredel D, Mouraud S, Drubay D, Andrieu M, Lhonneur AS, Saada V, Stoclin A, Willekens C, Pommeret F, Griscelli F, Ng LG, Zhang Z, Bost P, Amit I, Barlesi F, Marabelle A, Pène F, Gachot B, André F, Zitvogel L, Ginhoux F, Fontenay M, Solary E
Cell 2020 Sep 17;182(6):1401-1418.e18
Cell 2020 Sep 17;182(6):1401-1418.e18
Maternal Immunity Influences Vertical Transmission of Hepatitis B to Newborns.
Vyas AK, Negi P, Patra S, Maras JS, Ramakrishna G, Sarin SK, Trehanpati N
Hepatology communications 2019 Jun;3(6):795-811
Hepatology communications 2019 Jun;3(6):795-811
Simvastatin inhibits the apoptosis of hippocampal cells in a mouse model of Alzheimer's disease.
Hu X, Song C, Fang M, Li C
Experimental and therapeutic medicine 2018 Feb;15(2):1795-1802
Experimental and therapeutic medicine 2018 Feb;15(2):1795-1802
Stem-like epithelial cells are concentrated in the distal end of the fallopian tube: a site for injury and serous cancer initiation.
Paik DY, Janzen DM, Schafenacker AM, Velasco VS, Shung MS, Cheng D, Huang J, Witte ON, Memarzadeh S
Stem cells (Dayton, Ohio) 2012 Nov;30(11):2487-97
Stem cells (Dayton, Ohio) 2012 Nov;30(11):2487-97
Structure/function studies of the common acute lymphoblastic leukemia antigen (CALLA/CD10) expressed on human neutrophils.
McCormack RT, Nelson RD, LeBien TW
Journal of immunology (Baltimore, Md. : 1950) 1986 Aug 1;137(3):1075-82
Journal of immunology (Baltimore, Md. : 1950) 1986 Aug 1;137(3):1075-82
Distribution and modulation of a human leukemia-associated antigen (CALLA).
Pesando JM, Tomaselli KJ, Lazarus H, Schlossman SF
Journal of immunology (Baltimore, Md. : 1950) 1983 Oct;131(4):2038-45
Journal of immunology (Baltimore, Md. : 1950) 1983 Oct;131(4):2038-45
A monoclonal antibody to human acute lymphoblastic leukaemia antigen.
Ritz J, Pesando JM, Notis-McConarty J, Lazarus H, Schlossman SF
Nature 1980 Feb 7;283(5747):583-5
Nature 1980 Feb 7;283(5747):583-5
No comments: Submit comment
Supportive validation
- Submitted by
- Invitrogen Antibodies (provider)
- Main image

- Experimental details
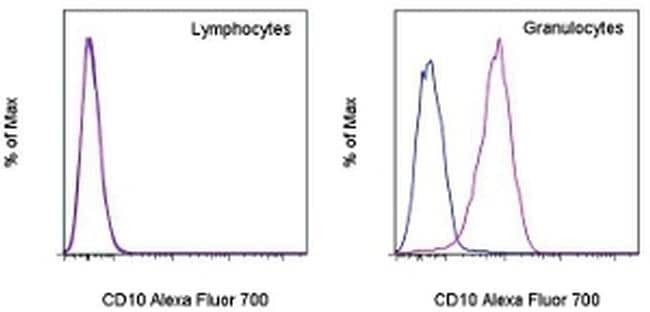
- Staining of normal human peripheral blood cells with Mouse IgG2b K Isotype Control Alexa Fluor® 700 (Product # 56-4732-80) (blue histogram) or Anti-Human CD10 Alexa Fluor® 700 (purple histogram). Cells in the lymphocyte (left) and granulocyte (right) gates were used for analysis.
- Conjugate
- Near infrared dye
Supportive validation
- Submitted by
- Invitrogen Antibodies (provider)
- Main image
- Experimental details
- NULL
- Conjugate
- Near infrared dye

- Submitted by
- Invitrogen Antibodies (provider)
- Main image
- Experimental details
- NULL
- Conjugate
- Near infrared dye
- Submitted by
- Invitrogen Antibodies (provider)
- Main image
- Experimental details
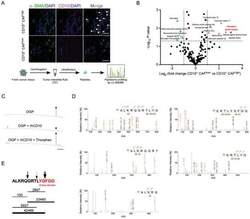
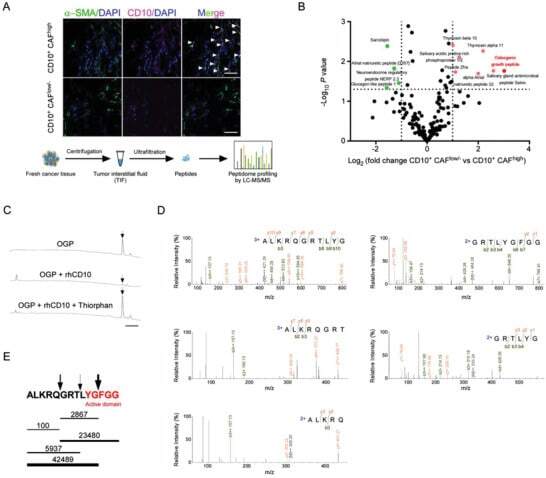
- Figure 3 OGP is a substrate of CD10 in tumors. A) Interstitial fluid of breast cancer samples from patients with high or low CD10 + CAF infiltration analyzed by HPLC-MS/MS to identify differentially distributed peptides. Representative immunofluorescent images of samples with high or low CD10 + CAFs (upper) and workflow (lower) are shown. White arrows indicate CD10 + CAFs. Scale bar, 50 um. B) The peptide profile identified in A. Red and green dots indicate peptides significantly increased and decreased in samples with low CD10 + CAFs compared in those with high CD10 + CAFs; fold change > 2, P < 0.05. C) OGP was incubated alone (-) (top), or incubated with rhCD10 in the absence (middle) or presence of thiorphan (bottom). The levels of OGP were determined using HPLC. The peak of the OGP is indicated by a black arrow. Scale bar, 2 min. D,E) OGP was incubated with rhCD10 for 1 h. The structure of the hydrolyzed products was determined by HPLC-MS/MS. D) HPLC-MS/MS spectrum of hydrolyzed products. The fragments detected by MS/MS are indicated above the peptide sequence for C-terminal y ions and below the peptide sequence for N-terminal b ions. E) Peptide fragments in the hydrolyzed products were detected by HPLC-MS/MS. The horizontal lines indicate the peptide fragments. Thickness indicates the abundance of the fragment. Numbers above the lines indicate MS estimates of the amount of each fragment in arbitrary units. Arrows indicate cleavage sites. The active domain of OGP is marke
- Conjugate
- Near infrared dye
- Submitted by
- Invitrogen Antibodies (provider)
- Main image
- Experimental details
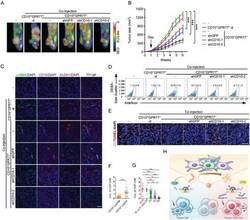
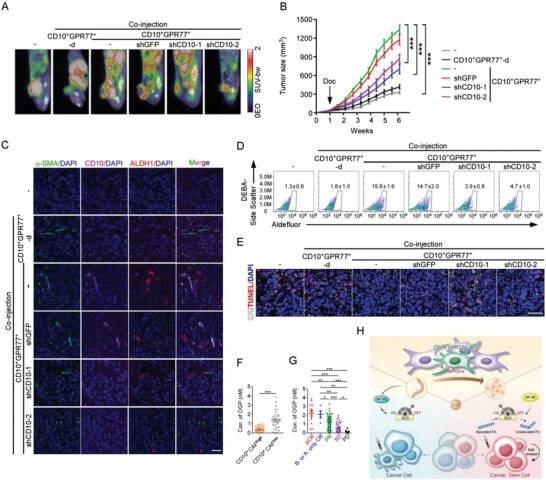
- Figure 8 Hydrolyzation of OGP by CD10 provides a potential therapeutic target for cancer treatments. A-E) MCF-7 cells alone (-) or with indicated CAFs were injected into fat-pads of 6-weeks-old NOD/SCID mice. Docetaxel was administrated when tumors were palpable. A) Representative images of xenograft growth monitored by PET-CT ( n = 6 per group). The circles indicate xenografts. B) Tumor growth curves ( n = 6 per group). Mean +- SEM, *** P < 0.001 by one-way ANOVA at week 6. C) Representative images of alpha -SMA, CD10, and ALDH1 immunofluorescence staining in the sections of xenografts ( n = 6 per group). Scale bar, 50 um. D) The proportions of ALDH1 + tumor cells isolated from harvested xenografts were determined by flow cytometry (mean +- SEM, n = 5 per group). E) Representative images of immunofluorescence staining for apoptotic tumor cells (TUNEL + CK + ) in the sections of xenografts ( n = 6 per group). F) OGP levels in tumor interstitial fluid of CD10 + CAF high ( n = 29) and CD10 + CAF low/- ( n = 35) human breast cancer samples were evaluated by ELISA (mean +- SEM). *** P < 0.001 by Mann-Whitney U tests. G) Biopsies from patients with different responses to neoadjuvant chemotherapy were obtained before treatments. OGP levels in tumor interstitial fluid were evaluated by ELISA. pCR, pathological complete response, no invasive carcinoma or ductal carcinoma in situ in breast or axilla, n = 13; B- or A-only pCR, pCR in breast or axilla only, n = 4; PR, partial remission,
- Conjugate
- Near infrared dye
- Submitted by
- Invitrogen Antibodies (provider)
- Main image

- Experimental details
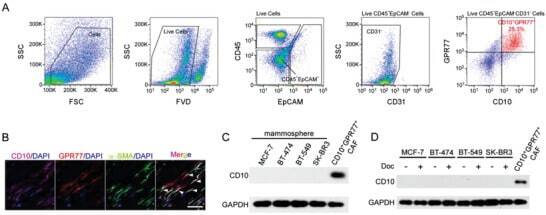
- Figure 1 CD10 expression in CAFs. A) Representative flow cytometry plot of gating strategy to identify the CD10 + GPR77 + CAF subset in breast cancer clinical samples. B) Representative images of CD10, GPR77, and alpha -SMA immunofluorescence staining in human breast cancer sections. White arrows indicate CD10 + GPR77 + CAFs. Scale bar, 50 um. C) CD10 levels in indicated mammospheres and CD10 + GPR77 + CAFs ( n = 3). D) CD10 levels in indicated tumor cells treated with docetaxel and CD10 + GPR77 + CAFs ( n = 3).
- Conjugate
- Near infrared dye
- Submitted by
- Invitrogen Antibodies (provider)
- Main image
- Experimental details
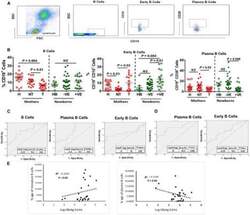
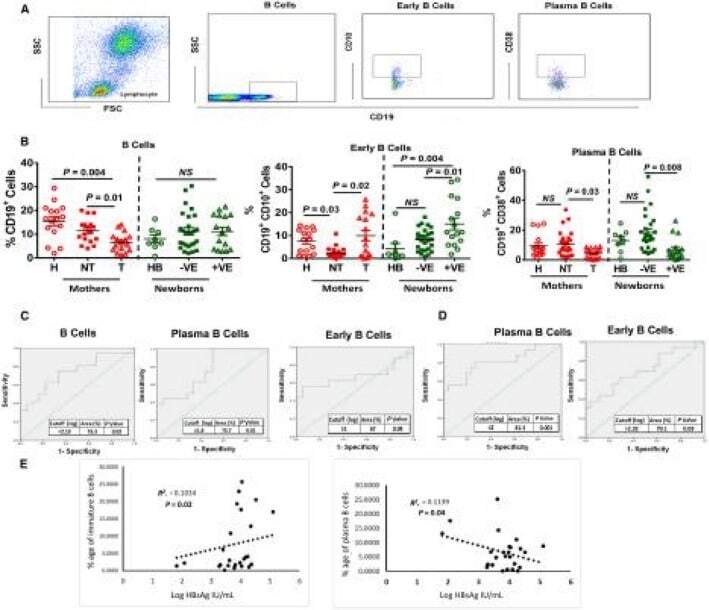
- Figure 3 Analysis of B-cell subsets in T and NT mothers. (A) Representative fluorescence-activated cell sorting plots showing the gating strategy of total, early, and plasma B cells on the basis of CD19, CD10, and CD38. (B) Dot plot graph showing the frequency of total B cells (CD19+), early B cells (CD19+CD10+), and plasma B cells (CD19+CD38+). Horizontal bars represent the mean +- SEM. P < 0.05 is considered significant. (C,D) Diagnostic value of B cells and their subsets for HBV vertical transmission. ROC analysis showing the cutoff, % area under the curve, and P value in mothers and their newborns. (E) Spearman correlation analysis among HBsAg and B-cell subsets.
- Conjugate
- Near infrared dye
- Submitted by
- Invitrogen Antibodies (provider)
- Main image
- Experimental details
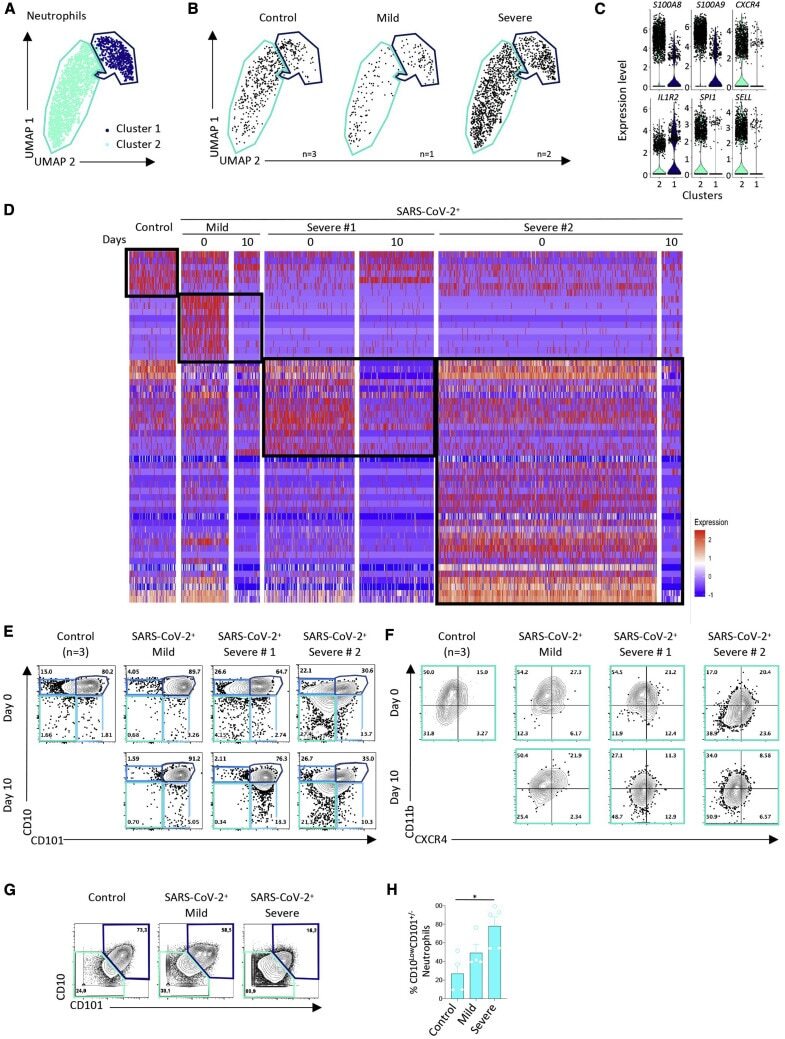
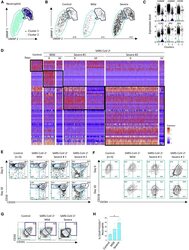
- Figure 4 Single-Cell Analysis of Neutrophils by scRNA-Seq, Spectral Flow Cytometry, and Mass Cytometry (A) UMAP profile of neutrophils in the 9 samples analyzed as described in Figure 2 A. (B) UMAP profile of neutrophils within the 3 controls and the mild and the two severe cases with the cluster gates overlaid. (C) Violin plots of expression of the indicated genes in two statistically defined neutrophil clusters. (D) Heatmap of DEGs in total neutrophils generated as described in Figure 3 B. (E and F) Spectral flow analysis of neutrophil subsets in pooled controls and each individual patient sample at day 0 and day 10, based on CD10 and CD101 expression (E) and CXCR4 and CD11b expression among CD10 Low CD101 - neutrophils (F) in the indicated samples (pooled controls). (G and H) Mass cytometry analysis of neutrophil subsets in 4 patients within each group (pooled data) as in Figures 3 F-3I, based on CD10 and CD101 expression (G) and the fraction of CD10 Low CD101 - neutrophils among total neutrophils in each sample within the 3 groups (H). Kruskal-Wallis test, * p < 0.05.
- Conjugate
- Near infrared dye