 Explore
 Validate
 Learn
Learn Western blot
Antibody data
- Antibody Data
- Antigen structure
- References [5]
- Comments [0]
- Validations
- Western blot [6]
- Immunocytochemistry [2]
- Immunohistochemistry [4]
- Other assay [15]
Submit
Validation data
Reference
Comment
Report error
- Product number
- PA5-27337 - Provider product page

- Provider
- Invitrogen Antibodies
- Product name
- HSC70 Polyclonal Antibody
- Antibody type
- Polyclonal
- Antigen
- Recombinant protein fragment
- Description
- Recommended positive controls: 293T, A431, HeLa, HepG2, Mouse brain. Predicted reactivity: Mouse (99%), Rat (99%), Xenopus laevis (91%), Pig (100%), Chicken (96%), Rhesus Monkey (100%), Bovine (96%). Store product as a concentrated solution. Centrifuge briefly prior to opening the vial.
- Reactivity
- Human, Mouse, Rat
- Host
- Rabbit
- Isotype
- IgG
- Vial size
- 100 µL
- Concentration
- 0.26 mg/mL
- Storage
- Store at 4°C short term. For long term storage, store at -20°C, avoiding freeze/thaw cycles.
Submitted references Cerebrospinal fluid exosomal miR-152-3p predicts the occurrence of subarachnoid haemorrhage and regulates vascular smooth muscle cell dysfunction.
Heat Shock Protein A6 Is Especially Involved in Enterovirus 71 Infection.
ARP-T1-associated Bazex-Dupré-Christol syndrome is an inherited basal cell cancer with ciliary defects characteristic of ciliopathies.
Autophagy regulates exosomal release of prions in neuronal cells.
A Non-enveloped Virus Hijacks Host Disaggregation Machinery to Translocate across the Endoplasmic Reticulum Membrane.
Li Y, Wu A, Dai W, Liu R, Jiang B, Zhou R
Folia neuropathologica 2022;60(2):185-194
Folia neuropathologica 2022;60(2):185-194
Heat Shock Protein A6 Is Especially Involved in Enterovirus 71 Infection.
Jia J, Liu G, Zhong J, Yan R, Song X, Zheng K, Ren Z, He Z, Zhu Q
Frontiers in microbiology 2022;13:865644
Frontiers in microbiology 2022;13:865644
ARP-T1-associated Bazex-Dupré-Christol syndrome is an inherited basal cell cancer with ciliary defects characteristic of ciliopathies.
Park HS, Papanastasi E, Blanchard G, Chiticariu E, Bachmann D, Plomann M, Morice-Picard F, Vabres P, Smahi A, Huber M, Pich C, Hohl D
Communications biology 2021 May 10;4(1):544
Communications biology 2021 May 10;4(1):544
Autophagy regulates exosomal release of prions in neuronal cells.
Abdulrahman BA, Abdelaziz DH, Schatzl HM
The Journal of biological chemistry 2018 Jun 8;293(23):8956-8968
The Journal of biological chemistry 2018 Jun 8;293(23):8956-8968
A Non-enveloped Virus Hijacks Host Disaggregation Machinery to Translocate across the Endoplasmic Reticulum Membrane.
Ravindran MS, Bagchi P, Inoue T, Tsai B
PLoS pathogens 2015 Aug;11(8):e1005086
PLoS pathogens 2015 Aug;11(8):e1005086
No comments: Submit comment
Supportive validation
- Submitted by
- Invitrogen Antibodies (provider)
- Main image

- Experimental details
- Western blot analysis of Hsc70 using 30 µg of H1299 lysate. Samples were loaded onto a 7.5% SDS-PAGE gel and probed with a Hsc70 polyclonal antibody (Product # PA5-27337) at a dilution of 1:10,000.

- Submitted by
- Invitrogen Antibodies (provider)
- Main image

- Experimental details
- Western blot analysis was performed on whole cell extracts (30 µg lysate) of HeLa (Lane 1), PC3 (Lane 2), CaCO-2 (Lane 3), Hep G2 (Lane 4), K-562 (Lane 5), Raji (Lane 6), SH-SY5Y (Lane 7), HL-60 (Lane 8) and A431 (Lane 9). The blot was probed with Anti-HSC70 Polyclonal Antibody (Product # PA5-27337, 1:1000 dilution) and detected by chemiluminescence using Goat anti-Rabbit IgG (H+L) Superclonal™ Secondary Antibody, HRP conjugate (Product # A27036, 0.25 µg/ml, 1:4000 dilution). A 70 kDa band corresponding to HSC70 was observed across all the cell lines tested.

- Submitted by
- Invitrogen Antibodies (provider)
- Main image

- Experimental details
- Western Blot analysis of HSC70 was performed by separating 30 µg of various whole cell extracts by 7.5% SDS-PAGE. Proteins were transferred to a membrane and probed with a HSC70 Polyclonal Antibody (Product # PA5-27337) at a dilution of 1:10000.

- Submitted by
- Invitrogen Antibodies (provider)
- Main image

- Experimental details
- Western Blot using HSC70 Polyclonal Antibody (Product # PA5-27337). Sample (50 µg of whole cell lysate). Lane A: Mouse brain. 7.5% SDS PAGE. HSC70 Polyclonal Antibody (Product # PA5-27337) diluted at 1:5,000. The HRP-conjugated anti-rabbit IgG antibody was used to detect the primary antibody.

- Submitted by
- Invitrogen Antibodies (provider)
- Main image

- Experimental details
- Western Blot using HSC70 Polyclonal Antibody (Product # PA5-27337). Various whole cell extracts (30 µg) were separated by 7.5% SDS-PAGE, and the membrane was blotted with HSC70 Polyclonal Antibody (Product # PA5-27337) diluted at 1:10,000. The HRP-conjugated anti-rabbit IgG antibody was used to detect the primary antibody.

- Submitted by
- Invitrogen Antibodies (provider)
- Main image

- Experimental details
- Knockdown of HSC70 was achieved by transfecting HeLa with HSC70 specific siRNAs (Silencer® select Product # s6987). Western blot analysis (Fig. a) was performed using whole cell extracts from the HSC70 knockdown cells (lane 3), non-specific scrambled siRNA transfected cells (lane 2) and untransfected cells (lane 1). The blot was probed with HSC70 Polyclonal Antibody (Product # PA5-27337, 1:2000 dilution) and Goat anti-Rabbit IgG (H+L) Superclonal™ Secondary Antibody, HRP conjugate (Product # A27036, 0.25µg/ml, 1:4000 dilution). Densitometric analysis of this western blot is shown in histogram (Fig. b). Decrease in signal upon siRNA mediated knock down confirms that antibody is specific to HSC70.

Supportive validation
- Submitted by
- Invitrogen Antibodies (provider)
- Main image

- Experimental details
- Immunofluorescent analysis of Hsc70 in methanol-fixed HeLa cells using a Hsc70 polyclonal antibody (Product # PA5-27337) at a 1:200 dilution.

- Submitted by
- Invitrogen Antibodies (provider)
- Main image

- Experimental details
- Immunofluorescence analysis of HSC70 was performed using 70% confluent log phase PC-3 cells. The cells were fixed with 4% paraformaldehyde for 10 minutes, permeabilized with 0.1% Triton™ X-100 for 15 minutes, and blocked with 1% BSA for 1 hour at room temperature. The cells were labeled with HSC70 Polyclonal Antibody (Product # PA5-27337) at 1:100 dilution in 0.1% BSA, incubated at 4 degree celsius overnight and then labeled with Goat anti-Rabbit IgG (H+L) Superclonal™ Secondary Antibody, Alexa Fluor® 488 conjugate (Product # A27034) at a dilution of 1:2000 for 45 minutes at room temperature (Panel a: green). Nuclei (Panel b: blue) were stained with SlowFade® Gold Antifade Mountant with DAPI (Product # S36938). F-actin (Panel c: red) was stained with Rhodamine Phalloidin (Product # R415, 1:300). Panel d represents the merged image showing nucleus and cytoplasm localization. Panel e represents control cells with no primary antibody to assess background. The images were captured at 60X magnification.

Supportive validation
- Submitted by
- Invitrogen Antibodies (provider)
- Main image

- Experimental details
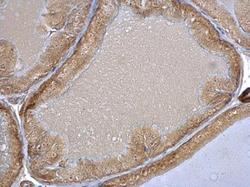
- HSC70 Polyclonal Antibody detects HSC70 protein at cytoplasm and nucleus by immunohistochemical analysis. Sample: Paraffin-embedded mouse testis. HSC70 stained by HSC70 Polyclonal Antibody (Product # PA5-27337) diluted at 1:500. Antigen Retrieval: Citrate buffer, pH 6.0, 15.

- Submitted by
- Invitrogen Antibodies (provider)
- Main image
- Experimental details
- HSC70 Polyclonal Antibody detects HSC70 protein at nucleolus on mouse prostate by immunohistochemical analysis. Sample: Paraffin-embedded mouse prostate. HSC70 Polyclonal Antibody (Product # PA5-27337) dilution: 1:500. Antigen Retrieval: EDTA based buffer, pH 8.0, 15 min.

- Submitted by
- Invitrogen Antibodies (provider)
- Main image
- Experimental details
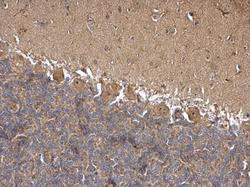
- HSC70 Polyclonal Antibody detects HSC70 protein at nucleolus on rat hind brain by immunohistochemical analysis. Sample: Paraffin-embedded rat hind brain. HSC70 Polyclonal Antibody (Product # PA5-27337) dilution: 1:500. Antigen Retrieval: EDTA based buffer, pH 8.0, 15 min.

- Submitted by
- Invitrogen Antibodies (provider)
- Main image
- Experimental details
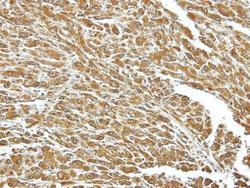
- Immunohistochemical analysis of paraffin-embedded U87 xenograft, using HSC70 (Product # PA5-27337) antibody at 1:100 dilution. Antigen Retrieval: EDTA based buffer, pH 8.0, 15 min.

Supportive validation
- Submitted by
- Invitrogen Antibodies (provider)
- Main image

- Experimental details
- NULL

- Submitted by
- Invitrogen Antibodies (provider)
- Main image

- Experimental details
- NULL

- Submitted by
- Invitrogen Antibodies (provider)
- Main image

- Experimental details
- NULL

- Submitted by
- Invitrogen Antibodies (provider)
- Main image

- Experimental details
- Fig 2 Hsp105 is essential for polyomavirus infection. A . CV-1 cells were transfected with a ctrl siRNA, or Hsp105 siRNA #1 or #2 for 24 h, and the resulting WCE were immunoblotted with the indicated antibodies (top panel) or RT-PCR analysis was performed to observe the XBP1 splicing (bottom panel). Cells treated with DTT were used as a positive control. B . Cells in (A) were infected with SV40 (MOI ~0.5) for 24 h, fixed, and immunostained against SV40 large T antigen (TAg). Infection was scored using immunofluorescence microscopy (counting >1000 cells for each condition). Data are normalized to the ctrl siRNA. Values represent the mean +- SD (n>=3). C . As in (B), except cells were infected with BKV for 40 h before immunostaining for BKV TAg. D . Multiple sequence alignment of Hsp70 and Hsp110 family proteins from yeast and humans. Only the relevant sequences are shown. The highlighted regions indicate the amino acid(s) that were altered to generate the Hsp105 mutants (see Methods ). E . The indicated F-tagged proteins were purified from 293T cells, and their purity analyzed by SDS-PAGE followed by staining with Brilliant Blue R250. Hsc70 was obtained from commercial source (see Methods ). The asterisk indicates an antibody heavy chain band. F . Purified proteins in (E) were incubated with ATP conjugated-agarose beads. Unbound and bound proteins were analyzed by immunoblotting using a FLAG antibody. G . CV-1 cells expressing the indicated F-tagged proteins were immunoprecipi

- Submitted by
- Invitrogen Antibodies (provider)
- Main image

- Experimental details
- Fig 1 The cytosolic Hsp105 interacts with the ER membrane J-protein B14 A . Expression of B14-3xF and endogenous B14 in Flp-In 293 T-Rex cell lysates were analyzed by immunoblotting against B14. A corresponding molecular weight marker in kDa is shown on the left. B . B14-3xF was immunopurified from Flp-In 293 T-Rex cells infected with SV40 MOI ~50 ('+') or uninfected ('-'). Bound proteins were eluted with 3x FLAG peptide, and the samples separated by SDS-PAGE followed by silver staining. Bands (indicated on the right) were excised and subjected to mass spectrometry analysis. Protein identities of the bands are listed on the right side of the gel. C . Samples in (B) were immunoblotted with the indicated antibodies. Uninfected HEK 293T cells not expressing B14-3xF were used as a control. D . CV-1 cells were cross-linked with DSP, lysed, the endogenous B14 immunoprecipitated, and the precipitated samples subjected to immunoblotting using the indicated antibodies. Where indicated, cells were infected with SV40. E . Cells expressing F-B14 or F-B14 H136Q were cross-linked, lysed, and the FLAG-tagged proteins immunoprecipitated followed by immunoblotting using the indicated antibodies. F . CV-1 cells treated with a control (ctrl) or Hsc70 siRNA were transfected with Hsp105 WT-F, and the FLAG-tagged protein immunoprecipitated followed by immunoblotting using the indicated antibodies. G . As in F, except SGTA siRNA was used. H . The S-tagged protein in CV-1 cells w

- Submitted by
- Invitrogen Antibodies (provider)
- Main image

- Experimental details
- Fig 5 Hsp105 engages ER membrane-penetrating SV40 and promotes disassembly of the virus. A . The indicated purified protein in Fig 2E was incubated with DTT/EGTA-treated SV40. SV40 was immunoprecipitated from the sample and analyzed by immunoblotting using the indicated antibodies. B . CV-1 cells expressing the indicated S-tagged protein were infected with SV40 (MOI ~10). 12 hpi, S-tagged proteins affinity purified from WCE and immunoblot was performed with the indicated antibodies. C . As in (B), except cells were infected with SV40 for the indicated time. D . Cells expressing Hsp105 WT-S were infected with SV40 for 12 h, cross-linked with DSP, and fractionated to generate a cytosol and membrane fraction. Hsp105 WT-S was affinity isolated from each fraction, and the samples analyzed by immunoblotting with the indicated antibodies. E . As in (B), except the indicated F-tagged constructs were expressed in the cells. F . Triton X-100 extracted, ER-localized SV40 was incubated with the indicated purified protein(s), and subjected to discontinuous sucrose gradient centrifugation. Fractions were collected (as shown on the left side of the figure) from the top of the gradient and analyzed for the presence of SV40 by immunoblotting using VP1 antibodies.

- Submitted by
- Invitrogen Antibodies (provider)
- Main image

- Experimental details
- Fig. 3 ARP-T1 interacts with proteins involved in ciliary machinery. a , b HeLa ( a ) and hTERT-RPE1 ( b ) cells were transduced with lentiviral vectors, empty vector (V), ACTRT1 mutant (M) and ACTRT1 WT (WT), and immunoprecipitated (IP) with anti-FLAG monoclonal antibody M2-conjugated agarose, and analyzed by immunoblot with indicated antisera. c Immunofluorescence stainings of ARP-T1, acetylated-tubulin and rootletin in 35 days of serum-starved ARPE19 cells. Nuclei are stained with DAPI. Scale bar, 5 um. Higher magnifications of the boxed area are shown on right three panels. Scale bar, 1 um. d Immunofluorescence staining of ARP-T1, gamma-tubulin, EHD4, and septin 2 in 48 h of serum-starved hTERT-RPE1 cells. Nuclei are stained with DAPI. Scale bar, 5 um. Higher magnifications of the boxed area are shown on the right three panels. Scale bar, 1 um.

- Submitted by
- Invitrogen Antibodies (provider)
- Main image
- Experimental details
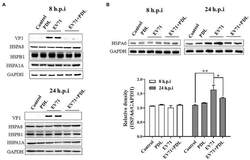
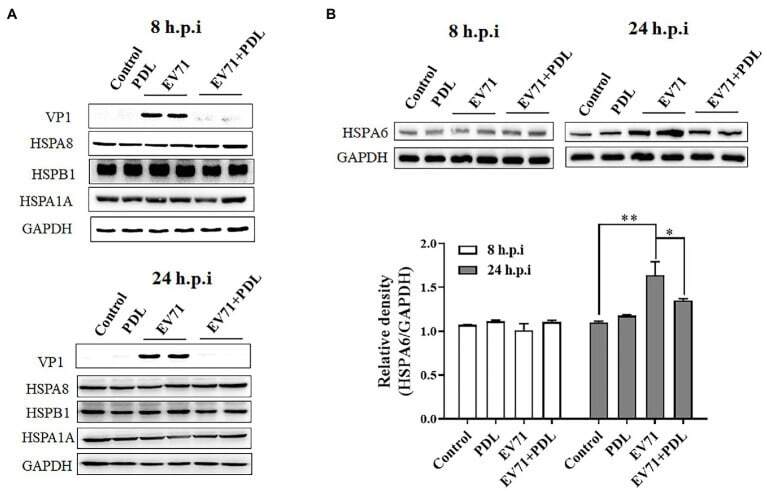
- Figure 2 EV71 infection specially upregulates HSPA6 protein expression. (A) Western blotting analysis of HSPA1A, HSPA8, HSPB1, and viral VP1 expression in RD cells infected with EV71 for 8 or 24 h. (B) Western blotting analysis of HSPA6 expression in RD cells infected with EV71 for 8 or 24 h. The relative expression of HSPA6 was quantitatively analyzed based on the bands' intensities from the Western blotting analysis. PDL (10 muM) here was used as anti-EV71 control ( * p < 0.05, ** p < 0.01).
- Submitted by
- Invitrogen Antibodies (provider)
- Main image

- Experimental details
- Figure 3. Autophagy stimulation decreases exosome secretion and consequently impacts exosomal PrP Sc in ScCAD5 neuronal cells. A and B , Western blotting of cell lysate and exosomes from ScCAD5 cells treated with 500 n m of rapamycin ( Rapa ) or solvent only (DMSO). HSC70 and flotillin-1 ( Flot-1 ) were used as exosome markers. PrP (-/+ PK) was probed with mAb 4H11. C and D , densitometric analysis for either total PrP or PrP Sc , respectively, from ScCAD5 cell lysate normalized with actin (+- S.D.) after treatment with 500 n m rapamycin or DMSO ( n = 3 experiments). E and H , densitometric analysis for exosomal HSC70 and flotillin-1, respectively, normalized with actin in the corresponding cell lysate (+- S.D.) after treatment with rapamycin or DMSO ( n = 3 experiments). *, p < 0.05; **, p < 0.01. F and G , densitometric analysis for either total PrP or PrP Sc , respectively, from ScCAD5 exosomes normalized with actin in the corresponding cell lysate (+- S.D.) after treatment with rapamycin or DMSO ( n = 3 experiments). **, p < 0.01. *, p < 0.05. I , lactate dehydrogenase ( LDH ) cytotoxicity assay (OD = 490 nm). Supernatant from ScCAD cells treated with rapamycin or DMSO for 6 days was tested to detect the level of LDH (+- S.D.; n = 5 replicates). ***, p < 0.001. J , Western blotting of cell lysate of ScCAD5 cells treated with vehicle only (DMSO), 500 n m of rapamycin, 100 n m of bafilomycin A1 ( BA1 ), or rapamycin + bafilomycin A1 for 4 h. LC3 was used to measure the auto

- Submitted by
- Invitrogen Antibodies (provider)
- Main image

- Experimental details
- Figure 4. Autophagy stimulation mitigates exosome secretion and significantly decreases exosomal PrP Sc in ScN2a cells. A and B , Western blotting of cell lysate and exosomes from ScN2a cells treated with 500 n m of rapamycin ( Rapa ) or solvent only (DMSO) for 6 days. HSC70 and flotillin-1 ( Flot-1 ) were used as exosome markers. PrP (-/+ PK) was probed with mAb 4H11. Actin was used as a loading control for cell lysate. C and D , densitometric analysis for either total PrP or PrP Sc , respectively, from ScN2a cell lysate normalized with actin (+- S.D.) after treatment with rapamycin or DMSO ( n = 3 experiments). E and H , densitometric analysis for exosomal HSC70 and flotillin-1, respectively, normalized with actin in the corresponding cell lysate (+- S.D.; n = 3 experiments). ***, p < 0.001; **, p < 0.01. F and G , densitometric analysis for either total PrP or PrP Sc , respectively, from ScN2a exosomes normalized with actin in the corresponding cell lysate (+- S.D.; n = 3 experiments). ***, p < 0.001; *, p < 0.05. I , lactate dehydrogenase ( LDH ) cytotoxicity assay (OD = 490 nm). Supernatant from ScN2a cells treated with 500 n m rapamycin or DMSO for 6 days was tested to detect the level of LDH (+- S.D.; n = 8 replicates). **, p < 0.01. J , Western blotting of cell lysate of ScN2a cells treated with vehicle only (DMSO), 500 n m of rapamycin, 100 n m of bafilomycin A1 ( BA1 ), or rapamycin + bafilomycin A1 for 4 h. LC3 was used to measure the autophagic flux, and actin was

- Submitted by
- Invitrogen Antibodies (provider)
- Main image

- Experimental details
- Figure 1. Characterization of exosomes isolated from CAD5/ScCAD5 neuronal cells. A , representative TEM of exosomes isolated from CAD5 culture medium reveals a homogenous population of vesicles of 100 nm in diameter characteristic for exosomes (some denoted by black arrows ). Scale bar , 100 nm. B , immunoblot of ScCAD5 cell lysate and exosome preparations probed for total PrP (-PK) and PrP Sc (+PK) (anti-PrP mAb 4H11). Actin was used as loading control. Flotillin-1 ( Flot-1 ) was used as an exosome marker. C , RT-QuIC of CAD5 exosome, ScCAD5 exosome, ScCAD5 cell lysate, 10% brain homogenate from terminally prion-sick mice (22L) or left unseeded (negative control). The average increase of thioflavin-T fluorescence of replicate wells is plotted as a function of time. The y axis represents RFU, and the x axis represents time (h). D , immunoblot analysis of ScCAD5 cell lysate and exosomes isolated from ScCAD5 culture medium. Exosome preparation is positive for exosome markers Alix, HSC70, Tsg-101, flotillin-1, CD63, and CD9 and negative for mitochondrial marker Bcl2, Golgi marker GM130, and nuclear marker nucleoporin p62. Actin was used loading control. E , ScCAD5 exosome pellet loaded on the top of a continuous sucrose gradient and ultracentrifuged. Fractions were analyzed by Western blotting and probed for HSC70, flotillin-1, and mAb 4H11 to detect PrP/PrP Sc . Lanes 9 and 10 represent cell lysate before and after PK digestion, respectively.

- Submitted by
- Invitrogen Antibodies (provider)
- Main image

- Experimental details
- Figure 2. Characterization of exosomes isolated from N2a/ScN2a cells. A , representative TEM of exosomes isolated from N2a culture medium shows a population of vesicles of 100 nm in diameter (some denoted by black arrows ). Scale bar , 100 nm. B , immunoblot of ScN2a cell lysate and exosome preparations probed for total PrP (-PK) and PrP Sc (+PK) (anti-PrP mAb 4H11). Flotillin-1 ( Flot-1 ) was used as exosome marker. Actin was used as loading control. C , RT-QuIC of N2a exosome, ScN2a exosome, ScN2a cell lysate, and 10% brain homogenate from terminally prion-sick mice (22L) or left unseeded (negative control). The average increase of thioflavin-T fluorescence of replicate wells is plotted as a function of time. The y axis represents RFU, and the x axis represents time in hours. D , immunoblot analysis of ScN2a cell lysate and exosomes isolated from ScN2a cell culture medium. Exosome preparation is positive for exosome markers Alix, HSC70, Tsg-101, flotillin-1, CD63, and CD9 and negative for mitochondrial marker Bcl2, Golgi marker GM130, and nuclear marker nucleoporin p62. Actin was used as loading control. E , ScN2a exosome pallet loaded on the top of a continuous sucrose gradient and ultracentrifuged. The fractions were analyzed by Western blotting and probed for HSC70, flotillin-1, and mAb 4H11 to detect total PrP and PrP Sc . Lanes 9 and 10 are cell lysate before and after PK digestion, respectively.

- Submitted by
- Invitrogen Antibodies (provider)
- Main image

- Experimental details
- Figure 5. Inhibition of autophagy increases exosome release and exosomal PrP Sc in ScCAD5 cells. A and B , Western blotting of cell lysate and exosomes from ScCAD5 cells, respectively, treated with 4 n m of wortmannin ( Wort ) for 48 h or solvent only treated (DMSO). HSC70 and flotillin-1 ( Flot-1 ) were used as exosome markers. Actin was used as loading control for cell lysate. PrP (-/+ PK) was probed with mAb 4H11. C and D , densitometric analysis for either total PrP or PrP Sc , respectively, from ScCAD5 cell lysate normalized with actin (+- S.D.) after treatment with 4 n m of wortmannin or DMSO ( n = 3 experiments). E and H , densitometric analysis for exosomal HSC70 and flotillin-1, respectively, normalized with actin in the corresponding cell lysate (+- S.D.; n = 3 experiments). F and G , densitometric analysis for either total PrP or PrP Sc , respectively, from ScCAD5 exosomes normalized with actin in the corresponding cell lysate (+- S.D.; n = 3 experiments). **, p < 0.01. I , XTT viability assay. ScCAD5 cells were treated with 4 n m wortmannin or DMSO for 48 h; then cell viability was detected based on metabolic activity (+- S.D.; n = 7 replicates). J , upper panel , Western blotting of cell lysate of ScCAD5 cells treated with vehicle only (DMSO) or 4 n m of wortmannin for 4 h. Lower panel , Western blotting of cell lysate of ScCAD5 cells treated with vehicle only (DMSO), 4 n m of wortmannin, or wortmannin with bafilomycin A1 ( Wort +

- Submitted by
- Invitrogen Antibodies (provider)
- Main image

- Experimental details
- Figure 6. Knockout of Atg5 increases exosome release and exosomal PrP Sc in ScN2a cells. A and B , Western blotting of cell lysate and exosomes from ScN2a cells respectively, either WT or KO for Atg5. HSC70 was used as exosomal markers. Total PrP and PrP Sc were detected using mAb 4H11 antibody. C and D , densitometric analysis for either total PrP or PrP Sc , respectively, from WT or KO ScN2a cell lysate normalized with actin (+- S.D.; n = 3 experiments). E , densitometric analysis for exosomal HSC70 normalized with actin in the corresponding cell lysate (+- S.D.; n = 3 experiments). ***, p < 0.001. F and G , densitometric analysis for either total PrP or PrP Sc , respectively, from WT or KO ScN2a exosomes normalized with actin in the corresponding cell lysate (+- S.D.; n = 3 experiments). ***, p < 0.001; *, p < 0.05. H , immunoblot showing complete knockout of Atg5 compared with WT ScN2a cells. Actin was used as loading control. Atg5 KO resulted in complete absence of LC3-II, confirming disruption of autophagy machinery. I , XTT viability assay. (OD = 490 nm). The cells were cultured for 48 h for XTT viability assay ( n = 7 replicates). J and K , RT-QuIC for WT or KO ScN2a cells.

- Submitted by
- Invitrogen Antibodies (provider)
- Main image

- Experimental details
- Figure 7. ScCAD5 cells release more exosomes and PrP Sc compared with ScN2a cells, which is inversely correlated to autophagy competence. Comparable numbers of ScN2a and ScCAD5 cells were used in this experiment. A and B , cell lysate and exosomes isolated from conditioned media from ScCAD5 and ScN2a cells were analyzed in immunoblot for HSC70 and PrP. C and D , densitometric analysis for either total PrP or PrP Sc respectively from ScCAD5 or ScN2a cell lysate normalized with actin (+- S.D.; n = 3 experiments). E , densitometric analysis for exosomal HSC70 normalized with actin in the corresponding cell lysate (+- S.D.; n = 3 experiments). *, p < 0.05. F and G , densitometric analysis for either total PrP or PrP Sc , respectively, from ScCAD5 or ScN2a exosomes normalized with actin in the corresponding cell lysate (+- S.D.; n = 3 experiments). *, p < 0.05. H , immunoblot comparing PrP C levels between CAD5 and N2a cells using mAb 4H11. I , immunoblot comparing the level of LC3-I to LC3-II between ScN2a and ScCAD5 cells with and without treatment with bafilomycin A1 ( BA1 ) for 4 h. Actin was used as a loading control. J , densitometric analysis for LC3-II protein levels normalized with actin (+- S.D.; n = 4 replicates). *, p < 0.05, **, p < 0.01.
