 Explore
 Validate
 Learn
Learn Western blot
Antibody data
- Antibody Data
- Antigen structure
- References [3]
- Comments [0]
- Validations
- Western blot [2]
- Immunocytochemistry [1]
- Other assay [4]
Submit
Validation data
Reference
Comment
Report error
- Product number
- 711443 - Provider product page

- Provider
- Invitrogen Antibodies
- Product name
- Calbindin D28K Recombinant Polyclonal Antibody (15HCLC)
- Antibody type
- Polyclonal
- Antigen
- Other
- Reactivity
- Human, Mouse, Rat
- Host
- Rabbit
- Isotype
- IgG
- Antibody clone number
- 15HCLC
- Vial size
- 100 µg
- Concentration
- 0.5 mg/mL
- Storage
- Store at 4°C short term. For long term storage, store at -20°C, avoiding freeze/thaw cycles.
Submitted references Fronto-temporal dementia risk gene TMEM106B has opposing effects in different lysosomal storage disorders.
Increased Endocytosis of Cadmium-Metallothionein through the 24p3 Receptor in an In Vivo Model with Reduced Proximal Tubular Activity.
Cell-Specific Transcriptional Responses to Heat Shock in the Mouse Utricle Epithelium.
Perez-Canamas A, Takahashi H, Lindborg JA, Strittmatter SM
Brain communications 2021;3(1):fcaa200
Brain communications 2021;3(1):fcaa200
Increased Endocytosis of Cadmium-Metallothionein through the 24p3 Receptor in an In Vivo Model with Reduced Proximal Tubular Activity.
Zavala-Guevara IP, Ortega-Romero MS, Narváez-Morales J, Jacobo-Estrada TL, Lee WK, Arreola-Mendoza L, Thévenod F, Barbier OC
International journal of molecular sciences 2021 Jul 6;22(14)
International journal of molecular sciences 2021 Jul 6;22(14)
Cell-Specific Transcriptional Responses to Heat Shock in the Mouse Utricle Epithelium.
Sadler E, Ryals MM, May LA, Martin D, Welsh N, Boger ET, Morell RJ, Hertzano R, Cunningham LL
Frontiers in cellular neuroscience 2020;14:123
Frontiers in cellular neuroscience 2020;14:123
No comments: Submit comment
Supportive validation
- Submitted by
- Invitrogen Antibodies (provider)
- Main image

- Experimental details
- Western blot analysis was performed on Tissue extracts (30 µg lysate) of Mouse Brain (Lane 1), Rat Brain (Lane 2), Mouse Kidney (Lane 3) and Rat Kidney (Lane 4). The blots were probed with Anti-CalbindinD Recombinant Rabbit Polyclonal Antibody (Product # 711443, 1-2 µg/mL) and detected by chemiluminescence using Goat anti-Rabbit IgG (H+L) Superclonal Secondary Antibody, HRP conjugate (Product # A27036, 0.4 µg/mL, 1:2500 dilution). A 30 kDa band corresponding to CalbindinD was observed across the tissues tested. Known quantity of protein samples were electrophoresed using Novex®NuPAGE®4-12% Bis-Tris gel (Product # NP0321BOX), XCell SureLock Electrophoresis System (Product # EI0002) and Novex® Sharp Pre-Stained Protein Standard (Product # LC5800). Resolved proteins were then transferred onto a nitrocellulose membrane with iBlot® Dry Blotting System (Product # IB21001). The membrane was probed with the relevant primary and secondary Antibody following blocking with 5% skimmed milk. Chemiluminescent detection was performed using Pierce™ ECL Western blotting Substrate (Product # 32106).

- Submitted by
- Invitrogen Antibodies (provider)
- Main image

- Experimental details
- Western blot was performed using Anti- Calbindin D28K Recombinant Polyclonal Antibody (Product # 711443) and a 30 kDa band corresponding to Calbindin D28K was observed across the tissues tested. Tissues extracts (30 µg lysate) of Mouse Heart (Lane 1), Rat Heart (Lane 2), Mouse Brain (Lane 3), Rat Brain (Lane 4), Mouse Kidney (Lane 5) and Rat Kidney (Lane 6) were electrophoresed using NuPAGE™ 4-12% Bis-Tris Protein Gel (Product # NP0322BOX). Resolved proteins were then transferred onto a nitrocellulose membrane (Product # IB23001) by iBlot® 2 Dry Blotting System (Product # IB21001). The blot was probed with the primary antibody (2 µg/ml) and detected by chemiluminescence with Goat anti-Rabbit IgG (H+L), Superclonal™ Recombinant Secondary Antibody, HRP (Product # A27036, 0.25 µg/ml, 1:10000 dilution) using the iBright FL 1000 (Product # A32752). Chemiluminescent detection was performed using Novex® ECL Chemiluminescent Substrate Reagent Kit (Product # WP20005).

Supportive validation
- Submitted by
- Invitrogen Antibodies (provider)
- Main image
- Experimental details
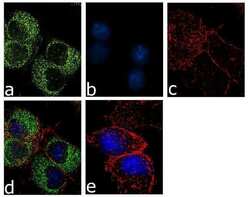
- For immunofluorescence analysis, PC-12 cells were fixed and permeabilized for detection of endogenous Calbindin D using Anti- Calbindin D Recombinant Rabbit Polyclonal Antibody (Product # 711443, 2 µg/mL) and labeled with Goat anti-Rabbit IgG (H+L) Superclonal Secondary Antibody, Alexa Fluor® 488 conjugate (Product # A27034, 1:2000). Panel a) shows representative cells that were stained for detection and localization of Calbindin D protein (green), Panel b) is stained for nuclei (blue) using SlowFade® Gold Antifade Mountant with DAPI (Product # S36938). Panel c) represents cytoskeletal F-actin staining using Alexa Fluor® 555 Rhodamine Phalloidin (Product # R415, 1:300). Panel d) is a composite image of Panels a, b and c clearly demonstrating cytoplasmic localization of Calbindin D. Panel e) represents control cells with no primary antibody to assess background. The images were captured at 60X magnification.

Supportive validation
- Submitted by
- Invitrogen Antibodies (provider)
- Main image

- Experimental details
- Figure 5 Identification of previously-known and newly-validated cell-type-specific transcripts. (A) Gfi1-Cre RiboTag IPs are enriched for canonical HC markers, and GLAST-CreER RiboTag IPs are enriched for SC markers. Scatterplot of Log 2 FC values vs. normalized transcript abundance from the comparison of the Gfi1-Cre IP to the GLAST-CreER IP in the control (no heat shock) condition. Some known HC and SC markers are labeled (yellow) as well as transcripts selected for validation (green). (B-L) Immunohistochemical staining for the four targets selected in (A) . Rbm24 (green, C ) and Calb1 (green, F ) staining is observed in HCs. Myo7a (white) was used as a known HC marker (B,E) with merged images (D,G) . Rbp1 (green, I ) and Tspan8 (green, L ) are observed in SCs. Myo7a (white) was used as a known HC marker (H,K) with merged images (J,M) . Images are 900 mum 2 composites from confocal images taken at 63x magnification. Scale bar (M) represents 10 mum and applies to all panels.

- Submitted by
- Invitrogen Antibodies (provider)
- Main image

- Experimental details
- Figure 5 TMEM106B deletion accelerates neuronal death in Ppt1-/- mice, a model of infantile neuronal ceroid lipofuscinosis. ( A ) Representative images of anterior (I-V), mid (VI-VIII) and posterior (IX,X) cerebellar lobes stained with anti-calbindin D28k antibody in 5-month-old WT, Ppt1-/- , Tmem106b-/- and Ppt1-/- ; Tmem106b-/- mice. Scale bars = 200 mum. ( B ) Graph shows mean +- SEM of number of calbindin-positive cells in the different cerebellar regions. n = 4-9 mice per group. ( C ) Representative images of Purkinje cells in 5-month-old WT, Ppt1-/- , Tmem106b-/- and Ppt1-/- ; Tmem106b-/- mice stained with anti-Calbindin D28k and Lamp1 antibodies. Scale bar = 10 mum. n = 4-9 mice per group. ( D ) Graphs show mean +- SEM of Lamp1 area, number of particles and particle size in Purkinje cells. n = 4-7 mice per group. ( E ) Representative images of cerebral cortex in 5-month-old WT, Ppt1-/- , Tmem106b-/- and Ppt1-/- ; Tmem106b-/- mice stained with anti-NeuN antibody. Scale bar = 100 mum. ( F ) Graph shows mean +- SEM of NeuN+ cells per area in the cortex. n = 5-12 mice per group. ( G ) Representative images of hippocampus (CA1) in 5-month-old WT, Ppt1-/- , Tmem106b-/- and Ppt1-/- ; Tmem106b-/- mice stained with anti-NeuN antibody. Scale bar = 20 mum. ( H ) Graph shows mean +- SEM of NeuN+ cells per area in the hippocampus (CA1). n = 5-12 mice per group

- Submitted by
- Invitrogen Antibodies (provider)
- Main image

- Experimental details
- Figure 4 Calbindin-D protein levels in renal tissue decrease after GM administration indicating that DT injury occurs at GM doses >10 mg/kg. ( A ) Representative blot of Calbindin-D and beta-actin from whole renal tissue of untreated and GM-exposed mice; ( B ) Bar graph shows means +- SD of normalized densitometries. n = 5 animals per dose. One-way ANOVA was performed, p = 0.0733. Post-hoc: Dunn test. * p < 0.05.

- Submitted by
- Invitrogen Antibodies (provider)
- Main image

- Experimental details
- Figure 8 GM-induced PT injury is associated with increased 24p3R expression in DT. ( A ) Western blots of F1 (DT enriched) and F4 fractions (PT enriched) obtained after ultracentrifugation of tubules on a Percoll gradient. Dipeptidyl peptidase IV: PT marker; Calbindin-D: DT marker; ( B ) Representative blots of 24p3R and beta-actin in DT enriched F1 fraction of untreated and GM-exposed mice (10 mg/kg). The bar chart shows means +- SD of normalized densitometry values. Student's t -Test was performed. ** p < 0.05. n = 3. Each experiment was performed with 10 animals to obtain a pool of DT; ( C ) Representative micrographs showing the expression of 24p3R in renal tissue of control and GM-treated mice. Arrows show expression of 24p3R. Nuclei are stained with DAPI (blue). Scale Bars = 50 um ( left ) and 20 um ( right ).
