Explore
 Validate
 Learn
Learn Western blot
 ELISA
ELISA Immunohistochemistry
Antibody data
- Antibody Data
- Antigen structure
- References [6]
- Comments [0]
- Validations
- Immunohistochemistry [1]
- Flow cytometry [1]
- Other assay [8]
Submit
Validation data
Reference
Comment
Report error
- Product number
- 37-0500 - Provider product page

- Provider
- Invitrogen Antibodies
- Product name
- TSC2 Monoclonal Antibody (3G9D9)
- Antibody type
- Monoclonal
- Antigen
- Recombinant full-length protein
- Reactivity
- Human
- Host
- Mouse
- Isotype
- IgG
- Antibody clone number
- 3G9D9
- Vial size
- 200 μL
- Concentration
- 0.5 mg/mL
- Storage
- -20°C
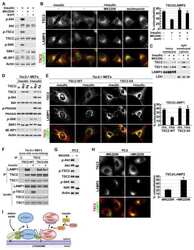
Submitted references G3BPs tether the TSC complex to lysosomes and suppress mTORC1 signaling.
The splicing factor U2AF1 contributes to cancer progression through a noncanonical role in translation regulation.
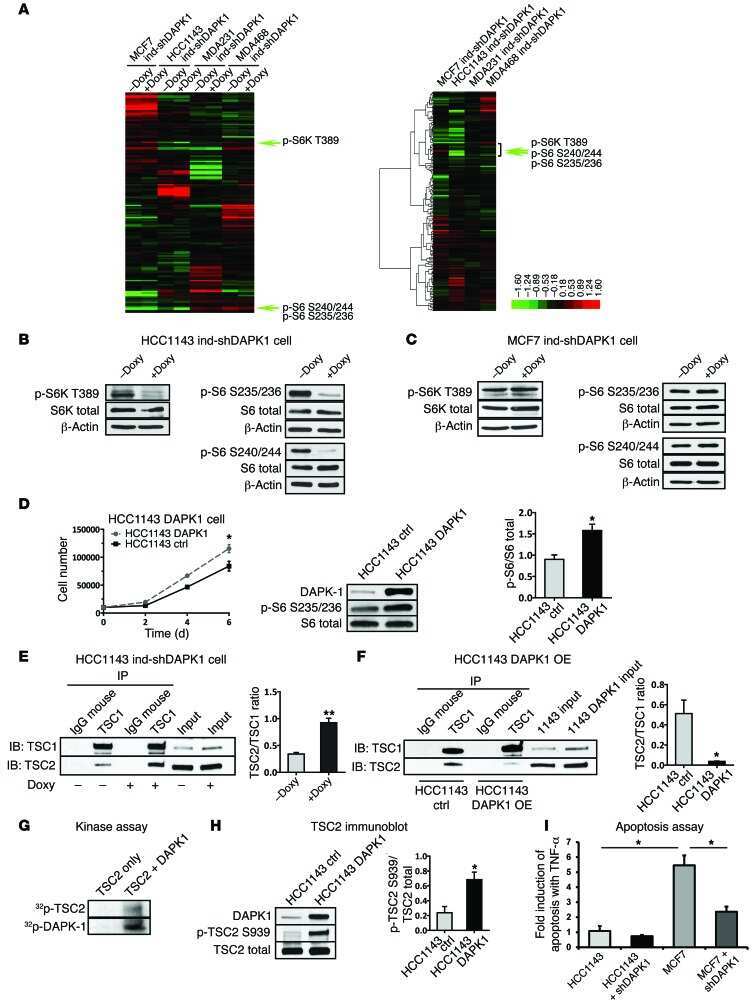
Death-associated protein kinase 1 promotes growth of p53-mutant cancers.
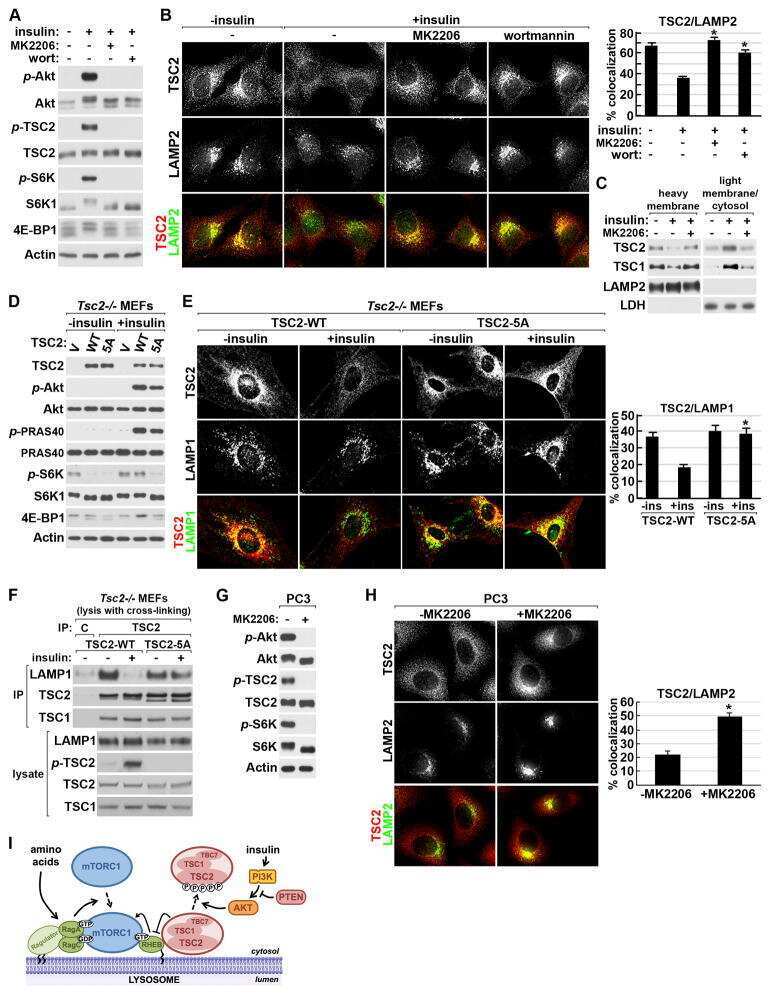
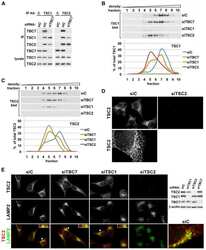
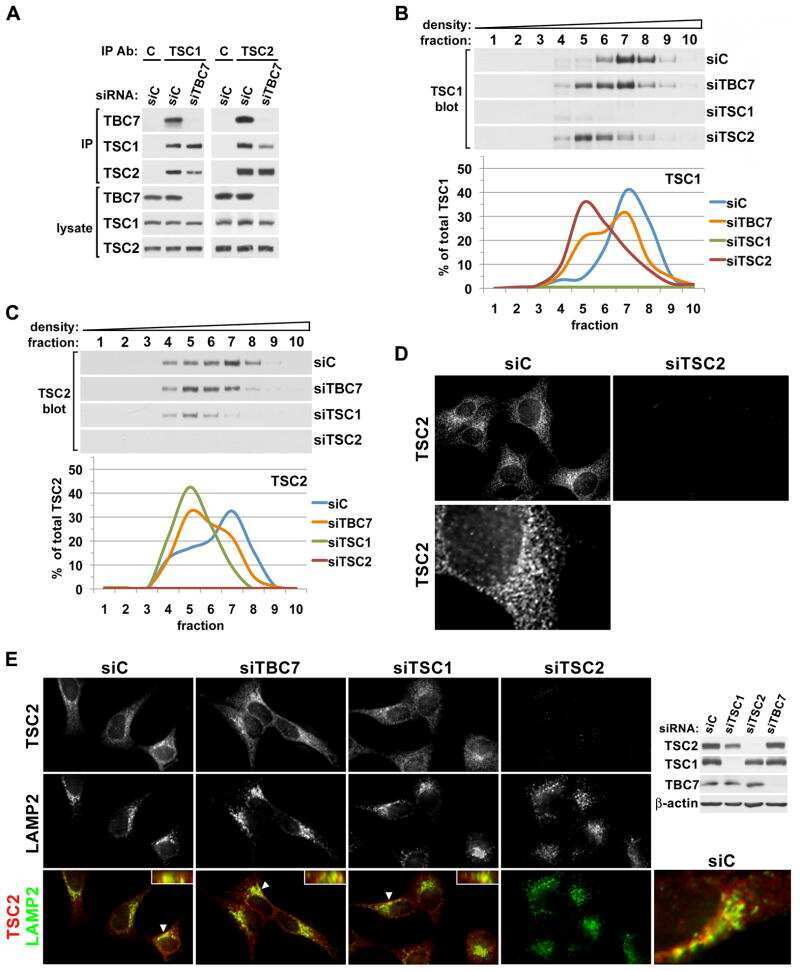
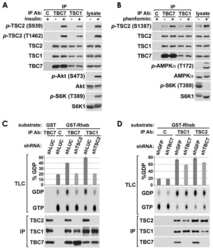
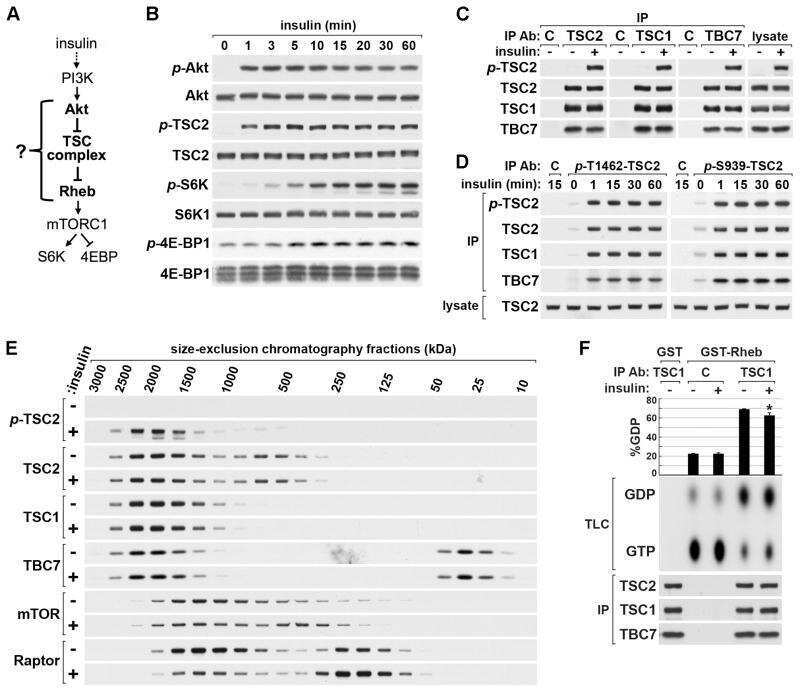
Spatial control of the TSC complex integrates insulin and nutrient regulation of mTORC1 at the lysosome.
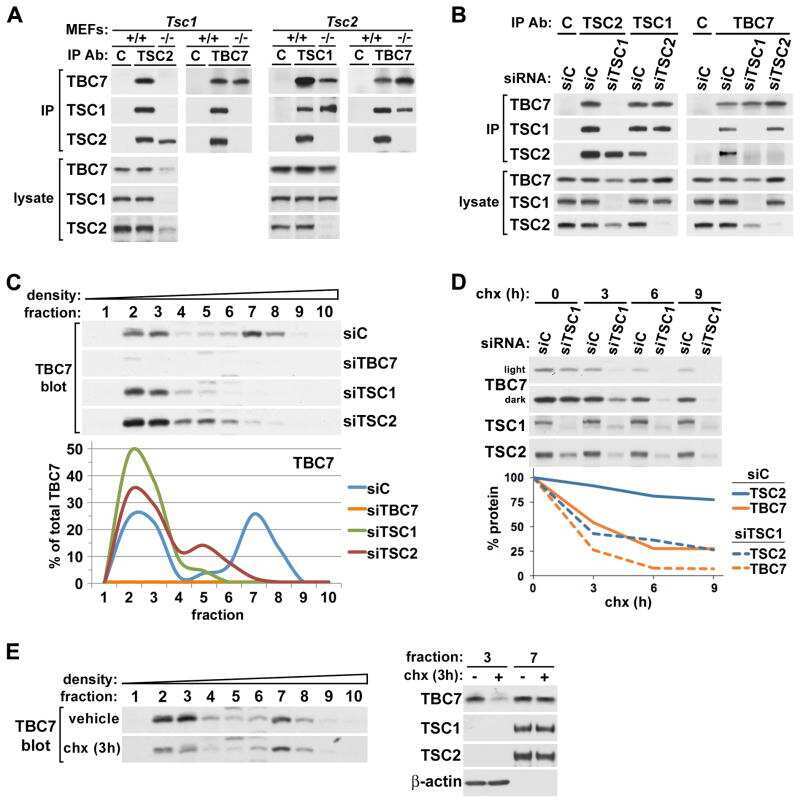
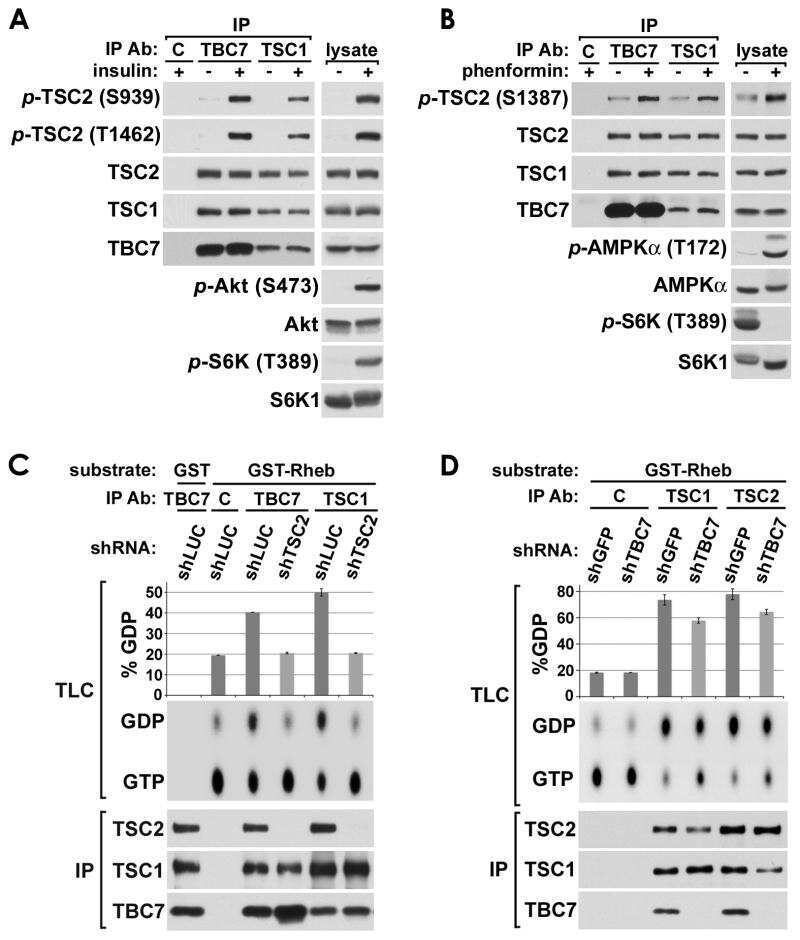
TBC1D7 is a third subunit of the TSC1-TSC2 complex upstream of mTORC1.
Clinicopathological and immunohistochemical findings in an autopsy case of tuberous sclerosis complex.
Prentzell MT, Rehbein U, Cadena Sandoval M, De Meulemeester AS, Baumeister R, Brohée L, Berdel B, Bockwoldt M, Carroll B, Chowdhury SR, von Deimling A, Demetriades C, Figlia G, Genomics England Research Consortium, de Araujo MEG, Heberle AM, Heiland I, Holzwarth B, Huber LA, Jaworski J, Kedra M, Kern K, Kopach A, Korolchuk VI, van 't Land-Kuper I, Macias M, Nellist M, Palm W, Pusch S, Ramos Pittol JM, Reil M, Reintjes A, Reuter F, Sampson JR, Scheldeman C, Siekierska A, Stefan E, Teleman AA, Thomas LE, Torres-Quesada O, Trump S, West HD, de Witte P, Woltering S, Yordanov TE, Zmorzynska J, Opitz CA, Thedieck K
Cell 2021 Feb 4;184(3):655-674.e27
Cell 2021 Feb 4;184(3):655-674.e27
The splicing factor U2AF1 contributes to cancer progression through a noncanonical role in translation regulation.
Palangat M, Anastasakis DG, Fei DL, Lindblad KE, Bradley R, Hourigan CS, Hafner M, Larson DR
Genes & development 2019 May 1;33(9-10):482-497
Genes & development 2019 May 1;33(9-10):482-497
Death-associated protein kinase 1 promotes growth of p53-mutant cancers.
Zhao J, Zhao D, Poage GM, Mazumdar A, Zhang Y, Hill JL, Hartman ZC, Savage MI, Mills GB, Brown PH
The Journal of clinical investigation 2015 Jul 1;125(7):2707-20
The Journal of clinical investigation 2015 Jul 1;125(7):2707-20
Spatial control of the TSC complex integrates insulin and nutrient regulation of mTORC1 at the lysosome.
Menon S, Dibble CC, Talbott G, Hoxhaj G, Valvezan AJ, Takahashi H, Cantley LC, Manning BD
Cell 2014 Feb 13;156(4):771-85
Cell 2014 Feb 13;156(4):771-85
TBC1D7 is a third subunit of the TSC1-TSC2 complex upstream of mTORC1.
Dibble CC, Elis W, Menon S, Qin W, Klekota J, Asara JM, Finan PM, Kwiatkowski DJ, Murphy LO, Manning BD
Molecular cell 2012 Aug 24;47(4):535-46
Molecular cell 2012 Aug 24;47(4):535-46
Clinicopathological and immunohistochemical findings in an autopsy case of tuberous sclerosis complex.
Boer K, Troost D, Jansen F, Nellist M, van den Ouweland AM, Geurts JJ, Spliet WG, Crino P, Aronica E
Neuropathology : official journal of the Japanese Society of Neuropathology 2008 Dec;28(6):577-90
Neuropathology : official journal of the Japanese Society of Neuropathology 2008 Dec;28(6):577-90
No comments: Submit comment
Supportive validation
- Submitted by
- Invitrogen Antibodies (provider)
- Main image
- Experimental details
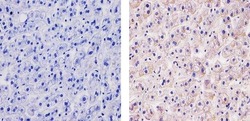
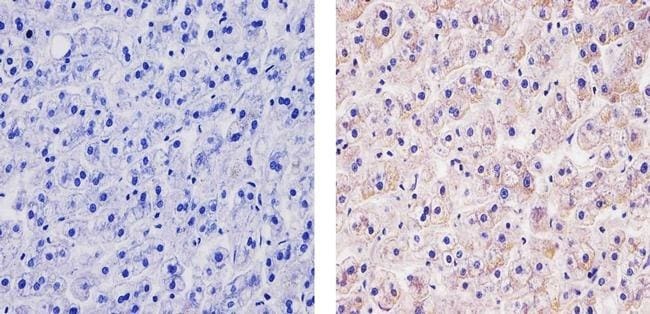
- Immunohistochemistry analysis of Tuberin/TSC2 showing staining in the cytoplasm of paraffin-embedded human liver tissue (right) compared to a negative control without primary antibody (left). To expose target proteins, antigen retrieval was performed using 10mM sodium citrate (pH 6.0), microwaved for 8-15 min. Following antigen retrieval, tissues were blocked in 3% H2O2-methanol for 15 min at room temperature, washed with ddH2O and PBS, and then probed with a Tuberin/TSC2 Mouse Monoclonal Antibody (Product # 37-0500) diluted in 3% BSA-PBS at a dilution of 1:20 for 1 hour at 37ºC in a humidified chamber. Tissues were washed extensively in PBST and detection was performed using an HRP-conjugated secondary antibody followed by colorimetric detection using a DAB kit. Tissues were counterstained with hematoxylin and dehydrated with ethanol and xylene to prep for mounting.
Supportive validation
- Submitted by
- Invitrogen Antibodies (provider)
- Main image
- Experimental details
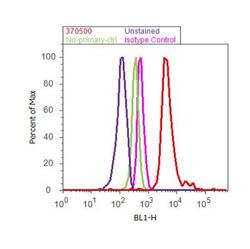
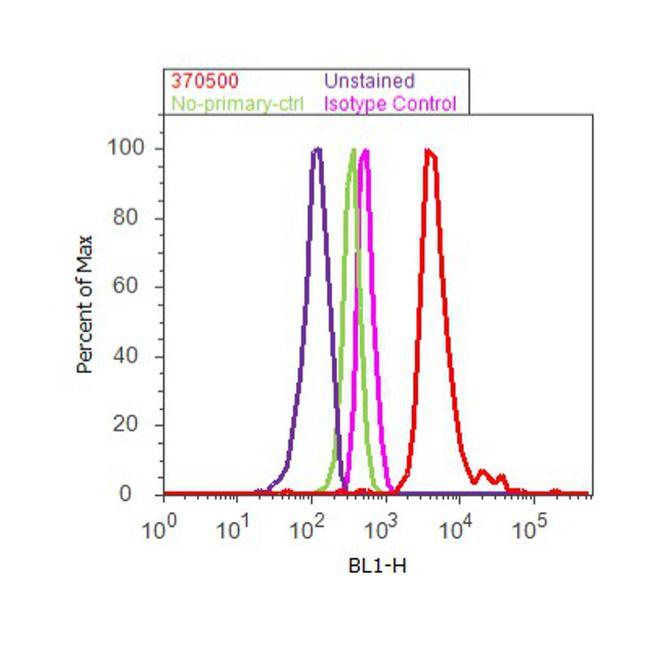
- Flow cytometry analysis of Tuberin / TSC2 was done on MCF7 cells. Cells were fixed with 70% ethanol for 10 minutes, permeabilized with 0.25% Triton™ X-100 for 20 minutes, and blocked with 5% BSA for 30 minutes at room temperature. Cells were labeled with Tuberin / TSC2 Mouse Monoclonal Antibody (370500, red histogram) or with mouse isotype control (pink histogram) at 3-5 ug/million cells in 2.5% BSA. After incubation at room temperature for 2 hours, the cells were labeled with Alexa Fluor® 488 Rabbit Anti-Mouse Secondary Antibody (A11059) at a dilution of 1:400 for 30 minutes at room temperature. The representative 10,000 cells were acquired and analyzed for each sample using an Attune® Acoustic Focusing Cytometer. The purple histogram represents unstained control cells and the green histogram represents no-primary-antibody control.
Supportive validation
- Submitted by
- Invitrogen Antibodies (provider)
- Main image
- Experimental details
- NULL
- Submitted by
- Invitrogen Antibodies (provider)
- Main image
- Experimental details
- NULL
- Submitted by
- Invitrogen Antibodies (provider)
- Main image
- Experimental details
- NULL
- Submitted by
- Invitrogen Antibodies (provider)
- Main image
- Experimental details
- NULL
- Submitted by
- Invitrogen Antibodies (provider)
- Main image
- Experimental details
- NULL
- Submitted by
- Invitrogen Antibodies (provider)
- Main image
- Experimental details
- NULL
- Submitted by
- Invitrogen Antibodies (provider)
- Main image

- Experimental details
- NULL
- Submitted by
- Invitrogen Antibodies (provider)
- Main image
- Experimental details
- NULL