 Explore
 Validate
 Learn
Learn Western blot
 Immunocytochemistry
 Immunohistochemistry
Antibody data
- Antibody Data
- Antigen structure
- References [5]
- Comments [0]
- Validations
- Immunocytochemistry [3]
- Other assay [5]
Submit
Validation data
Reference
Comment
Report error
- Product number
- PA1-10008 - Provider product page

- Provider
- Invitrogen Antibodies
- Product name
- MBP Polyclonal Antibody
- Antibody type
- Polyclonal
- Antigen
- Purifed from natural sources
- Description
- In Western blot using rat spinal cord whole tissue homogenates, this antibody detects all isotypes of MPB, resulting in bands at ~21.5kDa, 18.5kDa, 17kDa and 14kDa. |Stable at 4°C for at least one year.
- Reactivity
- Human, Mouse, Rat, Bovine, Porcine
- Host
- Chicken/Avian
- Isotype
- IgY
- Vial size
- 100 µL
- Concentration
- Conc. Not Determined
- Storage
- 4° C
Submitted references Whole-Brain Mapping of the Expression Pattern of T1R2, a Subunit Specific to the Sweet Taste Receptor.
Neuroglia infection by rabies virus after anterograde virus spread in peripheral neurons.
Optogenetic patterning of whisker-barrel cortical system in transgenic rat expressing channelrhodopsin-2.
Regulation of later neurogenic stages of adult-derived neural stem/progenitor cells by L-type Ca2+ channels.
Light-evoked somatosensory perception of transgenic rats that express channelrhodopsin-2 in dorsal root ganglion cells.
Jang JH, Kim HK, Seo DW, Ki SY, Park S, Choi SH, Kim DH, Moon SJ, Jeong YT
Frontiers in neuroanatomy 2021;15:751839
Frontiers in neuroanatomy 2021;15:751839
Neuroglia infection by rabies virus after anterograde virus spread in peripheral neurons.
Potratz M, Zaeck LM, Weigel C, Klein A, Freuling CM, Müller T, Finke S
Acta neuropathologica communications 2020 Nov 23;8(1):199
Acta neuropathologica communications 2020 Nov 23;8(1):199
Optogenetic patterning of whisker-barrel cortical system in transgenic rat expressing channelrhodopsin-2.
Honjoh T, Ji ZG, Yokoyama Y, Sumiyoshi A, Shibuya Y, Matsuzaka Y, Kawashima R, Mushiake H, Ishizuka T, Yawo H
PloS one 2014;9(4):e93706
PloS one 2014;9(4):e93706
Regulation of later neurogenic stages of adult-derived neural stem/progenitor cells by L-type Ca2+ channels.
Teh DB, Ishizuka T, Yawo H
Development, growth & differentiation 2014 Oct;56(8):583-94
Development, growth & differentiation 2014 Oct;56(8):583-94
Light-evoked somatosensory perception of transgenic rats that express channelrhodopsin-2 in dorsal root ganglion cells.
Ji ZG, Ito S, Honjoh T, Ohta H, Ishizuka T, Fukazawa Y, Yawo H
PloS one 2012;7(3):e32699
PloS one 2012;7(3):e32699
No comments: Submit comment
Supportive validation
- Submitted by
- Invitrogen Antibodies (provider)
- Main image
- Experimental details
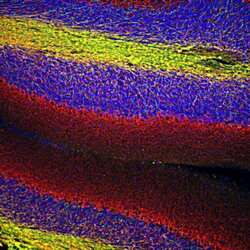
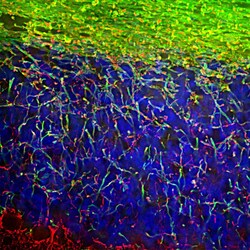
- Immunofluorescent analysis of MBP in rat brain cerebellum section. The section was stained using an MBP polyclonal antibody (Product # PA1-10008) at a dilution of 1:5,000 as seen in green, and costained using an NF-L polyclonal antibody (Product # PA1-10014) at a dilution of 1:5,000 as seen in red. The MBP antibody stains oligodendrocytes and the myelin sheathes around axons. The NF-L antibody labels dendrites and axons of neuronal cells in the molecular and granule layers.
- Submitted by
- Invitrogen Antibodies (provider)
- Main image
- Experimental details
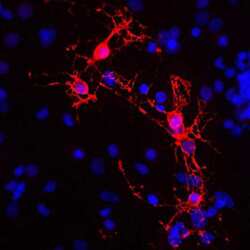
- Immunofluorescent analysis of MBP cortical neuron-glial cell culture. The culture was prepared from an E20 rat and stained using an MBP polyclonal antibody (Product # PA1-10008) at a dilution of 1:2,000 as seen in red, and with DAPI staining the nuclear DNA in blue. The antibody stains developing oligodendrocytes, cells, that form myelin around axons in the central nerve system.

- Submitted by
- Invitrogen Antibodies (provider)
- Main image
- Experimental details
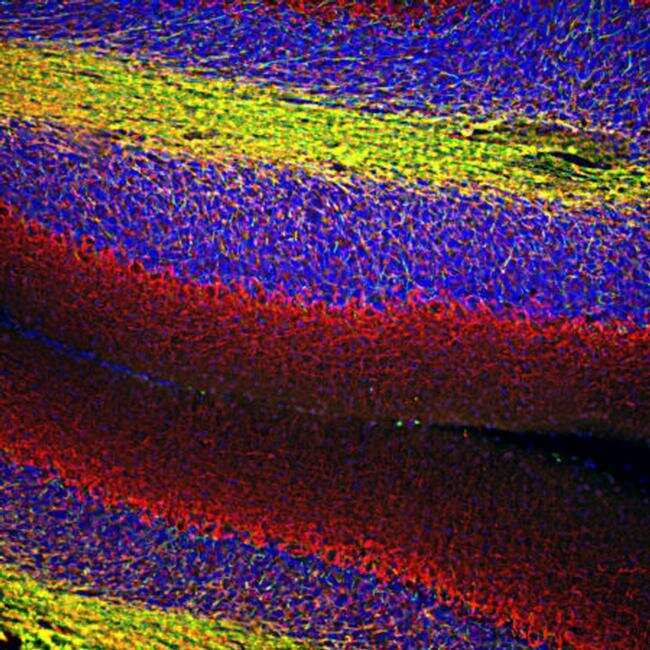
- Immunofluorescent analysis of MBP in rat brain cerebellum section was stained using a MBP polyclonal antibody (Product # PA1-10008) at a dilution of 1:5,000 as seen in green, and costained using an NF-L polyclonal antibody (Product # PA1-10014) at a dilution of 1:5,000 as seen in red. The MBP antibody stains oligodendrocytes and myelin sheathes around axons. The NF-L antibody labels dendrites and axons of neuronal cells.

Supportive validation
- Submitted by
- Invitrogen Antibodies (provider)
- Main image
- Experimental details
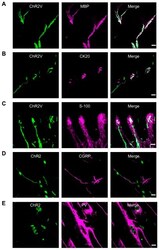
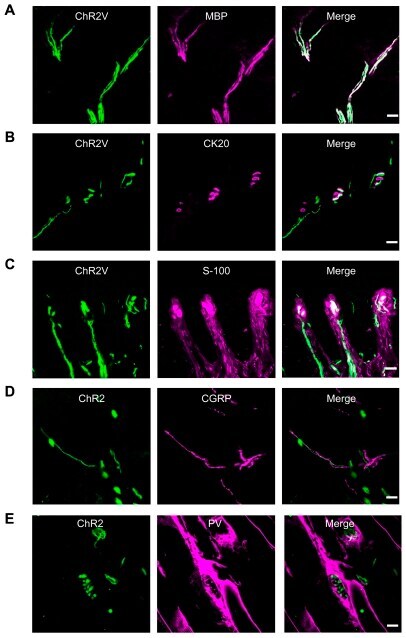
- Figure 4 Distribution of ChR2V in the peripheral sensory nerve endings. A-D. Immunohistochemical identification of the ChR2V+ nerve endings in the skin in relation to MBP (A), CK20 (B), S-100 (C) or CGRP (D). E. Co-localization of the ChR2V+ nerve endings with PV in the muscle spindle. Scale bars indicate 20 um.
- Submitted by
- Invitrogen Antibodies (provider)
- Main image

- Experimental details
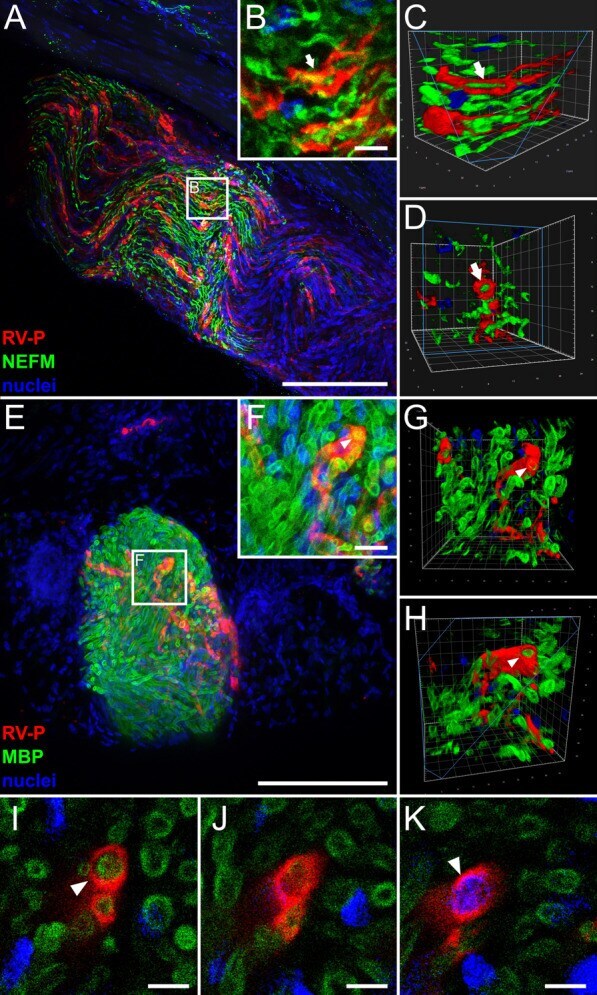
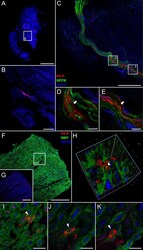
- Fig. 2 Detection of RABV P in non-neuronal Schwann cells of hind leg tissue after i.m. inoculation (9 days post-inoculation). a , b Maximum z-projection of high-resolution confocal z-stacks of RABV-infected nerve fiber (see also Fig. 1 d) in hind leg sections [z = 45 um; Scale bar: 100 um] ( a ) and detail [z = 15 um; Scale bar: 10 um] ( b ). Red: RABV P; green: NEFM; blue: cell nuclei. c , d Volumetric 3D projections of ( b ) with different viewing angles. The light blue box indicates the clipping plane. Arrows: RABV P surrounding axonal NEFM. e , f Maximum z-projection of a hind leg section ( e ) [z = 134 um; Scale bar: 200 um] and detail ( f ) [z = 20 um; Scale bar: 10 um] stained for RABV P (red), MBP (green) and nuclei (blue). g , h Volumetric 3D projections of different viewing angles of ( f ). Arrowhead: RABV-infected Schwann cell i-k Single slices with RABV P (red), MBP (green) and nuclei (blue). Arrowheads indicate myelin sheath/nucleus surrounded by RABV P. Scale bar: 5 um
- Submitted by
- Invitrogen Antibodies (provider)
- Main image
- Experimental details
- Fig. 3 Anterograde virus spread: RABV in Schwann cells of a hind leg nerve after i.c. inoculation. a , b Maximum z-projection of light sheet overview ( a ) and detail ( b ) of hind leg section after staining for RABV P (red), and nuclei (blue). Green fluorescence for NEFM is not shown as separation from green autofluorescence was not possible at low resolution. a Magnification of 1.6x [z = 1944 um; Scale bar: 1500 um] and b magnification of 12.6x [z = 58 um; Scale bar: 200 um]. c Maximum z-projection of confocal z-stack [z = 37 um] of infected nerve fiber from ( b ), now including NEFM staining (green). Scale bar: 100 um. d , e Maximum z-projection of details from ( c ) (see white boxes) [z = 5 um ( d , e )]. Scale bar: 10 um. f , g Maximum z-projection of hind leg nerve section stained for RABV P (red), MBP (green) and NEFM (blue) [z = 15 um]. To visualize low amounts of viral antigen, the MBP channel is excluded in ( g ). Scale bar: 50 um. h 3D projection of detail from ( f ) (see white box). i-k Single planes from detail of ( f ). The arrowhead indicates an RABV-infected cell. Scale bar: 5 um

- Submitted by
- Invitrogen Antibodies (provider)
- Main image
- Experimental details
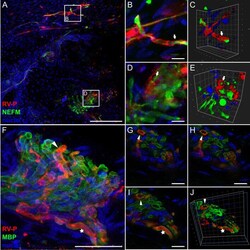
- Fig. 7 RABV P in axons and infected Schwann cells in coronal head sections. a Maximum z-projection of high-resolution confocal z-stacks of mouse head sections after i.c. inoculation and staining for RABV P (red), NEFM (green) and nuclei (blue) [z = 38 um]. Arrows indicate RABV P surrounding NEFM. Scale bar: 100 um. b-e Maximum z-projections ( b , d ) and corresponding 3D projections ( c , e ) of details of ( a ) (white boxes). f Maximum z-projection of confocal z-stacks of mouse head sections after i.c. inoculation stained for RABV P (red), MBP (green) and nuclei (blue) [z = 29 um]. Scale bar: 25 um. g-i Single slices of ( f ). Arrowhead: RABV P surrounding MBP-positive myelin sheath. Star: RABV P surrounded by MBP-positive myelin sheath. Scale bar: 5 um. j 3D projection of ( g - h )
- Submitted by
- Invitrogen Antibodies (provider)
- Main image
- Experimental details
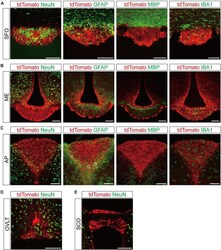
- FIGURE 3 Representative confocal images showing tdTomato fluorescence in the circumventricular organs (CVOs) of T1r2 -tdTomato mice. (A) Subfornical organ (SFO), (B) median eminence (ME), (C) area postrema (AP), (D) organum vasculosum lamina terminalis (OVLT), and (E) subcommissural organ (SCO). Representative markers for neurons (neuronal nuclei, NeuN), astrocytes (glial fibrillary acidic protein, GFAP), oligodendrocytes (myelin basic protein, MBP), and microglia (ionized calcium-binding adaptor molecule, IBA1) are indicated in green; tdTomato is indicated in red. White triangles indicate the overlap of the green and red signals. Scale bar, 100 mum.
