Explore
 Validate
 Learn
Learn Western blot
 Immunocytochemistry
Antibody data
- Antibody Data
- Antigen structure
- References [3]
- Comments [0]
- Validations
- Immunocytochemistry [6]
- Immunohistochemistry [6]
- Other assay [2]
Submit
Validation data
Reference
Comment
Report error
- Product number
- PA5-34806 - Provider product page

- Provider
- Invitrogen Antibodies
- Product name
- SMAD4 Polyclonal Antibody
- Antibody type
- Polyclonal
- Antigen
- Recombinant full-length protein
- Description
- Recommended positive controls: 293T, A431, HeLa, HepG2, Neuro 2A, C8D30, NIH-3T3, Raw264.7, C2C12, PC-12, Rat2, DDDDK-tagged SMAD4-transfected 293T. Predicted reactivity: Mouse (100%), Rat (100%), Pig (100%), Sheep (100%), Rhesus Monkey (100%), Bovine (100%). Store product as a concentrated solution. Centrifuge briefly prior to opening the vial.
- Reactivity
- Human, Mouse, Rat
- Host
- Rabbit
- Isotype
- IgG
- Vial size
- 100 μL
- Concentration
- 0.58 mg/mL
- Storage
- Store at 4°C short term. For long term storage, store at -20°C, avoiding freeze/thaw cycles.
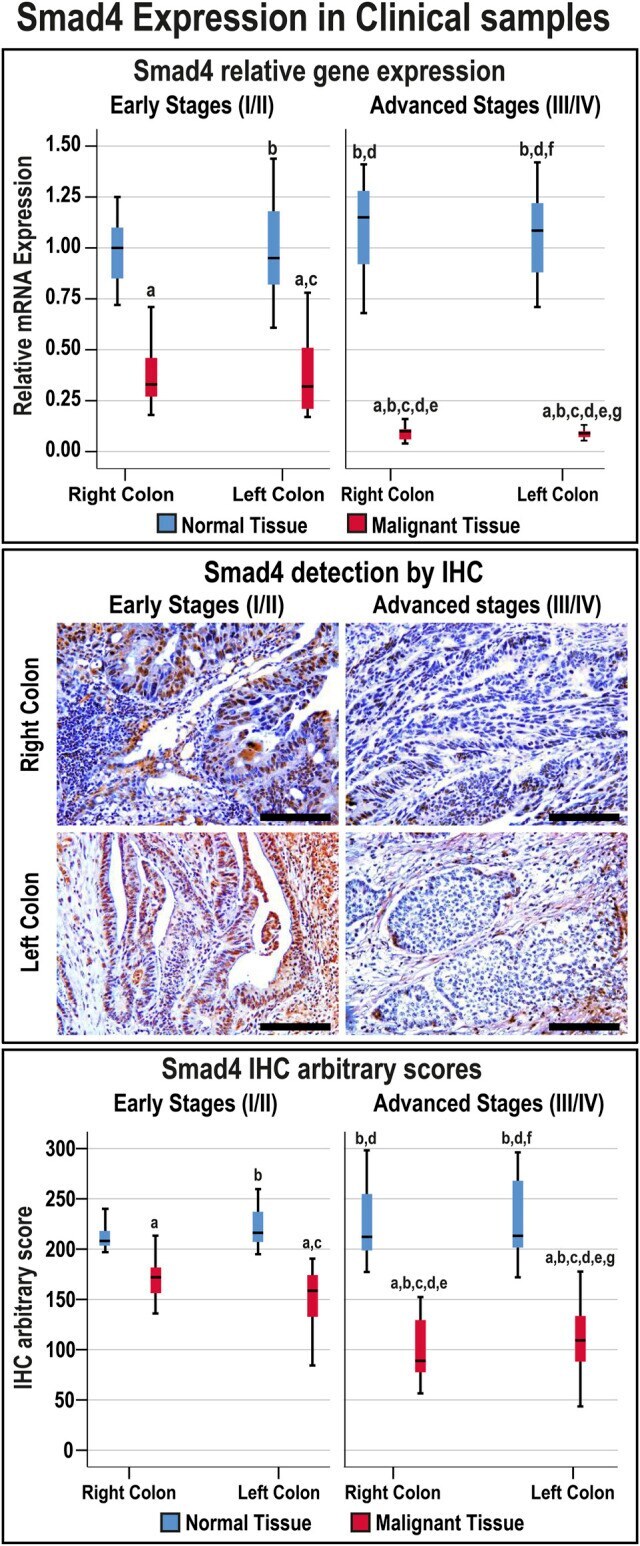
Submitted references Profiling Activins and Follistatin in Colorectal Cancer According to Clinical Stage, Tumour Sidedness and Smad4 Status.
Molecular diversity of diencephalic astrocytes reveals adult astrogenesis regulated by Smad4.
Obesity reduces mammary epithelial cell TGFβ1 activity through macrophage-mediated extracellular matrix remodeling.
Refaat B, Zekri J, Aslam A, Ahmad J, Baghdadi MA, Meliti A, Idris S, Sultan S, Alardati H, Saimeh HA, Alsaegh A, Alhadrami M, Hamid T, Naeem ME, Elsamany SA
Pathology oncology research : POR 2021;27:1610032
Pathology oncology research : POR 2021;27:1610032
Molecular diversity of diencephalic astrocytes reveals adult astrogenesis regulated by Smad4.
Ohlig S, Clavreul S, Thorwirth M, Simon-Ebert T, Bocchi R, Ulbricht S, Kannayian N, Rossner M, Sirko S, Smialowski P, Fischer-Sternjak J, Götz M
The EMBO journal 2021 Nov 2;40(21):e107532
The EMBO journal 2021 Nov 2;40(21):e107532
Obesity reduces mammary epithelial cell TGFβ1 activity through macrophage-mediated extracellular matrix remodeling.
Chamberlin T, Thompson V, Hillers-Ziemer LE, Walton BN, Arendt LM
FASEB journal : official publication of the Federation of American Societies for Experimental Biology 2020 Jun;34(6):8611-8624
FASEB journal : official publication of the Federation of American Societies for Experimental Biology 2020 Jun;34(6):8611-8624
No comments: Submit comment
Supportive validation
- Submitted by
- Invitrogen Antibodies (provider)
- Main image
- Experimental details
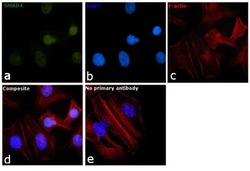
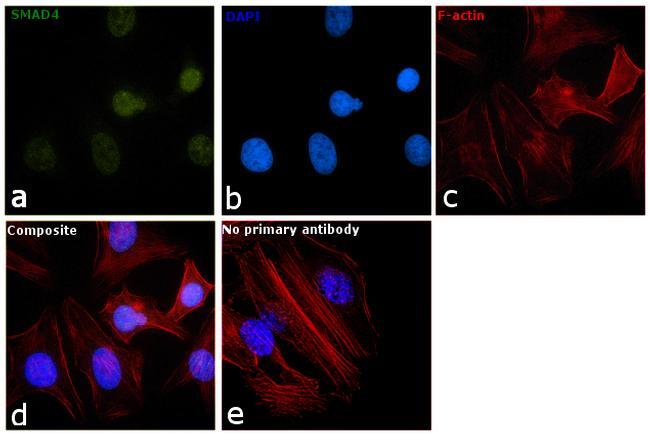
- Immunofluorescence analysis of SMAD4 was performed using 70 % confluent log phase HeLa cells. The cells were fixed with 4% paraformaldehyde for 10 minutes, permeabilized with 0.1% Triton™ X-100 for 10 minutes, and blocked with 1% BSA for 1 hour at room temperature. The cells were labeled with SMAD4 Polyclonal Antibody (PA5-34806) at 5 µg/mL in 0.1% BSA and incubated overnight at room temperature and then labeled with Goat anti-Rabbit IgG (H+L) Superclonal™ Secondary Antibody, Alexa Fluor® 488 conjugate (A27034) at a dilution of 1:2000 for 45 minutes at room temperature (Panel a: green). Nuclei (Panel b: blue) were stained with SlowFade® Gold Antifade Mountant with DAPI (S36938). F-actin (Panel c: red) was stained with Rhodamine Phalloidin (Product # R415, 1:300). Panel d represents the merged image showing nuclear staining. Panel e shows the no primary antibody control. The images were captured at 60X magnification.

- Submitted by
- Invitrogen Antibodies (provider)
- Main image
- Experimental details
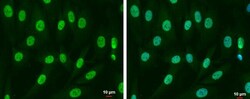
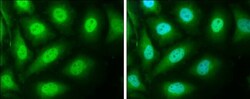
- Immunocytochemistry-Immunofluorescence analysis of SMAD4 was performed in SK-N-SH cells fixed in 4% paraformaldehyde at RT for 15 min. Green: SMAD4 Polyclonal Antibody (Product # PA5-34806) diluted at 1:500. Blue: Hoechst 33342 staining. Scale bar = 10 µm.
- Submitted by
- Invitrogen Antibodies (provider)
- Main image
- Experimental details
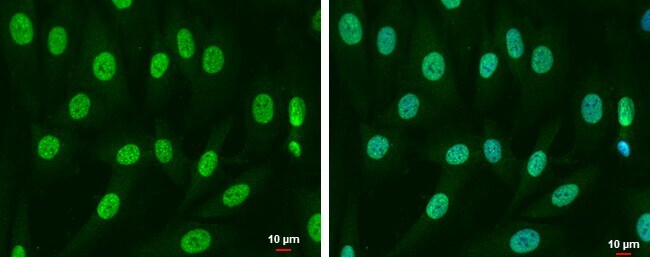
- Immunocytochemistry-Immunofluorescence analysis of SMAD4 was performed in HeLa cells fixed in 4% paraformaldehyde at RT for 15 min. Green: SMAD4 Polyclonal Antibody (Product # PA5-34806) diluted at 1:500. Blue: Hoechst 33342 staining.

- Submitted by
- Invitrogen Antibodies (provider)
- Main image

- Experimental details
- Immunocytochemistry-Immunofluorescence analysis of SMAD4 was performed in SK-N-SH cells fixed in 4% paraformaldehyde at RT for 15 min. Green: SMAD4 Polyclonal Antibody (Product # PA5-34806) diluted at 1:500. Blue: Hoechst 33342 staining. Scale bar = 10 µm.

- Submitted by
- Invitrogen Antibodies (provider)
- Main image

- Experimental details
- Immunocytochemistry-Immunofluorescence analysis of SMAD4 was performed in HeLa cells fixed in 4% paraformaldehyde at RT for 15 min. Green: SMAD4 Polyclonal Antibody (Product # PA5-34806) diluted at 1:500. Blue: Hoechst 33342 staining.

- Submitted by
- Invitrogen Antibodies (provider)
- Main image

- Experimental details
- Immunofluorescence analysis of SMAD4 was performed using 70 % confluent log phase HeLa cells. The cells were fixed with 4% paraformaldehyde for 10 minutes, permeabilized with 0.1% Triton™ X-100 for 10 minutes, and blocked with 1% BSA for 1 hour at room temperature. The cells were labeled with SMAD4 Polyclonal Antibody (PA5-34806) at 5 µg/mL in 0.1% BSA and incubated overnight at room temperature and then labeled with Goat anti-Rabbit IgG (Heavy Chain) Superclonal™ Secondary Antibody, Alexa Fluor® 488 conjugate (A27034) at a dilution of 1:2000 for 45 minutes at room temperature (Panel a: green). Nuclei (Panel b: blue) were stained with SlowFade® Gold Antifade Mountant with DAPI (S36938). F-actin (Panel c: red) was stained with Rhodamine Phalloidin (Product # R415, 1:300). Panel d represents the merged image showing nuclear staining. Panel e shows the no primary antibody control. The images were captured at 60X magnification.
Supportive validation
- Submitted by
- Invitrogen Antibodies (provider)
- Main image
- Experimental details
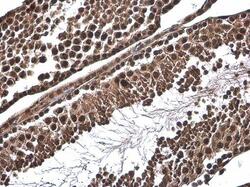
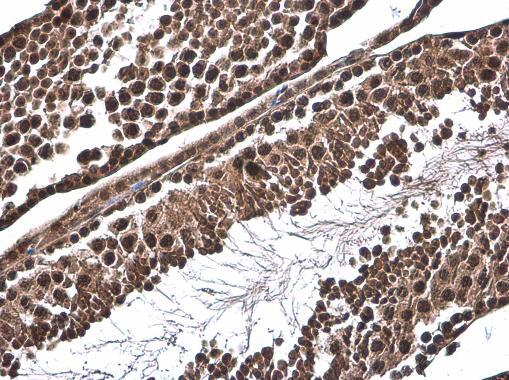
- Immunohistochemistry (Paraffin) analysis of SMAD4 was performed in paraffin-embedded mouse testis tissue using SMAD4 Polyclonal Antibody (Product # PA5-34806) at a dilution of 1:500.
- Submitted by
- Invitrogen Antibodies (provider)
- Main image
- Experimental details
- Immunohistochemical analysis of paraffin-embedded human ulcerative colitis tissue using SMAD4 Polyclonal Antibody (Product # PA5-34806).
- Submitted by
- Invitrogen Antibodies (provider)
- Main image
- Experimental details
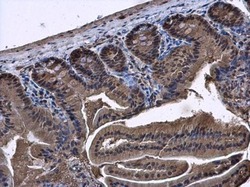
- SMAD4 Polyclonal Antibody detects SMAD4 protein at cytoplasm and nucleus in mouse duodenum by immunohistochemical analysis. Sample: Paraffin-embedded mouse duodenum. SMAD4 Polyclonal Antibody (Product # PA5-34806) diluted at 1:500. Antigen Retrieval: Citrate buffer, pH 6.0, 15 min.

- Submitted by
- Invitrogen Antibodies (provider)
- Main image
- Experimental details
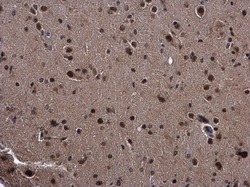
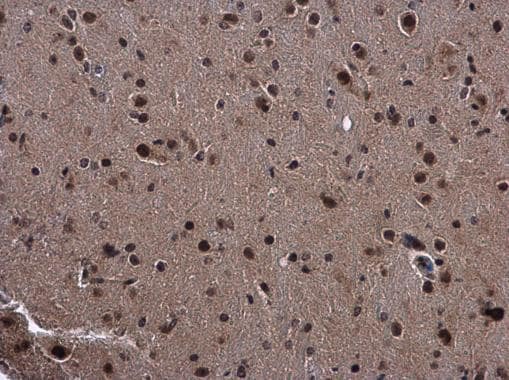
- SMAD4 Polyclonal Antibody detects SMAD4 protein at cytoplasm and nucleus in mouse brain by immunohistochemical analysis. Sample: Paraffin-embedded mouse brain. SMAD4 Polyclonal Antibody (Product # PA5-34806) diluted at 1:500. Antigen Retrieval: Citrate buffer, pH 6.0, 15 min.
- Submitted by
- Invitrogen Antibodies (provider)
- Main image
- Experimental details
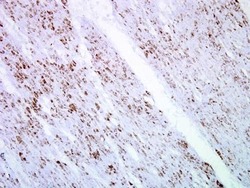
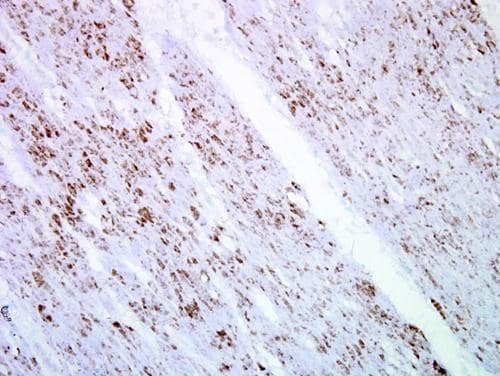
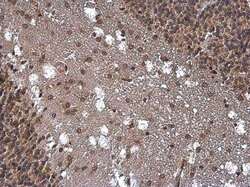
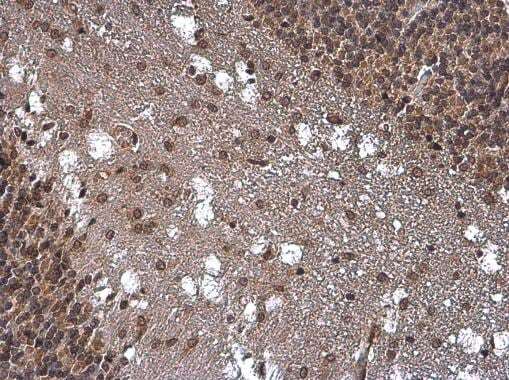
- Immunohistochemistry (Paraffin) analysis of SMAD4 was performed in paraffin-embedded rat brain tissue using SMAD4 Polyclonal Antibody (Product # PA5-34806) at a dilution of 1:500.
- Submitted by
- Invitrogen Antibodies (provider)
- Main image
- Experimental details
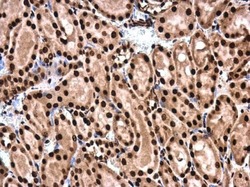
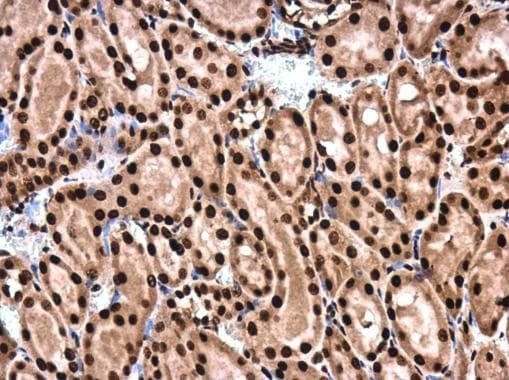
- Immunohistochemistry (Paraffin) analysis of SMAD4 was performed in paraffin-embedded rat kidney tissue using SMAD4 Polyclonal Antibody (Product # PA5-34806) at a dilution of 1:500.
Supportive validation
- Submitted by
- Invitrogen Antibodies (provider)
- Main image
- Experimental details
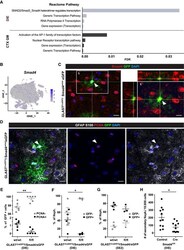
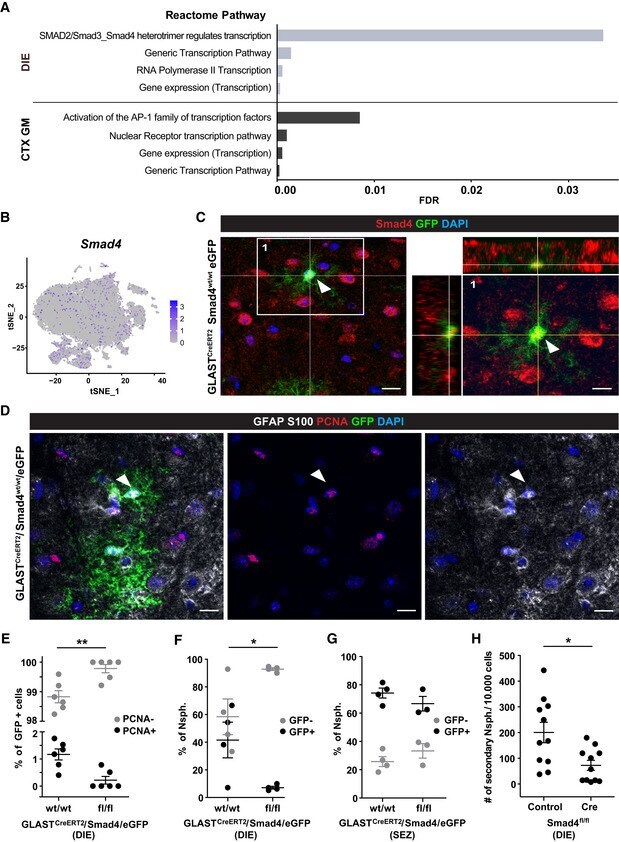
- Figure 9 Smad4 regulates diencephalic astrocyte proliferation and neurosphere formation A Reactome pathway analysis for all 174 transcription factor genes with higher expression in DIE (upper) and all 205 genes higher in CTX GM (lower) astrocytes. B t-SNE visualization of DIE astrocytes isolated by ACSA-2 MACS (Fig 1A ) showing Smad4 expression (scaled log-normalized read counts). C Example of a Smad4/GFP double-positive astrocyte (indicated by arrowhead) in a single optical section of DIE from 3-mo-old GLAST CreERT2 /eGFP mice 21 dpt immunostained as indicated on top of the panel. Orthogonal projections of the area highlighted in left panel of C shown at higher magnification in the right panel. Scale bars: 15 um (left panel) and 10 um (right panel). D Example of a proliferating (PCNA + , arrowhead) astrocyte in a single optical section of DIE from 3-mo-old GLAST CreERT2 /eGFP mice 21 dpt immunostained as indicated on top with single channels shown in middle and right panels. Scale bars: 15 um. E Histogram depicting percentage of PCNA-positive cells of all GFP-positive cells in the DIE of the genotype indicated on the x-axis ( n = 6 animals per genotype; 5 ROI covering the diencephalon on a total of 3 slides were analysed per animal; PCNA-negative and PCNA-positive cells comparing wt/wt vs. fl/fl animals, adjusted P -value = 0.002). F, G Histograms depicting percentage of the neurosphere-generating cells obtained from the DIE (F) or SEZ (G) of GLAST CreERT2 /Smad4 fl/fl /eGFP
- Submitted by
- Invitrogen Antibodies (provider)
- Main image
- Experimental details
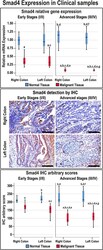
- FIGURE 1 Relative expression (median) of Smad4 gene and protein in addition to the protein localisation by IHC in the FFPE ( n = 90 patients) and fresh ( n = 40 patients) cohorts of paired malignant and normal colonic tissues according to clinical stages and tumour sidedness (Scale bar = 15 mum; a = p < 0.05 compared with right-sided normal tissue from early cancer; b = p < 0.05 compared with early stage right-sided colon cancer; c = p < 0.05 compared with left-sided normal tissue from early cancer; d = p < 0.05 compared with early stage left-sided colon cancer; e = p < 0.05 compared with right-sided normal tissue from advanced cancer; f = p < 0.05 compared with advanced stage right-sided colon cancer and g = p < 0.05 compared with left-sided normal tissue from advanced cancer).