Explore
 Validate
 Learn
Learn Flow cytometry
Antibody data
- Antibody Data
- Antigen structure
- References [15]
- Comments [0]
- Validations
- Flow cytometry [1]
- Other assay [18]
Submit
Validation data
Reference
Comment
Report error
- Product number
- 78-0259-42 - Provider product page

- Provider
- Invitrogen Antibodies
- Product name
- CD25 Monoclonal Antibody (BC96), Super Bright™ 780, eBioscience™
- Antibody type
- Monoclonal
- Antigen
- Other
- Description
- Description: The BC96 monoclonal antibody reacts with human CD25, the 55 kDa interleukin-2 receptor alpha chain (IL-2R alpha). CD25 is expressed by early progenitors of T and B lineage as well as by activated mature T and B lymphocytes. By itself, CD25 binds IL-2 only with low affinity. However, CD25 associates with CD122 (IL-2 receptor beta chain) and CD132 (common gamma chain) to form the high affinity IL-2 receptor. CD25 plays a role in lymphocyte differentiating and activation/proliferation. Applications Reported: This BC96 antibody has been reported for use in flow cytometric analysis. Applications Tested: This BC96 antibody has been pre-diluted and tested by flow cytometric analysis of normal human peripheral blood cells. This may be used at 5 µL (0.25 µg) per test. A test is defined as the amount (µg) of antibody that will stain a cell sample in a final volume of 100 µL. Cell number should be determined empirically but can range from 10^5 to 10^8 cells/test. Super Bright 780 can be excited with the violet laser line (405 nm) and emits at 780 nm. We recommend using a 780/60 bandpass filter, or equivalent. Please make sure that your instrument is capable of detecting this fluorochrome. When using two or more Super Bright dye-conjugated antibodies in a staining panel, it is recommended to use Super Bright Complete Staining Buffer (Product # SB-4401) to minimize any non-specific polymer interactions. Please refer to the datasheet for Super Bright Staining Buffer for more information. In some experiments, we have observed that compensation values for Super Bright 780-conjugated antibodies are higher in the violet 450/50 channel when using UltraComp eBeads microspheres (Product # 01-2222-42) as compared to single-color stained cells. In such circumstances, we would recommend setting compensation with cells. We have also observed this in some experiments using AbC Total Antibody Compensation beads (Product # A10497). Light sensitivity: This tandem dye is sensitive to photo-induced oxidation. Please protect this vial and stained samples from light. Fixation: Samples can be stored in IC Fixation Buffer (Product # 00-8222) (100 µL of cell sample + 100 µL of IC Fixation Buffer) or 1-step Fix/Lyse Solution (Product # 00-5333) for up to 3 days in the dark at 4°C with minimal impact on brightness and FRET efficiency/compensation. Some generalizations regarding fluorophore performance after fixation can be made, but clone specific performance should be determined empirically. Excitation: 405 nm; Emission: 780 nm; Laser: Violet Laser Super Bright Polymer Dyes are sold under license from Becton, Dickinson and Company.
- Reactivity
- Human
- Host
- Mouse
- Isotype
- IgG
- Antibody clone number
- BC96
- Vial size
- 100 Tests
- Concentration
- 5 µL/Test
- Storage
- 4° C, store in dark, DO NOT FREEZE!
Submitted references Rotenone aggravates PD-like pathology in A53T mutant human α-synuclein transgenic mice in an age-dependent manner.
Identification of celastrol as a novel HIV-1 latency reversal agent by an image-based screen.
Human endoglin-CD3 bispecific T cell engager antibody induces anti-tumor effect in vivo.
Notch4 signaling limits regulatory T-cell-mediated tissue repair and promotes severe lung inflammation in viral infections.
FABP4 facilitates inflammasome activation to induce the Treg/Th17 imbalance in preeclampsia via forming a positive feedback with IL-17A.
Numerical optimization of microfluidic vortex shedding for genome editing T cells with Cas9.
T cell receptor-dependent S-acylation of ZAP-70 controls activation of T cells.
Soluble fibrinogen‑like protein 2 levels are decreased in patients with ischemic heart failure and associated with cardiac function.
Imbalance between T helper 1 and regulatory T cells plays a detrimental role in experimental Parkinson's disease in mice.
Th2 Biased Immunity With Altered B Cell Profiles in Circulation of Patients With Sporotrichosis Caused by Sporothrix globosa.
Potential of neutrophil to lymphocyte ratio in predicting sustained remission in rheumatoid arthritis compared to other immune activation markers.
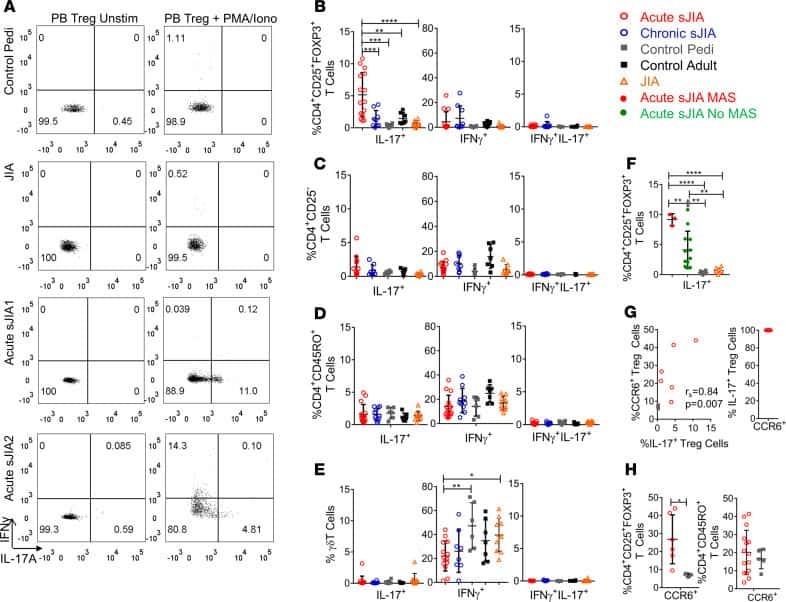
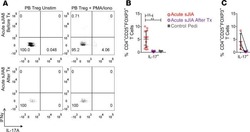
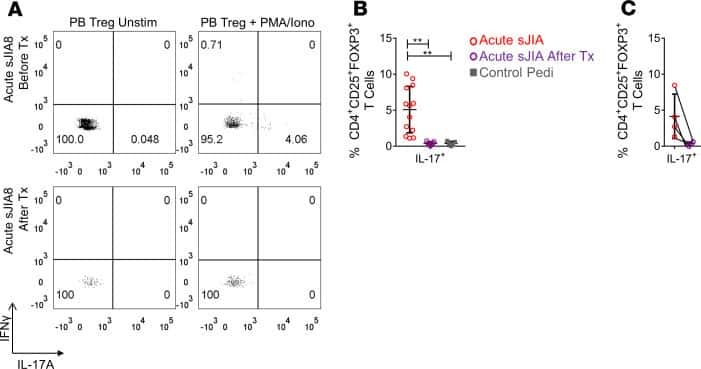
Th17 reprogramming of T cells in systemic juvenile idiopathic arthritis.
Transcriptional down-regulation of ccr5 in a subset of HIV+ controllers and their family members.
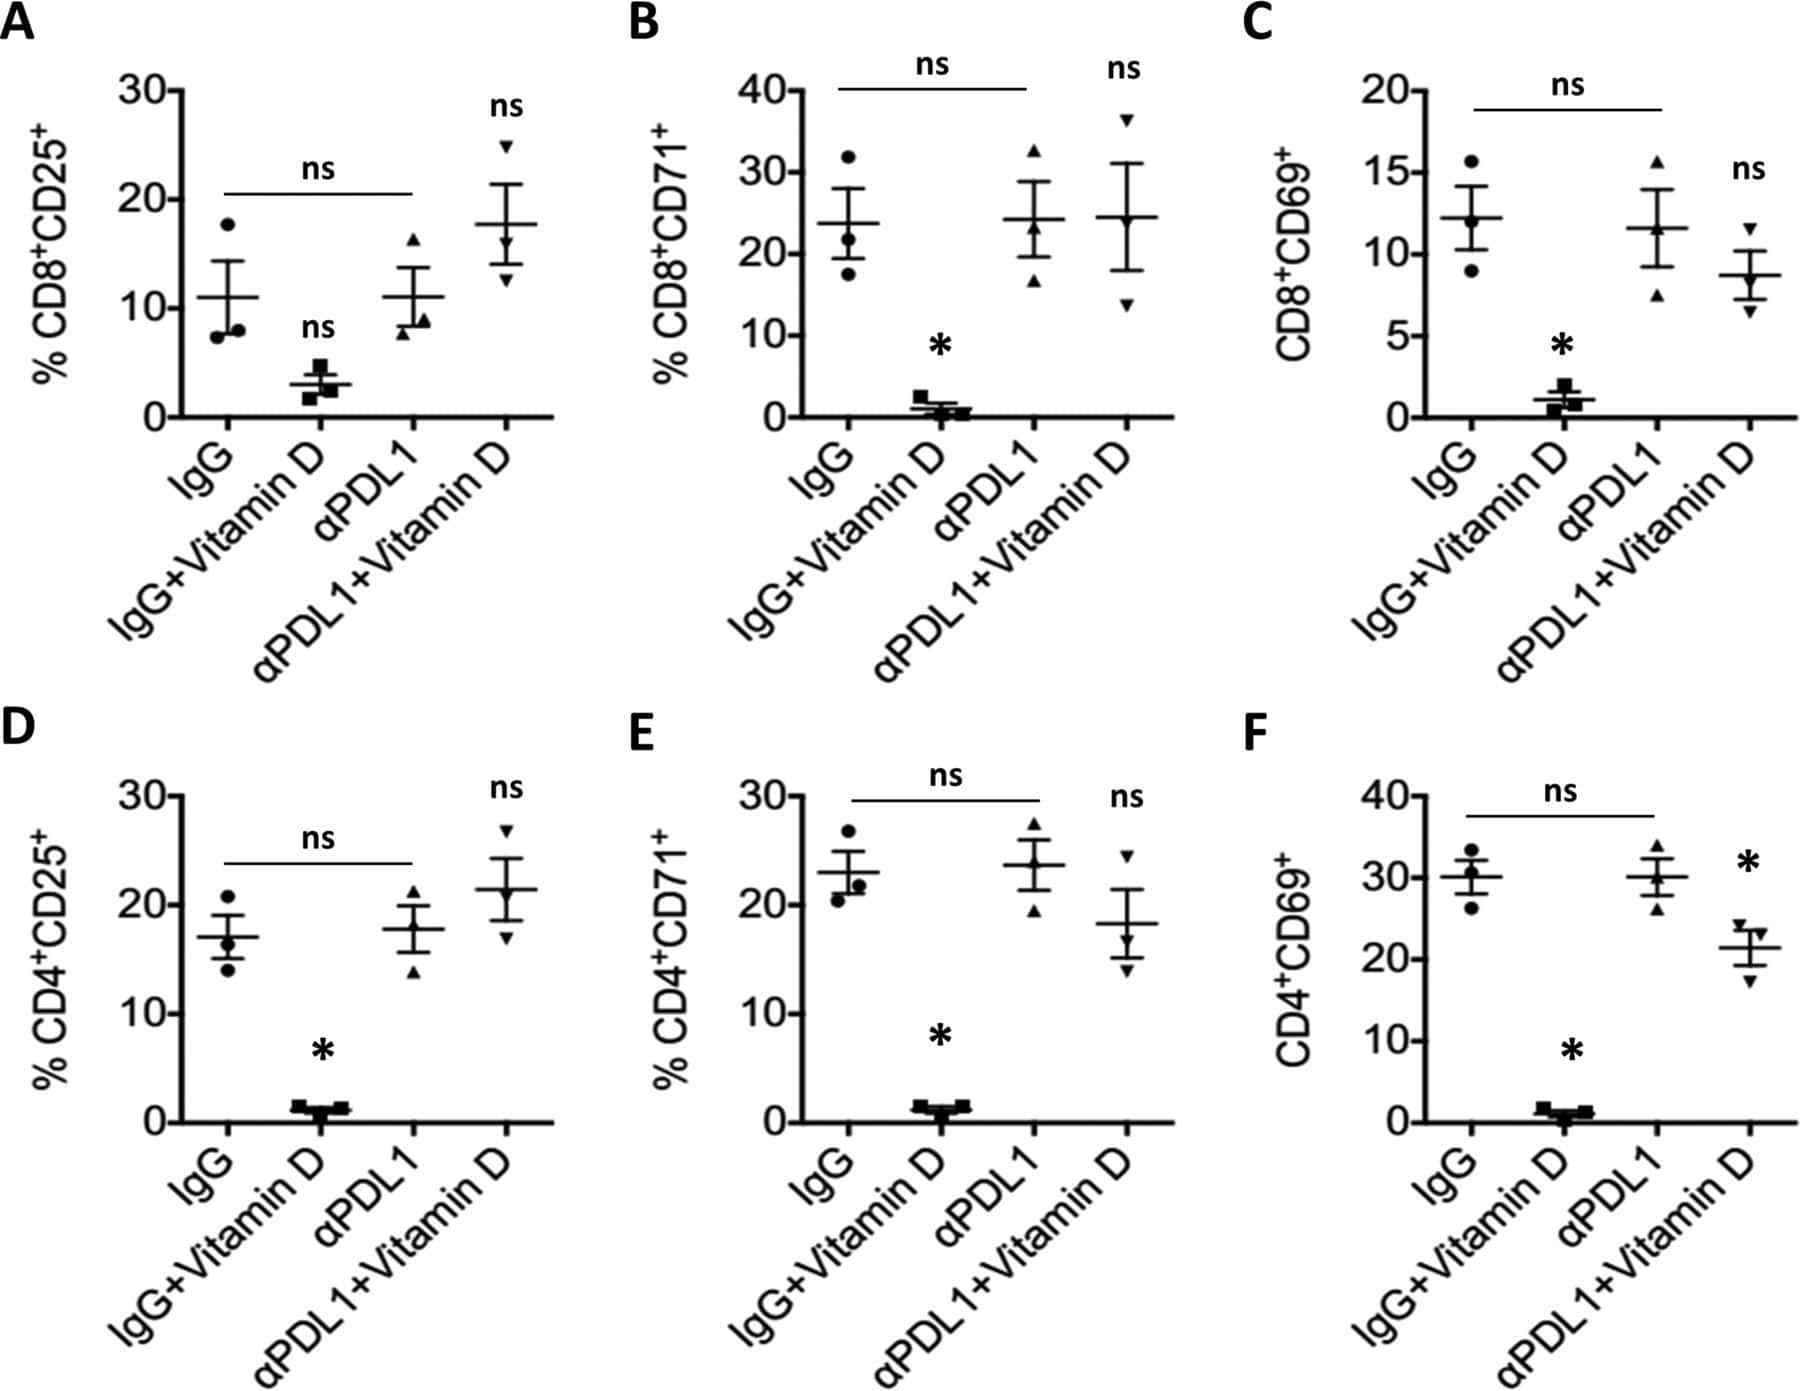
Hormonal vitamin D up-regulates tissue-specific PD-L1 and PD-L2 surface glycoprotein expression in humans but not mice.
Alteration of Th17 and Foxp3(+) regulatory T cells in patients with unexplained recurrent spontaneous abortion before and after the therapy of hCG combined with immunoglobulin.
Chen AD, Cao JX, Chen HC, Du HL, Xi XX, Sun J, Yin J, Jing YH, Gao LP
Frontiers in aging neuroscience 2022;14:842380
Frontiers in aging neuroscience 2022;14:842380
Identification of celastrol as a novel HIV-1 latency reversal agent by an image-based screen.
Liu H, Hu PW, Dubrulle J, Stossi F, Nikolai BC, Mancini MA, Rice AP
PloS one 2021;16(4):e0244771
PloS one 2021;16(4):e0244771
Human endoglin-CD3 bispecific T cell engager antibody induces anti-tumor effect in vivo.
Zhong L, Shi W, Gan L, Liu X, Huo Y, Wu P, Zhang Z, Wu T, Peng H, Huang Y, Zhao Y, Yuan Y, Deng Z, Tang H
Theranostics 2021;11(13):6393-6406
Theranostics 2021;11(13):6393-6406
Notch4 signaling limits regulatory T-cell-mediated tissue repair and promotes severe lung inflammation in viral infections.
Harb H, Benamar M, Lai PS, Contini P, Griffith JW, Crestani E, Schmitz-Abe K, Chen Q, Fong J, Marri L, Filaci G, Del Zotto G, Pishesha N, Kolifrath S, Broggi A, Ghosh S, Gelmez MY, Oktelik FB, Cetin EA, Kiykim A, Kose M, Wang Z, Cui Y, Yu XG, Li JZ, Berra L, Stephen-Victor E, Charbonnier LM, Zanoni I, Ploegh H, Deniz G, De Palma R, Chatila TA
Immunity 2021 Jun 8;54(6):1186-1199.e7
Immunity 2021 Jun 8;54(6):1186-1199.e7
FABP4 facilitates inflammasome activation to induce the Treg/Th17 imbalance in preeclampsia via forming a positive feedback with IL-17A.
Chang GP, Yang XL, Liu W, Lin S, Yang SL, Zhao MY
Molecular therapy. Nucleic acids 2021 Jun 4;24:743-754
Molecular therapy. Nucleic acids 2021 Jun 4;24:743-754
Numerical optimization of microfluidic vortex shedding for genome editing T cells with Cas9.
Jarrell JA, Sytsma BJ, Wilson LH, Pan FL, Lau KHWJ, Kirby GTS, Lievano AA, Pawell RS
Scientific reports 2021 Jun 3;11(1):11818
Scientific reports 2021 Jun 3;11(1):11818
T cell receptor-dependent S-acylation of ZAP-70 controls activation of T cells.
Tewari R, Shayahati B, Fan Y, Akimzhanov AM
The Journal of biological chemistry 2021 Jan-Jun;296:100311
The Journal of biological chemistry 2021 Jan-Jun;296:100311
Soluble fibrinogen‑like protein 2 levels are decreased in patients with ischemic heart failure and associated with cardiac function.
You Y, Huang S, Liu H, Fan C, Liu K, Wang Z
Molecular medicine reports 2021 Aug;24(2)
Molecular medicine reports 2021 Aug;24(2)
Imbalance between T helper 1 and regulatory T cells plays a detrimental role in experimental Parkinson's disease in mice.
Li W, Luo Y, Xu H, Ma Q, Yao Q
The Journal of international medical research 2021 Apr;49(4):300060521998471
The Journal of international medical research 2021 Apr;49(4):300060521998471
Th2 Biased Immunity With Altered B Cell Profiles in Circulation of Patients With Sporotrichosis Caused by Sporothrix globosa.
Zu J, Yao L, Song Y, Cui Y, Guan M, Chen R, Zhen Y, Li S
Frontiers in immunology 2020;11:570888
Frontiers in immunology 2020;11:570888
Potential of neutrophil to lymphocyte ratio in predicting sustained remission in rheumatoid arthritis compared to other immune activation markers.
Chandrashekara S, Lingaraju DC, Renuka P, Anupama KR
The Indian journal of medical research 2020 Sep;152(3):234-243
The Indian journal of medical research 2020 Sep;152(3):234-243
Th17 reprogramming of T cells in systemic juvenile idiopathic arthritis.
Henderson LA, Hoyt KJ, Lee PY, Rao DA, Jonsson AH, Nguyen JP, Rutherford K, Julé AM, Charbonnier LM, Case S, Chang MH, Cohen EM, Dedeoglu F, Fuhlbrigge RC, Halyabar O, Hazen MM, Janssen E, Kim S, Lo J, Lo MS, Meidan E, Son MBF, Sundel RP, Stoll ML, Nusbaum C, Lederer JA, Chatila TA, Nigrovic PA
JCI insight 2020 Mar 26;5(6)
JCI insight 2020 Mar 26;5(6)
Transcriptional down-regulation of ccr5 in a subset of HIV+ controllers and their family members.
Gonzalo-Gil E, Rapuano PB, Ikediobi U, Leibowitz R, Mehta S, Coskun AK, Porterfield JZ, Lampkin TD, Marconi VC, Rimland D, Walker BD, Deeks S, Sutton RE
eLife 2019 Apr 9;8
eLife 2019 Apr 9;8
Hormonal vitamin D up-regulates tissue-specific PD-L1 and PD-L2 surface glycoprotein expression in humans but not mice.
Dimitrov V, Bouttier M, Boukhaled G, Salehi-Tabar R, Avramescu RG, Memari B, Hasaj B, Lukacs GL, Krawczyk CM, White JH
The Journal of biological chemistry 2017 Dec 15;292(50):20657-20668
The Journal of biological chemistry 2017 Dec 15;292(50):20657-20668
Alteration of Th17 and Foxp3(+) regulatory T cells in patients with unexplained recurrent spontaneous abortion before and after the therapy of hCG combined with immunoglobulin.
Sha J, Liu F, Zhai J, Liu X, Zhang Q, Zhang B
Experimental and therapeutic medicine 2017 Aug;14(2):1114-1118
Experimental and therapeutic medicine 2017 Aug;14(2):1114-1118
No comments: Submit comment
Supportive validation
- Submitted by
- Invitrogen Antibodies (provider)
- Main image
- Experimental details
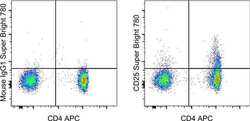
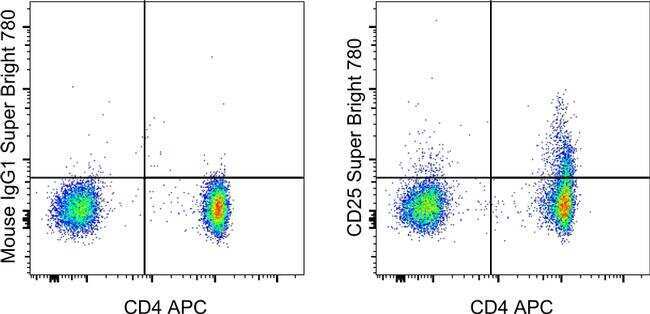
- Staining of normal human peripheral blood cells with CD4 Monoclonal Antibody, APC (Product # 17-0049-42) and Mouse IgG1 kappa Isotype Control, Super Bright 780 (Product # 78-4714-42) (left) or CD25 Monoclonal Antibody, Super Bright 780 (right). Cells in the lymphocyte gate were used for analysis.
Supportive validation
- Submitted by
- Invitrogen Antibodies (provider)
- Main image
- Experimental details
- NULL
- Submitted by
- Invitrogen Antibodies (provider)
- Main image
- Experimental details
- NULL
- Submitted by
- Invitrogen Antibodies (provider)
- Main image

- Experimental details
- NULL
- Submitted by
- Invitrogen Antibodies (provider)
- Main image
- Experimental details
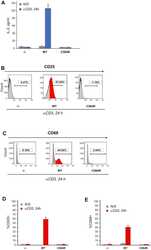
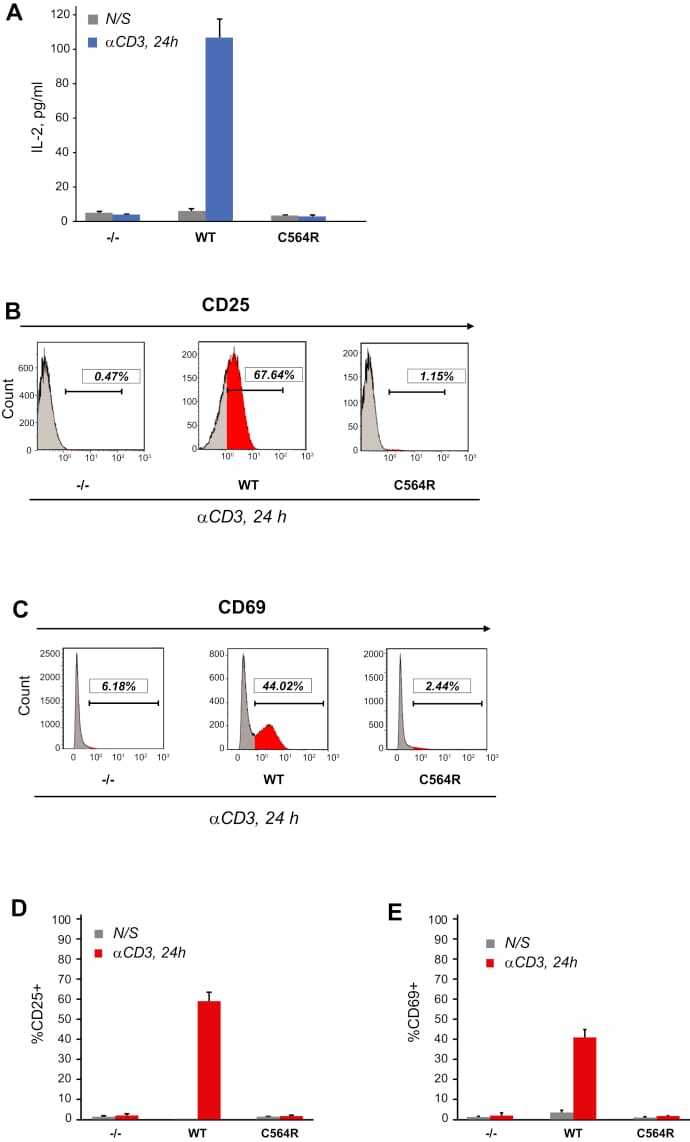
- Figure 5 S-acylation of ZAP-70 is required for T cell activation. A , IL-2 production by P116 (ZAP-70 -/-) Jurkat T cells stably rescued with WT or acylation-deficient C564R ZAP-70. IL-2 concentrations were measured by ELISA in supernatants from resting cells or cells stimulated for 24 h with plate-bound anti-CD3 antibody. Data shown are representative of three independent biological repeats and represented as mean +- SEM. B and C , Expression of CD25 and CD69 T cell surface activation markers by P116 stably rescued with WT or C564R ZAP-70. Cells were stimulated for 24 h with plate-bound anti-CD3 antibody and analyzed by flow cytometry. D and E , Quantification of CD25 and CD69 expression measured by flow cytometry. Data shown are pooled from three independent biological repeats and represented as mean +- SEM.
- Submitted by
- Invitrogen Antibodies (provider)
- Main image
- Experimental details
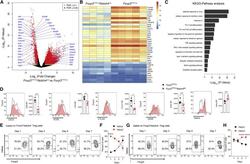
- Figure 5 Notch4 deficiency reprograms the lung Treg cell transcriptome of poly(I:C)-treated mice (A-C) Volcano plot (A), heatmap (B), and pathway analysis (C) of gene transcripts of lung Treg cells isolated from Foxp3 YFPCre and Foxp3 YFPCre Notch4 Delta/Delta mice treated with poly(I:C) (n = 4 and n = 5, respectively). (D) Flow cytometry histograms and graphical representation of lung tissue Treg cell expression of CD25, Helios, CTLA4, ICOS, and OX40 in Foxp3 YFPCre and Foxp3 YFPCre Notch4 Delta/Delta mice sampled on day 7 after poly(I:C) treatment (n = 5 for each time point). (E-H) Flow cytometry analysis (E and G) and graphical representation (F and H) of Helios expression in Foxp3 + Notch4 + and Foxp3 + Notch4 - lung tissue Treg cells in Foxp3 YFPCre mice sampled at the indicated dates after poly(I:C) treatment (n = 5 for each time point). Each symbol represents one mouse. Numbers in flow plots indicate percentages. Error bars indicate SEM. Statistical tests: pairwise comparisons of differential gene expression were computed using DESeq2 (A-C); Student''s unpaired two-tailed t test (D) and two-way ANOVA with Sidak''s post hoc analysis (F and H). * p < 0.05, ** p < 0.01, *** p < 0.001, **** p < 0.0001.

- Submitted by
- Invitrogen Antibodies (provider)
- Main image
- Experimental details
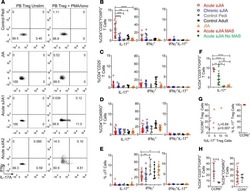
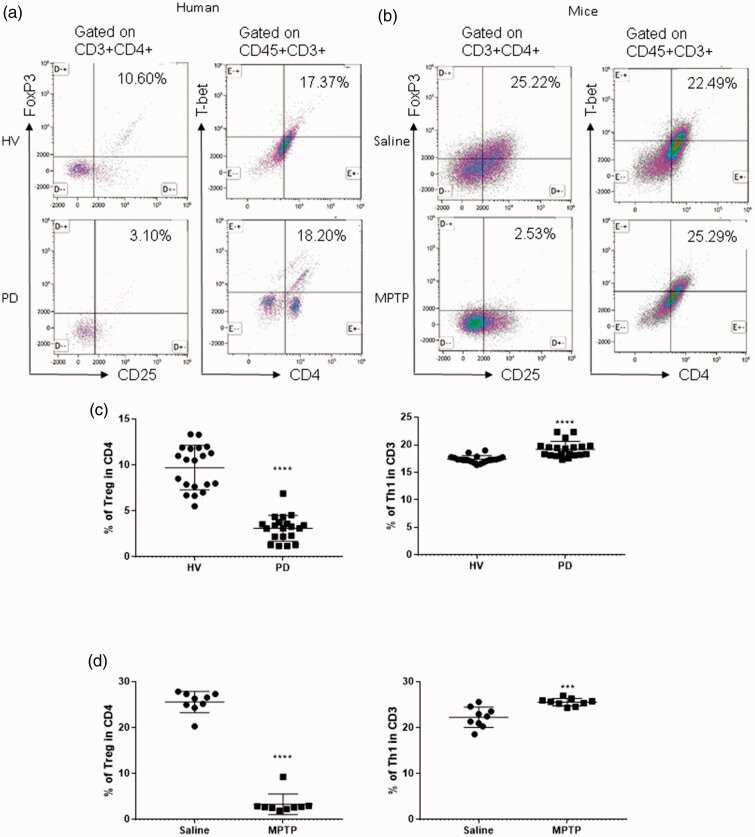
- Figure 1. Patients with Parkinson's disease (PD) and mice with experimental PD exhibit decreased regulatory T (Treg) and increased T helper 1 (Th1) cell numbers in the blood. Treg cells were defined as CD3+CD4+CD25+FoxP3+ cells, whereas Th1 cells were identified as CD3+CD4+T-bet+ cells. (a) Representative plots of Treg and Th1 cells in patients with PD and healthy volunteers (HVs). (b) Representative plots of Treg and Th1 cells in control mice (Saline) and 1-methyl-4-phenyl-1,2,3,6-tetrahydropyridine (MPTP)-treated mice. (c) Patients with PD exhibited lower Treg cell levels and greater Th1 cell levels in the blood than HVs. n = 20. ****, p < 0.0001 by a two-tailed Student's t tests. (d) MPTP-induced experimental PD mice had fewer Treg and more Th1 cells in the circulation than saline-treated mice. n = 9/group in each experiment performed in triplicate. ***, p < 0.001; ****, p < 0.0001, according to Student's t test.
- Submitted by
- Invitrogen Antibodies (provider)
- Main image
- Experimental details
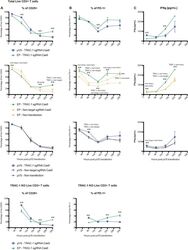
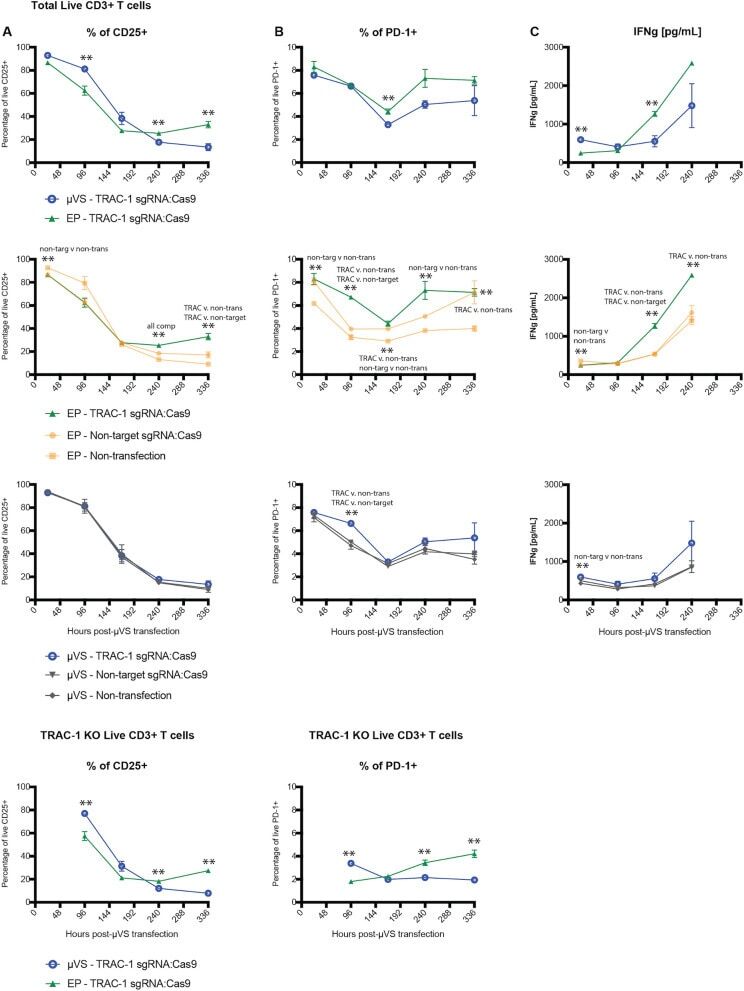
- Figure 4 Surface marker expression and cytokine secretion levels minimally perturbed with Cas9 and uVS . ( A ) CD25, and ( B ) PD-1 expression levels were quantified in cells transfected with uVS or electroporation. Surface marker expression levels were measured in the total live cell and TRAC-1 KO live population via flow cytometry at Days 1, 4, 7, 10 and 14 post-transfection. ( C ) ELISA quantification of IFNgamma supernatant levels in transfected and non-transfected cells at Day 1, 4, 7, and 10 post-transfection. Non-targeting gRNA as a Cas9-RNP complex served as a non-editing control. Cells mixed with P3 buffer (EP--non-transfection) or Opti-MEM buffer ( uVS --non-transfection) that were not transfected served as non-transfection controls for electroporation and uVS samples, respectively. Data represent mean +- SD of n = 3 samples per condition. *P < 0.05, **P < 0.01 by unpaired, two-tailed, heteroscedastic t tests. Figure generated using Adobe Illustrator Creative Cloud (adobe.com/products/illustrator.html) and GraphPad Prism 9 (graphpad.com/scientific-software/prism/).
- Submitted by
- Invitrogen Antibodies (provider)
- Main image
- Experimental details
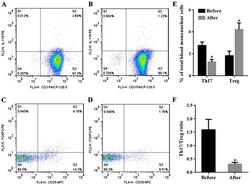
- Figure 1. The percentage of T helper 17 (Th17) and regulatory T (Treg) cells in peripheral blood mononuclear cells (PBMCs) and the Th17/Treg ratio varies in patients with a successful pregnancy after immunotherapy. The percentage of Th17 and Treg cells in PBMCs were detected by flow cytometry in patients with unexplained recurrent spontaneous abortion (URSA) before and after therapy. Representative CD3 + CD8 + IL-17A + flow cytometry plots from patients with URSA are shown (A) before and (B) after therapy. Representative CD4 + CD25 + Foxp3 + flow cytometry plots from patients with URSA are shown (C) before and (D) after therapy. (E) The percentage of Th17 cells in PBMCs significantly decreased after therapy. The percentage of Treg cells in PBMCs significantly increased after therapy (*P

- Submitted by
- Invitrogen Antibodies (provider)
- Main image
- Experimental details
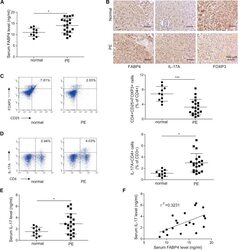
- Figure 1 Elevation of FABP4 is accompanied with Treg/Th17 imbalance in PE (A) The serum level of FABP4 was determined by ELISA (normal pregnant women, n = 10; PE, n = 20). (B) The immunoreactivities of FABP4, IL-17A, and FOXP3 in placental tissues were monitored by IHC analysis. (C and D) The percentages of Treg (C) and Th17 cells (D) in peripheral blood were assessed by FACS (normal pregnant women, n = 10; PE, n = 20). (E) The serum level of IL-17A was determined by ELISA (normal pregnant women, n = 10; PE, n = 20). (F) Pearson's correlation analysis between IL-17A and FABP4 expression. Data were representative images. *p < 0.05.

- Submitted by
- Invitrogen Antibodies (provider)
- Main image
- Experimental details
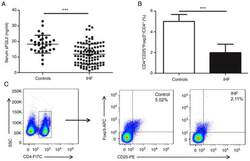
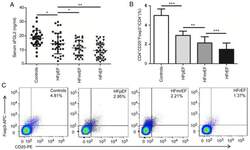
- Figure 1. Serum sFGL2 levels and circulating Tregs frequencies are decreased in patients with IHF. (A) Serum sFGL2 levels were analyzed by ELISA. (B) The frequency of Tregs was compared in each group. (C) Representative FSC/SSC pseudo-color density image shows the gated CD4 + T cells and representative fluorescence-activated cell sorting plots of CD4 + CD25 + Foxp3 + Tregs from a single patient in each group. ***P

- Submitted by
- Invitrogen Antibodies (provider)
- Main image
- Experimental details
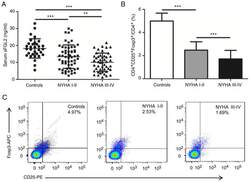
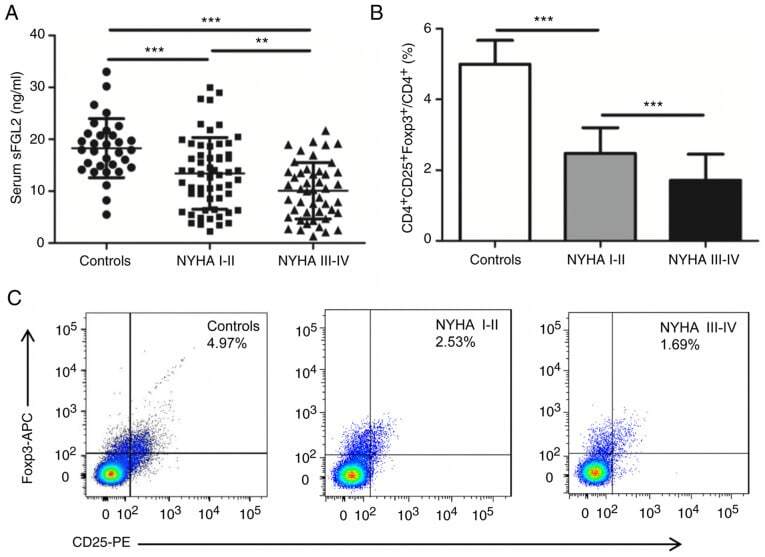
- Figure 2. Serum sFGL2 levels and circulating Tregs frequencies are decreased with the elevation of NYHA classification. (A) sFGL2 levels were analyzed by ELISA. (B) The proportion of Tregs was compared in each subgroup. (C) Representative fluorescence-activated cell sorting plots of CD4 + CD25 + Foxp3 + Tregs from a single person in each subgroup. **P
- Submitted by
- Invitrogen Antibodies (provider)
- Main image
- Experimental details
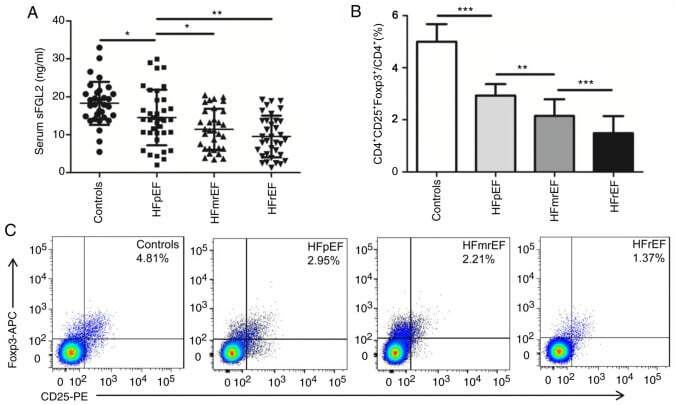
- Figure 3. Serum sFGL2 levels and circulating Tregs frequencies are decreased with the reduction of LVEF. (A) sFGL2 levels were analyzed by ELISA. (B) The proportion of Tregs was compared in each subgroup. (C) Representative fluorescence-activated cell sorting plots of CD4 + CD25 + Foxp3 + Tregs from a single person in each subgroup. *P
- Submitted by
- Invitrogen Antibodies (provider)
- Main image
- Experimental details
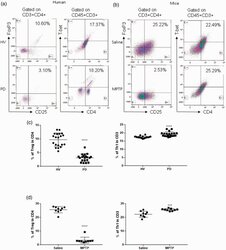
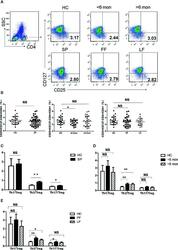
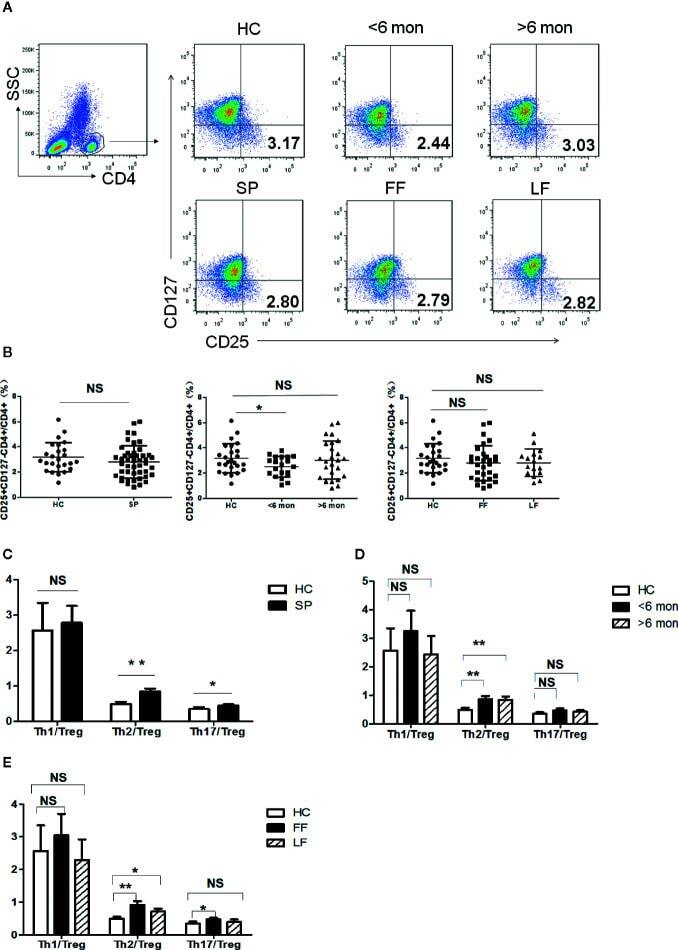
- Figure 2 Tregs' frequency and the ratio of effector T cells/Tregs in PBMCs of patients and HC. (A) PBMCs were stained with CD4, CD25 and CD127 mAbs. CD4 + T cells were gated according to CD4 staining and SSC and the proportion of CD4 + CD25 + CD127 - Tregs in CD4 + T cells were determined. The graphs are representative for patients, indicated subgroups and HC. Mean value of Tregs' percentage is shown in each target quadrant. (B-E) Statistical graphs for comparing Tregs' percentage and Th/Tregs ratios of the whole patients and indicated subgroups with HC. (SP, n = 46; SD, n = 20; LD, n = 26, FF, n = 30; LF, n = 16; HC, n = 25). Error bars represent mean+-SD. ** P < 0.01, * P < 0.05, and NS P >= 0.05.
- Submitted by
- Invitrogen Antibodies (provider)
- Main image
- Experimental details
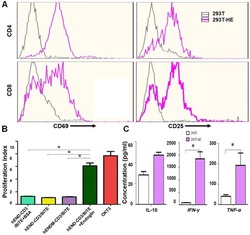
- Figure 3 hEND-CD3/BiTE activates T cells, stimulates T-cell proliferation, and increases secretion of Th1 cytokines. (A) PBMCs were co-cultured with 293T (grey signal) or 293T-hE (pink signal) cells in the presence of hEND-CD3/BiTE. The expression of T-cell activation markers CD69 (left panels) and CD25 (right panels) was detected in CD4 + (upper rows) and CD8 + (lower rows) by flow cytometry. (B) Proliferation of CFSE-labeled T cells in response to hEND-CD3/BiTE and other indicated reagents in the solid phase was measured using flow cytometry. The proliferation index was calculated using the ModFit LT software. (C) Supernatants were collected from the co-cultures of PBMCs with 293T (white bar) or 293T-hE cells (purple bar) in the presence of hEND-CD3/BiTE. The secretion of Th1 cytokines, including IFN-gamma, and TNF-alpha, and Th2 cytokine IL10 was measured using ELISA assays. * P < 0.001.

- Submitted by
- Invitrogen Antibodies (provider)
- Main image
- Experimental details
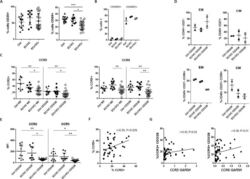
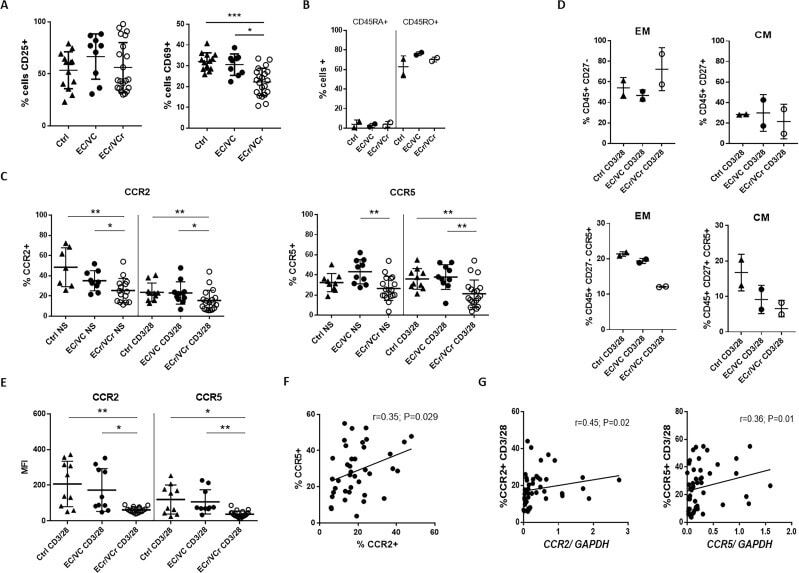
- 10.7554/eLife.44360.007 Figure 3. Lower proliferative responses and CCR2 and CCR5 cell surface levels in activated CD4 +T cells from ECr/VCrs. ( A ) Reduced CD69, but not CD25 levels in activated CD4 +T cells from ECr/VCrs. Graph shows representative data N = 13 (Ctrl), n = 9 (EC/VC) and n = 21 (ECr/VCr). ( B ) Comparable frequencies of naive CD45RA + and memory CD45RO + T cells after anti-CD3/CD28 activation between groups (n = 2 per group). ( C ) CCR5 and CCR2 cell surface levels measured by flow cytometry are reduced in freshly thawed (NS, non-stimulated) and activated CD4 +T cells (anti-CD3/28) from ECr/VCr. ( D ) Percentages of CCR5 +in effector memory (EM) and central memory (CM) compartments of activated CD4 +T cells (n = 2 per group). ( E ) Reduced CCR2 and CCR5 cell surface levels, expressed as MFI, in activated (anti-CD3/28) CD4 +T cells from ECr/VCr. Data in D-E shown pooled results from different experiments with n = 10 (Ctrl and EC/VC) and n = 19 (ECr/VCr). ( F ) Positive correlation between CCR2 and CCR5 cell surface levels. ( G ) Positive correlation observed between ccr2/ccr5 RNA levels and cell surface expression. Values obtained using the non-parametric Spearman correlation test. *p
- Submitted by
- Invitrogen Antibodies (provider)
- Main image
- Experimental details
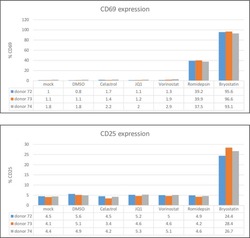
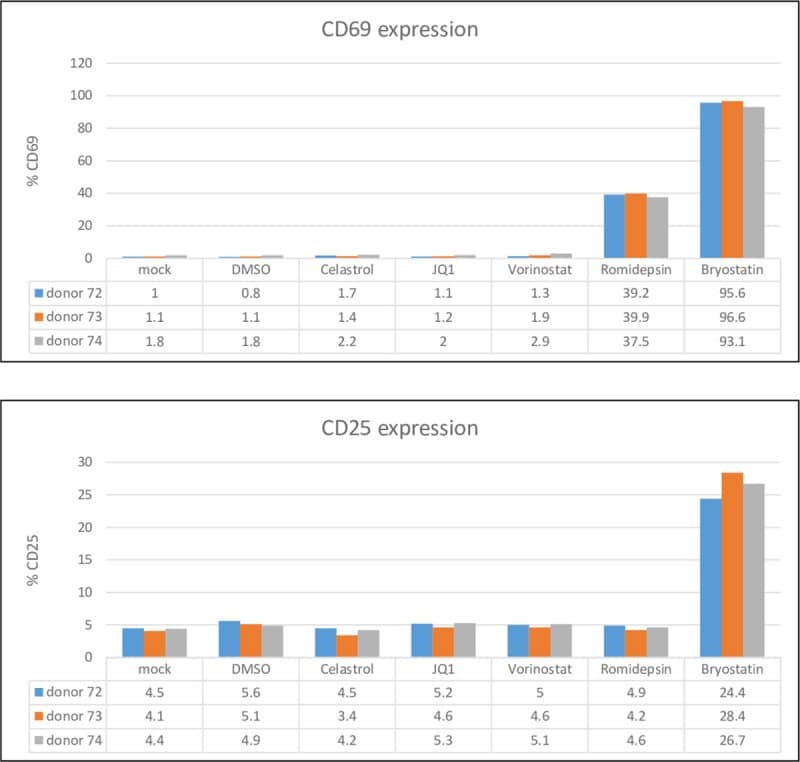
- 10.1371/journal.pone.0244771.g004 Fig 4 Celastrol does not activate resting CD4+ T cells. Resting CD4 + T cells were isolated from three healthy donors and treated with 400 nM celastrol, 200 nM JQ1, 400 nM vorinostat, 20 nM romidepsin, or 0.2 ng/ml bryostatin for 24 hours. Expression of CD25 and CD69 was quantified by flow cytometry.
- Submitted by
- Invitrogen Antibodies (provider)
- Main image
- Experimental details
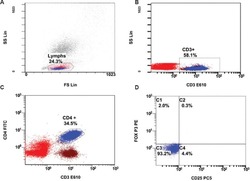
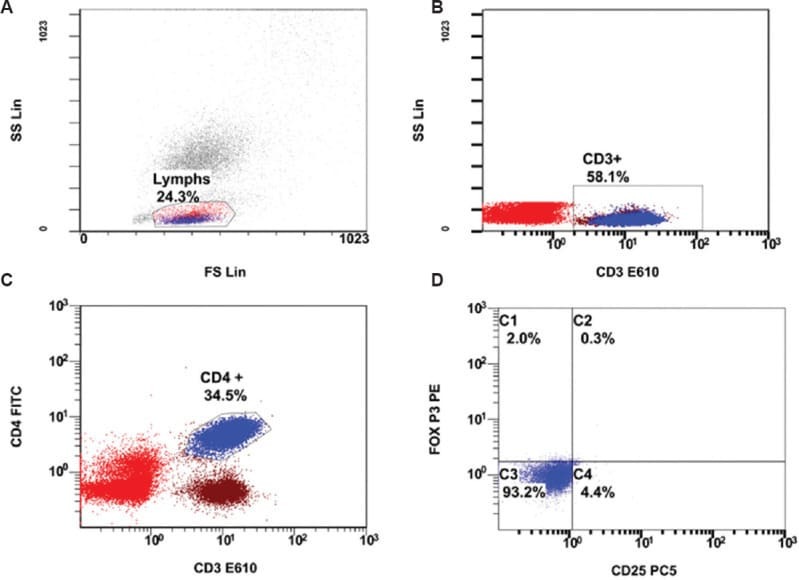
- Fig. 3 Flow cytometric analysis of CD4 + CD25 + FOXP3 + cells. ( A ) Lymphocytes are gated in forward light scatter (FS) vs. side light scatter (SS) dot plot, then ( B ) CD3+ cells gated in CD3- E610 vs. SS, followed by ( C ) CD4+ gating in CD3- E610 vs. CD4- FITC. ( D ) CD4+ cells gated are plotted CD25-PC5 vs. FoxP3-PE for assessing CD4+CD25+FoxP3+ (C2) cell expression.
- Submitted by
- Invitrogen Antibodies (provider)
- Main image
- Experimental details
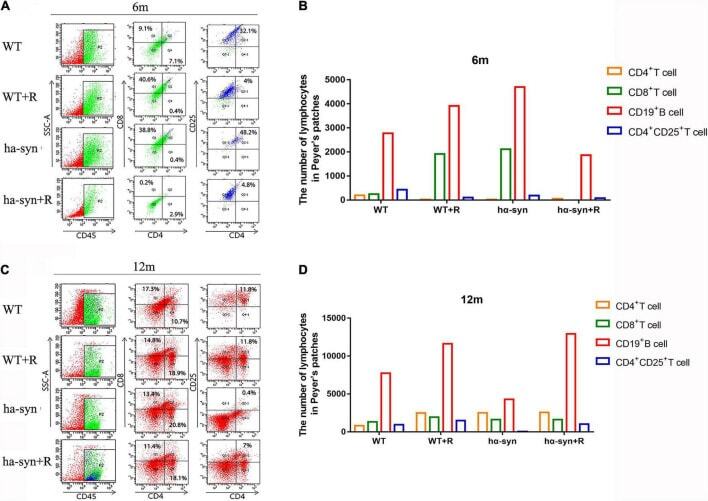
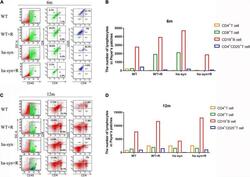
- FIGURE 6 The effect of rotenone on subpopulations of Peyer's patches lymphocytes in halpha-syn +/- mice. Flow cytometry was used to detect the changes in lymphocyte subsets, namely, CD4 + , CD8 + , and CD4 + CD25 + lymphocytes, respectively, in Peyer's patches in mice of different ages. (A) Changes of lymphocyte subsets in Peyer's patches of 6-month-old halpha-syn +/- mice by flow cytometry, n = 6. (B) Statistics of the number of cells in Peyer's patches of 6-month-old halpha-syn +/- mice. (C) Changes of lymphocyte subsets in Peyer's patches of 12-month-old halpha-syn +/- mice by flow cytometry, n = 6. (D) Statistics of the number of cells in Peyer's patches of 12-month-old halpha-syn +/- mice.