Explore
 Validate
 Learn
Learn Western blot
 Flow cytometry
Antibody data
- Antibody Data
- Antigen structure
- References [22]
- Comments [0]
- Validations
- Flow cytometry [1]
- Other assay [23]
Submit
Validation data
Reference
Comment
Report error
- Product number
- 14-1639-37 - Provider product page

- Provider
- Invitrogen Antibodies
- Product name
- CD163 Monoclonal Antibody (eBioGHI/61 (GHI/61)), eBioscience™
- Antibody type
- Monoclonal
- Antigen
- Other
- Description
- Description: The eBioGHI/61 monoclonal antibody reacts with human CD163 (Haemoglobin Scavenger Receptor, M130), a member of the macrophage scavenger receptor family. CD163 is expressed by tissue macrophages, circulating blood monocytes, and some reports suggest that it may also be expressed by haematopoietic progenitor cells. CD163 functions as a high affinity scavenger receptor for the complex of haemoglobin and haptoglobin which forms to clear haemoglobin from the blood. The high affinity for CD163 is specific for the haemoglobin-haptoglobin complex, whereas haemoglobin or haptoglobin display no to low affinity toward CD163. Upon ligand binding, CD163 initiates signal transduction which leads to the production of IL-6 and IL-10. Furthermore, it has been demonstrated that cytokines such as IL-6 and IL-10 can induce expression of CD163, whereas proinflammatory stimuli, such as LPS or TNF alpha, can cause shedding of a soluble form of CD163, whose function is unclear. Applications Reported: This eBioGHI/61 (GHI/61) antibody has been reported for use in flow cytometric analysis, and immunoblotting (WB). Applications Tested: This eBioGHI/61 (GHI/61) antibody has been tested by flow cytometric analysis of normal human peripheral blood cells. This can be used at less than or equal to 0.5 µg per test. A test is defined as the amount (µg) of antibody that will stain a cell sample in a final volume of 100 µL. Cell number should be determined empirically but can range from 10^5 to 10^8 cells/test. It is recommended that the antibody be carefully titrated for optimal performance in the assay of interest. Purity: Greater than 90%, as determined by SDS-PAGE. Aggregation: Less than 10%, as determined by HPLC. Filtration: 0.2 µm post-manufacturing filtered.
- Reactivity
- Human
- Host
- Mouse
- Isotype
- IgG
- Antibody clone number
- eBioGHI/61 (GHI/61)
- Vial size
- 2 mg
- Concentration
- 0.5 mg/mL
- Storage
- 4°C
Submitted references M1 macrophage-derived exosomes and their key molecule lncRNA HOTTIP suppress head and neck squamous cell carcinoma progression by upregulating the TLR5/NF-κB pathway.
M2-like tumor-associated macrophages transmit exosomal miR-27b-3p and maintain glioblastoma stem-like cell properties.
TcpC Inhibits M1 but Promotes M2 Macrophage Polarization via Regulation of the MAPK/NF-κB and Akt/STAT6 Pathways in Urinary Tract Infection.
A positive feedback loop: RAD18-YAP-TGF-β between triple-negative breast cancer and macrophages regulates cancer stemness and progression.
Pulmonary transplantation of alpha-1 antitrypsin (AAT)-transgenic macrophages provides a source of functional human AAT in vivo.
Extracorporeal Hemadsorption versus Glucocorticoids during Cardiopulmonary Bypass: A Prospective, Randomized, Controlled Trial.
Macrophages induce malignant traits in mammary epithelium via IKKε/TBK1 kinases and the serine biosynthesis pathway.
Patient iPSC-Derived Macrophages to Study Inborn Errors of the IFN-γ Responsive Pathway.
CCL5 derived from tumor-associated macrophages promotes prostate cancer stem cells and metastasis via activating β-catenin/STAT3 signaling.
Recruitment of monocytes and epigenetic silencing of intratumoral CYP7B1 primarily contribute to the accumulation of 27-hydroxycholesterol in breast cancer.
Regional Activation of Myosin II in Cancer Cells Drives Tumor Progression via a Secretory Cross-Talk with the Immune Microenvironment.
Biochanin a Enhances the Defense Against Salmonella enterica Infection Through AMPK/ULK1/mTOR-Mediated Autophagy and Extracellular Traps and Reversing SPI-1-Dependent Macrophage (MΦ) M2 Polarization.
TIM‑4 blockade of KCs combined with exogenous TGF‑β injection helps to reverse acute rejection and prolong the survival rate of mice receiving liver allografts.
Similarities and differences between helminth parasites and cancer cell lines in shaping human monocytes: Insights into parallel mechanisms of immune evasion.
Alternatively activated macrophages derived from THP-1 cells promote the fibrogenic activities of human dermal fibroblasts.
Immortalization of primary microglia: a new platform to study HIV regulation in the central nervous system.
Widespread Virus Replication in Alveoli Drives Acute Respiratory Distress Syndrome in Aerosolized H5N1 Influenza Infection of Macaques.
MicroRNA-720 suppresses M2 macrophage polarization by targeting GATA3.
The HIV-1 envelope protein gp120 is captured and displayed for B cell recognition by SIGN-R1(+) lymph node macrophages.
Microenvironments in tuberculous granulomas are delineated by distinct populations of macrophage subsets and expression of nitric oxide synthase and arginase isoforms.
Interleukin-25 fails to activate STAT6 and induce alternatively activated macrophages.
Heat shock protein 27 differentiates tolerogenic macrophages that may support human breast cancer progression.
Jiang H, Zhou L, Shen N, Ning X, Wu D, Jiang K, Huang X
Cell death & disease 2022 Feb 24;13(2):183
Cell death & disease 2022 Feb 24;13(2):183
M2-like tumor-associated macrophages transmit exosomal miR-27b-3p and maintain glioblastoma stem-like cell properties.
Zhao G, Ding L, Yu H, Wang W, Wang H, Hu Y, Qin L, Deng G, Xie B, Li G, Qi L
Cell death discovery 2022 Aug 4;8(1):350
Cell death discovery 2022 Aug 4;8(1):350
TcpC Inhibits M1 but Promotes M2 Macrophage Polarization via Regulation of the MAPK/NF-κB and Akt/STAT6 Pathways in Urinary Tract Infection.
Fang J, Ou Q, Wu B, Li S, Wu M, Qiu J, Cen N, Hu K, Che Y, Ma Y, Pan J
Cells 2022 Aug 28;11(17)
Cells 2022 Aug 28;11(17)
A positive feedback loop: RAD18-YAP-TGF-β between triple-negative breast cancer and macrophages regulates cancer stemness and progression.
Yan X, He Y, Yang S, Zeng T, Hua Y, Bao S, Yang F, Duan N, Sun C, Liang Y, Fu Z, Huang X, Li W, Yin Y
Cell death discovery 2022 Apr 12;8(1):196
Cell death discovery 2022 Apr 12;8(1):196
Pulmonary transplantation of alpha-1 antitrypsin (AAT)-transgenic macrophages provides a source of functional human AAT in vivo.
Janosz E, Hetzel M, Spielmann H, Tumpara S, Rossdam C, Schwabbauer M, Kloos D, von Kaisenberg C, Schambach A, Buettner FFR, Janciauskiene S, Lachmann N, Moritz T
Gene therapy 2021 Sep;28(9):477-493
Gene therapy 2021 Sep;28(9):477-493
Extracorporeal Hemadsorption versus Glucocorticoids during Cardiopulmonary Bypass: A Prospective, Randomized, Controlled Trial.
Taleska Stupica G, Sostaric M, Bozhinovska M, Rupert L, Bosnic Z, Jerin A, Ihan A, Klokocovnik T, Podbregar M
Cardiovascular therapeutics 2020;2020:7834173
Cardiovascular therapeutics 2020;2020:7834173
Macrophages induce malignant traits in mammary epithelium via IKKε/TBK1 kinases and the serine biosynthesis pathway.
Wilcz-Villega E, Carter E, Ironside A, Xu R, Mataloni I, Holdsworth J, Jones W, Moreno Béjar R, Uhlik L, Bentham RB, Godinho SA, Dalli J, Grose R, Szabadkai G, Jones L, Hodivala-Dilke K, Bianchi K
EMBO molecular medicine 2020 Feb 7;12(2):e10491
EMBO molecular medicine 2020 Feb 7;12(2):e10491
Patient iPSC-Derived Macrophages to Study Inborn Errors of the IFN-γ Responsive Pathway.
Haake K, Neehus AL, Buchegger T, Kühnel MP, Blank P, Philipp F, Oleaga-Quintas C, Schulz A, Grimley M, Goethe R, Jonigk D, Kalinke U, Boisson-Dupuis S, Casanova JL, Bustamante J, Lachmann N
Cells 2020 Feb 19;9(2)
Cells 2020 Feb 19;9(2)
CCL5 derived from tumor-associated macrophages promotes prostate cancer stem cells and metastasis via activating β-catenin/STAT3 signaling.
Huang R, Wang S, Wang N, Zheng Y, Zhou J, Yang B, Wang X, Zhang J, Guo L, Wang S, Chen Z, Wang Z, Xiang S
Cell death & disease 2020 Apr 16;11(4):234
Cell death & disease 2020 Apr 16;11(4):234
Recruitment of monocytes and epigenetic silencing of intratumoral CYP7B1 primarily contribute to the accumulation of 27-hydroxycholesterol in breast cancer.
Shi SZ, Lee EJ, Lin YJ, Chen L, Zheng HY, He XQ, Peng JY, Noonepalle SK, Shull AY, Pei FC, Deng LB, Tian XL, Deng KY, Shi H, Xin HB
American journal of cancer research 2019;9(10):2194-2208
American journal of cancer research 2019;9(10):2194-2208
Regional Activation of Myosin II in Cancer Cells Drives Tumor Progression via a Secretory Cross-Talk with the Immune Microenvironment.
Georgouli M, Herraiz C, Crosas-Molist E, Fanshawe B, Maiques O, Perdrix A, Pandya P, Rodriguez-Hernandez I, Ilieva KM, Cantelli G, Karagiannis P, Mele S, Lam H, Josephs DH, Matias-Guiu X, Marti RM, Nestle FO, Orgaz JL, Malanchi I, Fruhwirth GO, Karagiannis SN, Sanz-Moreno V
Cell 2019 Feb 7;176(4):757-774.e23
Cell 2019 Feb 7;176(4):757-774.e23
Biochanin a Enhances the Defense Against Salmonella enterica Infection Through AMPK/ULK1/mTOR-Mediated Autophagy and Extracellular Traps and Reversing SPI-1-Dependent Macrophage (MΦ) M2 Polarization.
Zhao X, Tang X, Guo N, An Y, Chen X, Shi C, Wang C, Li Y, Li S, Xu H, Liu M, Wang Y, Yu L
Frontiers in cellular and infection microbiology 2018;8:318
Frontiers in cellular and infection microbiology 2018;8:318
TIM‑4 blockade of KCs combined with exogenous TGF‑β injection helps to reverse acute rejection and prolong the survival rate of mice receiving liver allografts.
Wu H, Xu X, Li J, Gong J, Li M
International journal of molecular medicine 2018 Jul;42(1):346-358
International journal of molecular medicine 2018 Jul;42(1):346-358
Similarities and differences between helminth parasites and cancer cell lines in shaping human monocytes: Insights into parallel mechanisms of immune evasion.
Narasimhan PB, Akabas L, Tariq S, Huda N, Bennuru S, Sabzevari H, Hofmeister R, Nutman TB, Tolouei Semnani R
PLoS neglected tropical diseases 2018 Apr;12(4):e0006404
PLoS neglected tropical diseases 2018 Apr;12(4):e0006404
Alternatively activated macrophages derived from THP-1 cells promote the fibrogenic activities of human dermal fibroblasts.
Zhu Z, Ding J, Ma Z, Iwashina T, Tredget EE
Wound repair and regeneration : official publication of the Wound Healing Society [and] the European Tissue Repair Society 2017 May;25(3):377-388
Wound repair and regeneration : official publication of the Wound Healing Society [and] the European Tissue Repair Society 2017 May;25(3):377-388
Immortalization of primary microglia: a new platform to study HIV regulation in the central nervous system.
Garcia-Mesa Y, Jay TR, Checkley MA, Luttge B, Dobrowolski C, Valadkhan S, Landreth GE, Karn J, Alvarez-Carbonell D
Journal of neurovirology 2017 Feb;23(1):47-66
Journal of neurovirology 2017 Feb;23(1):47-66
Widespread Virus Replication in Alveoli Drives Acute Respiratory Distress Syndrome in Aerosolized H5N1 Influenza Infection of Macaques.
Wonderlich ER, Swan ZD, Bissel SJ, Hartman AL, Carney JP, O'Malley KJ, Obadan AO, Santos J, Walker R, Sturgeon TJ, Frye LJ Jr, Maiello P, Scanga CA, Bowling JD, Bouwer AL, Duangkhae PA, Wiley CA, Flynn JL, Wang J, Cole KS, Perez DR, Reed DS, Barratt-Boyes SM
Journal of immunology (Baltimore, Md. : 1950) 2017 Feb 15;198(4):1616-1626
Journal of immunology (Baltimore, Md. : 1950) 2017 Feb 15;198(4):1616-1626
MicroRNA-720 suppresses M2 macrophage polarization by targeting GATA3.
Zhong Y, Yi C
Bioscience reports 2016 Aug;36(4)
Bioscience reports 2016 Aug;36(4)
The HIV-1 envelope protein gp120 is captured and displayed for B cell recognition by SIGN-R1(+) lymph node macrophages.
Park C, Arthos J, Cicala C, Kehrl JH
eLife 2015 Aug 10;4
eLife 2015 Aug 10;4
Microenvironments in tuberculous granulomas are delineated by distinct populations of macrophage subsets and expression of nitric oxide synthase and arginase isoforms.
Mattila JT, Ojo OO, Kepka-Lenhart D, Marino S, Kim JH, Eum SY, Via LE, Barry CE 3rd, Klein E, Kirschner DE, Morris SM Jr, Lin PL, Flynn JL
Journal of immunology (Baltimore, Md. : 1950) 2013 Jul 15;191(2):773-84
Journal of immunology (Baltimore, Md. : 1950) 2013 Jul 15;191(2):773-84
Interleukin-25 fails to activate STAT6 and induce alternatively activated macrophages.
Stolfi C, Caruso R, Franzè E, Sarra M, De Nitto D, Rizzo A, Pallone F, Monteleone G
Immunology 2011 Jan;132(1):66-77
Immunology 2011 Jan;132(1):66-77
Heat shock protein 27 differentiates tolerogenic macrophages that may support human breast cancer progression.
Banerjee S, Lin CF, Skinner KA, Schiffhauer LM, Peacock J, Hicks DG, Redmond EM, Morrow D, Huston A, Shayne M, Langstein HN, Miller-Graziano CL, Strickland J, O'Donoghue L, De AK
Cancer research 2011 Jan 15;71(2):318-27
Cancer research 2011 Jan 15;71(2):318-27
No comments: Submit comment
Supportive validation
- Submitted by
- Invitrogen Antibodies (provider)
- Main image
- Experimental details
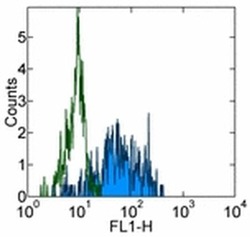
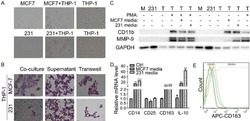
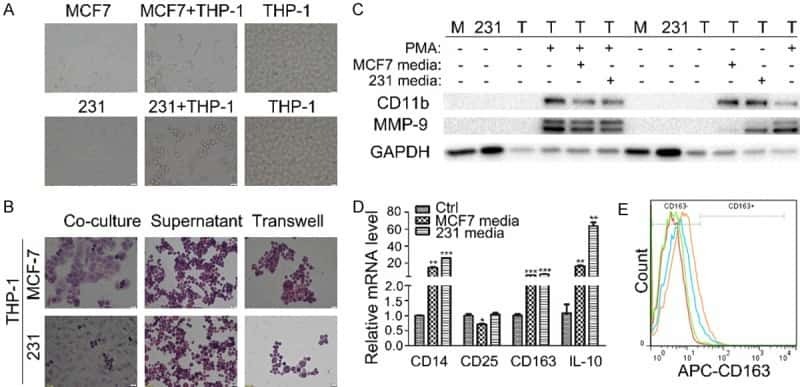
- Staining of normal human peripheral blood cells with 0.25 µg of Mouse IgG1 K Isotype Control Purified (Product # 14-4714-82) (open histogram) or 0.25 µg of Anti-Human CD163 Purified (filled histogram) followed by Anti-Mouse IgG FITC (Product # 11-4011-85). Cells in the monocyte gate were used for analysis.

Supportive validation
- Submitted by
- Invitrogen Antibodies (provider)
- Main image
- Experimental details
- NULL
- Submitted by
- Invitrogen Antibodies (provider)
- Main image
- Experimental details
- NULL
- Submitted by
- Invitrogen Antibodies (provider)
- Main image
- Experimental details
- NULL

- Submitted by
- Invitrogen Antibodies (provider)
- Main image
- Experimental details
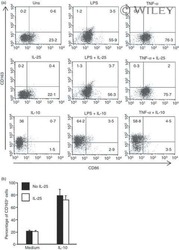
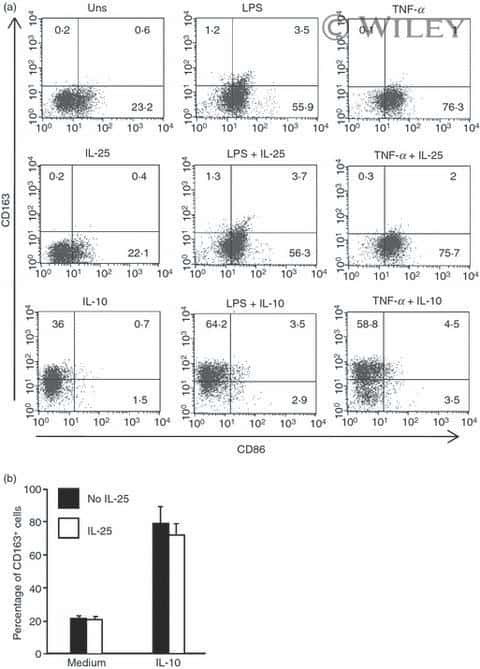
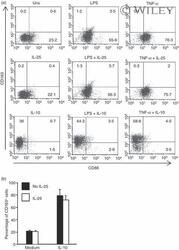
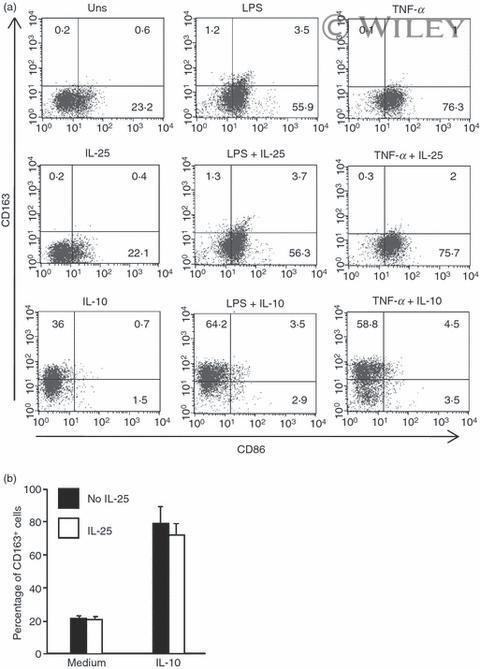
- 5 Interleukin-25 (IL-25) does not alter the expression of CD163 and CD86 in human CD14 + cells. (a) Representative dot-plots showing the expression of CD163 and CD86 in CD14 + cells pre-incubated with medium, IL-25 (50 ng/mL) or IL-10 (25 ng/ml) for 30 min and then either left unstimulated (Uns) or stimulated with lipopolysaccharide (LPS; 100 ng/ml) or tumour necrosis factor-alpha (TNF-alpha; 10 ng/ml). After 12 hr, CD23 and CD163 expression was assessed by flow cytometry. Numbers indicate the percentage of positive cells within the designated quadrants. One of three representative experiments in which similar results were obtained is shown. (b) Induction of CD163 by IL-10 is not influenced by IL-25. Representative histograms showing the percentage of CD14 + cells positive for CD163. Cells were pre-incubated with IL-25 (50 ng/ml) for 6 hr and then stimulated with IL-10 (25 ng/ml) for a further 24 hr. Data indicate the mean +- SD of three experiments.
- Submitted by
- Invitrogen Antibodies (provider)
- Main image
- Experimental details
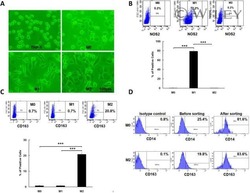
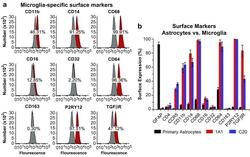
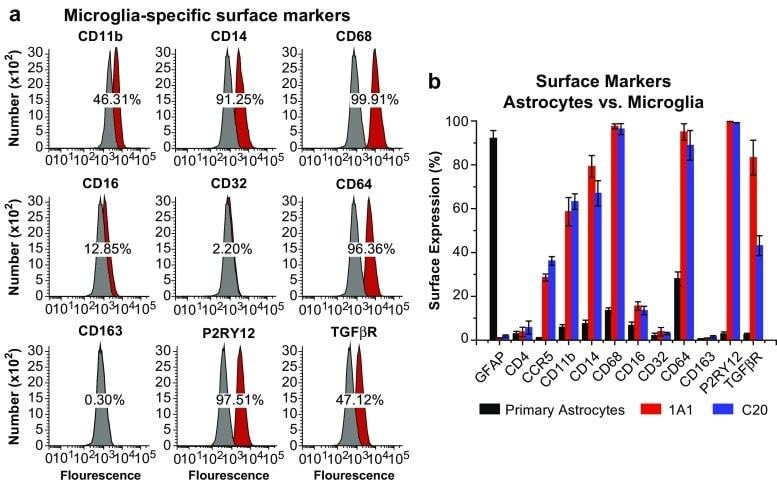
- Fig. 6 Surface expression of key markers of microglia. a Flow cytometry analysis was used to measure the surface expression of CD11b, CD14, CD68, CD16, CD32, CD64, CD163, P2RY12, and TGFbetaR on the representative immortalized cell line hmuglia 1A1. In each experiment, 100,000 cells were resuspended in 1 mL of cold PBS in the presence of 0.5 mug of the antibody or isotype control for 20 min on ice. Appropriate secondary antibodies were used in the absence of fluorophore-conjugated primary antibody, and the cell-antibody complexes were centrifuged and resuspended in PBS. In each FACS profile, the gray distributions represent the proportion of cells bound to the isotype control, whereas the red distributions represent the proportions of cells bound by the target antibody. b Quantification of the abovementioned markers as well as GFAP, CD4, and CCR5 on the surface of primary human astrocytes and immortalized microglia, as indicated
- Submitted by
- Invitrogen Antibodies (provider)
- Main image
- Experimental details
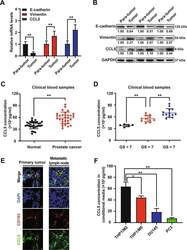
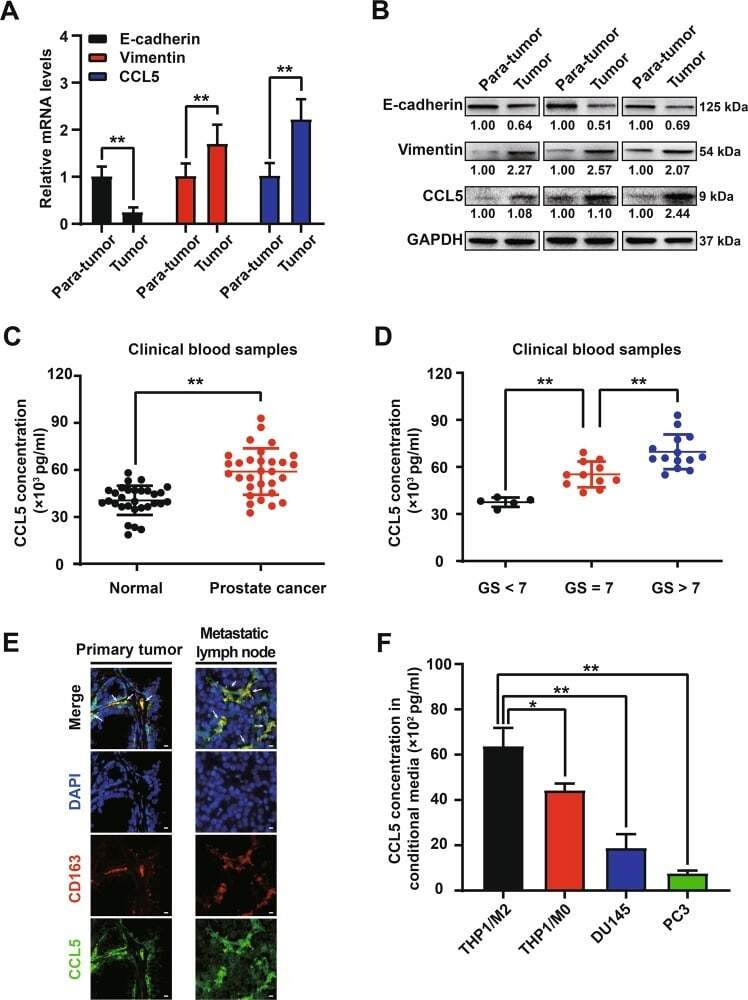
- Fig. 1 TAMs-derived CCL5 was elevated in prostate cancer and associated with metastasis. a , b The mRNA and protein expression differences of indicated genes between prostate cancer tumor tissues and para-carcinoma tissues ( n = 3). c Elisa assay indicated that the blood samples of prostate cancer patients ( n = 30) exhibited elevated expression of CCL5 when compared with that of healthy male participants ( n = 30). d Prostate cancer patients with higher Gleason grade exhibited an increased CCL5 accumulation in the blood ( n = 30). e Tissue immunofluorescence assay suggested that CCL5 and the macrophage marker CD163 were co-localized in both the primary tumor and metastatic lymph node of prostate cancer patients. Scale bar, 10 mum. f TAMs exhibited increased secretion of CCL5 than immature macrophages or prostate cancer cells. CCL5 concentrations in the cell culture supernatants of THP1-derived macrophages (M0), THP1-derived TAMs (M2), DU145 and PC3 cells were measured using Elisa method ( n = 10). All values are presented as the mean +- SD. * p < 0.05, ** p < 0.01.
- Submitted by
- Invitrogen Antibodies (provider)
- Main image
- Experimental details
- Figure 3 CD64 and CD163 expression on monocytes, granulocytes, and lymphocytes.
- Submitted by
- Invitrogen Antibodies (provider)
- Main image
- Experimental details
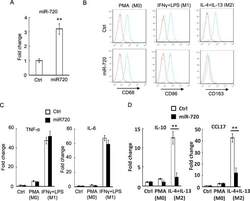
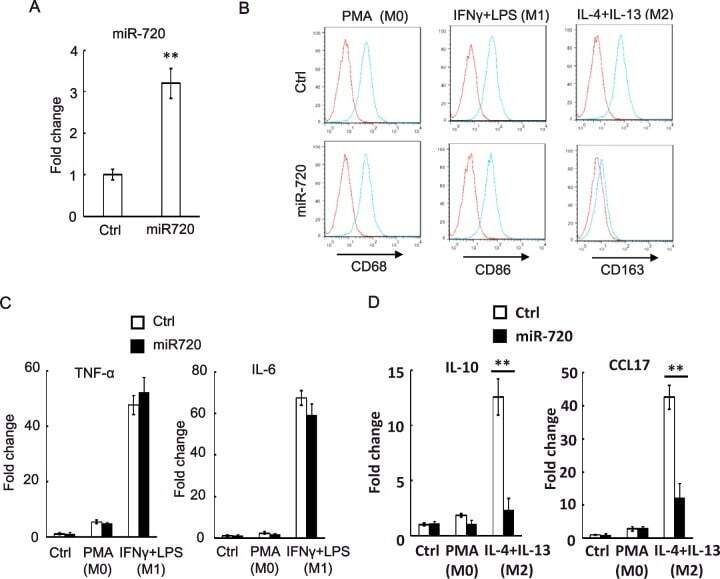
- Figure 2 miR-720 suppresses the expression of M2 phenotypes ( A ) Real-time PCR analysis of miR-720 expression in control vector or pLV- miR-720 -infected THP-1 cells. ( B ) Control or pLV- miR-720 -infected THP-1 cells were induced macrophage differentiation by PMA (M0) and then treated with IFN-gamma plus LPS (M1) or IL-4 plus IL-13 (M2) to induce polarization. The macrophage marker CD68, M1 marker CD86 and M2 marker CD163 were analysed by flow cytometry respectively. ( C ) Detection of M1 cytokine TNF-alpha and IL-6 or ( D ) M2 cytokine IL-10 and chemokine CCL17 by real-time PCR in THP-1 cells used in ( B ). Values are means +- S.D. ** P
- Submitted by
- Invitrogen Antibodies (provider)
- Main image
- Experimental details
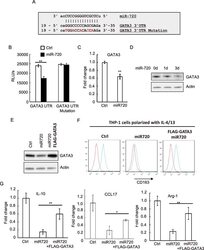
- Figure 3 miR-720 targets GATA3 to regulate M2 polarization ( A ) The 3'UTR of the GATA mRNA containing the putative miR-720 -binding sequence is shown. Mutation was generated in the GATA 3'UTR sequence at the complementary site for the seed region of miR-720 . ( B ) HEK-293 cells were co-transfected with wild-type or mutant GATA3 3'UTR luciferase reporter together with control or pLV- miR-720 construct. Luciferase assays were performed after 24 h. ( C ) The mRNA or ( D ) protein expression levels of GATA3 in both control and pLV- miR-720 -infected THP-1 cells were analysed by real-time PCR or western blotting respectively. ( E ) Western blotting analysis of GATA3 expression in control, pLV- miR-720 -infected or pLV- miR-720 -infected plus FLAG-GATA3 transfected THP-1 cells. ( F ) The cells used in ( E ) were polarized with IL-4/IL-13 and the M2 marker CD163 was analysed by flow cytometry. ( F ) The expression of IL-10, CCL17 and Arginase-1 in the cells used in ( E ) was analysed by real-time PCR. Values are means +- S.D. ** P
- Submitted by
- Invitrogen Antibodies (provider)
- Main image
- Experimental details
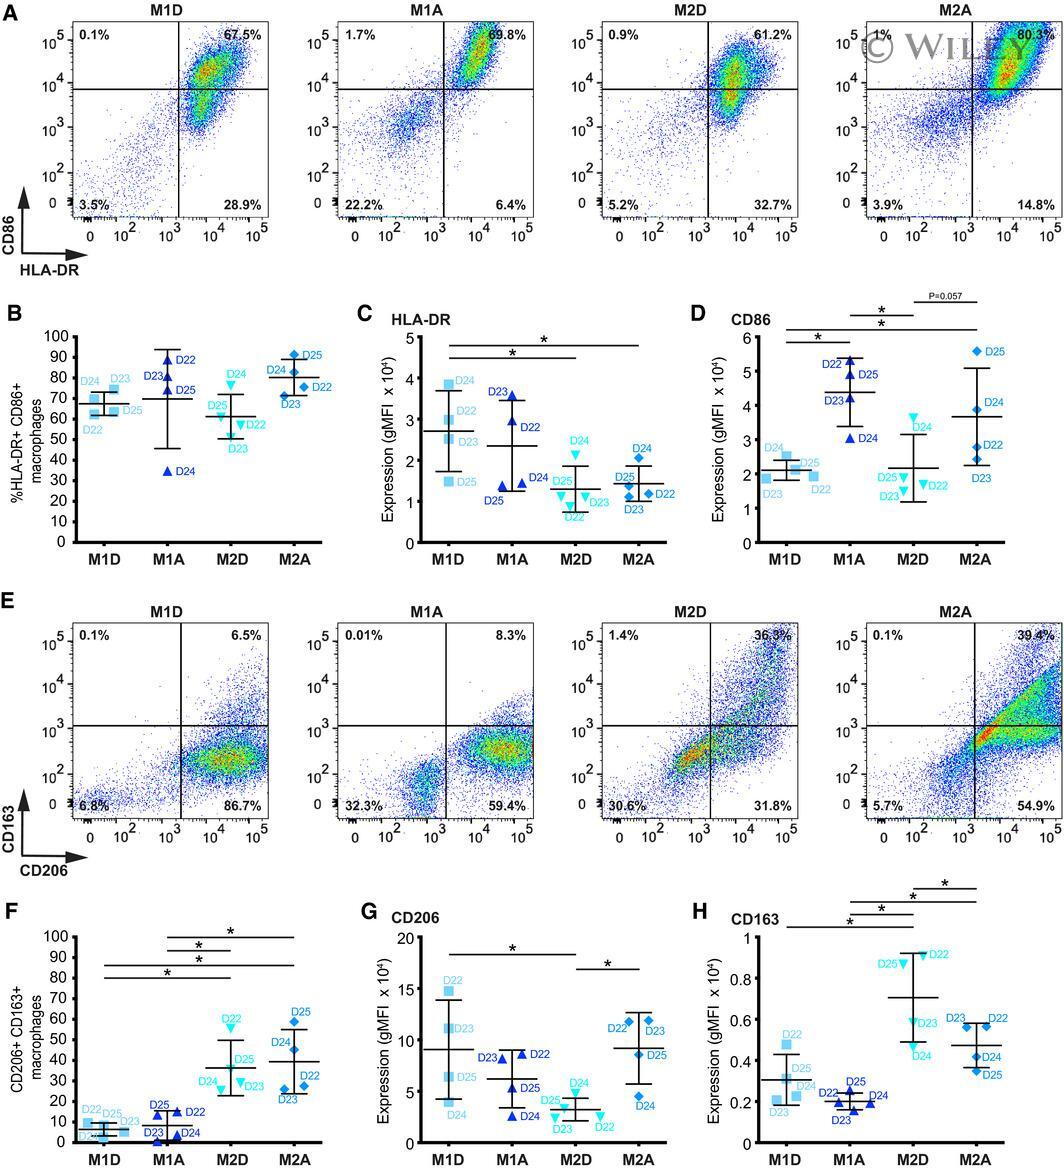
- EV2 Flow cytometry analysis of macrophage populations A Representative images showing FACS dot plots for HLA-DR + /CD86 + macrophages. Average frequencies of 4 donors are shown. B Quantification of HLA-DR + /CD86 + macrophages across macrophage populations. Lines and error bars represent mean +- SD from two independent experiments (2 macrophage donors each). C, D Expression levels (geometric mean of fluorescent intensity, gMFI) of (C) HLA-DR and (D) CD86 in HLA-DR + /CD86 + macrophages across macrophage populations. Lines and error bars represent mean +- SD from two independent experiments (2 macrophage donors each). E Representative images showing FACS dot plots for CD206 + /CD163 + macrophages. Average frequencies of 4 donors are shown. F Quantification of CD206 + /CD163 + macrophages across macrophage populations. Lines and error bars represent mean +- SD from two independent experiments (2 macrophage donors each). G, H Expression levels (geometric mean of fluorescent intensity, gMFI) of (G) CD206 and (H) CD163 in CD206 + /CD163 + macrophages across macrophage populations. Lines and error bars represent mean +- SD from two independent experiments (2 macrophage donors each). Data information: Macrophage donors are indicated as D22-D25. M2D-M2-differentiated, M1A-M1-activated, M2D-M2-differentiated, M2A-M2-activated. * P < 0.05 as measured by one-way ANOVA with uncorrected Fisher''s LSD post hoc test (exact P values are shown in Table EV3). Source data are available online f
- Submitted by
- Invitrogen Antibodies (provider)
- Main image
- Experimental details
- 5 Interleukin-25 (IL-25) does not alter the expression of CD163 and CD86 in human CD14 + cells. (a) Representative dot-plots showing the expression of CD163 and CD86 in CD14 + cells pre-incubated with medium, IL-25 (50 ng/mL) or IL-10 (25 ng/ml) for 30 min and then either left unstimulated (Uns) or stimulated with lipopolysaccharide (LPS; 100 ng/ml) or tumour necrosis factor-alpha (TNF-alpha; 10 ng/ml). After 12 hr, CD23 and CD163 expression was assessed by flow cytometry. Numbers indicate the percentage of positive cells within the designated quadrants. One of three representative experiments in which similar results were obtained is shown. (b) Induction of CD163 by IL-10 is not influenced by IL-25. Representative histograms showing the percentage of CD14 + cells positive for CD163. Cells were pre-incubated with IL-25 (50 ng/ml) for 6 hr and then stimulated with IL-10 (25 ng/ml) for a further 24 hr. Data indicate the mean +- SD of three experiments.
- Submitted by
- Invitrogen Antibodies (provider)
- Main image
- Experimental details
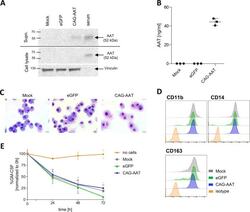
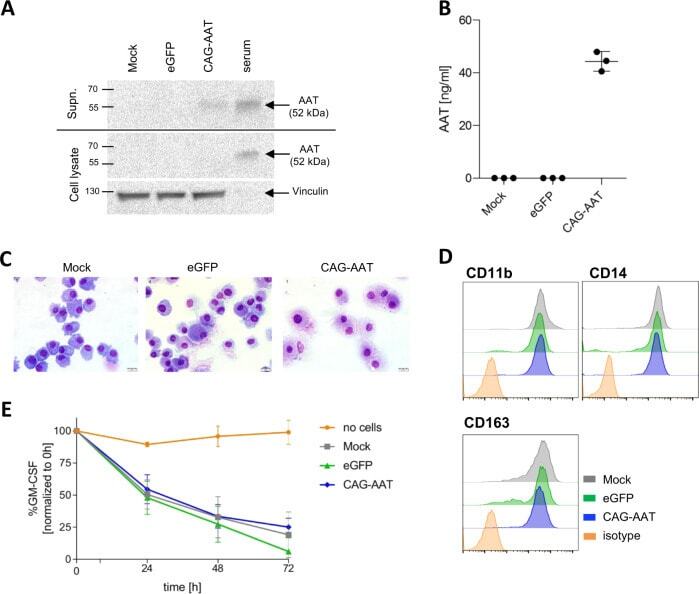
- Fig. 5 Expression of AAT in human MPhi. A Representative AAT western blot analysis of human MPhi supernatant and MPhi lysates. Human serum was used as a positive control. Vinculin band in cellular lysates served as loading control. B ELISA quantification of AAT secretion by human MPhi. n = 3. C Representative May-Grunwald-Giemsa staining of MPhi cytospins. Scale bar = 20 mum. D Representative flow cytometric analysis of myeloid and MPhi-specific surface marker expression by human MPhi. E GM-CSF uptake from cell culture medium by MPhi. A well without cells was used as a negative control. n = 3. All data represent independent cell isolations and transductions.
- Submitted by
- Invitrogen Antibodies (provider)
- Main image
- Experimental details
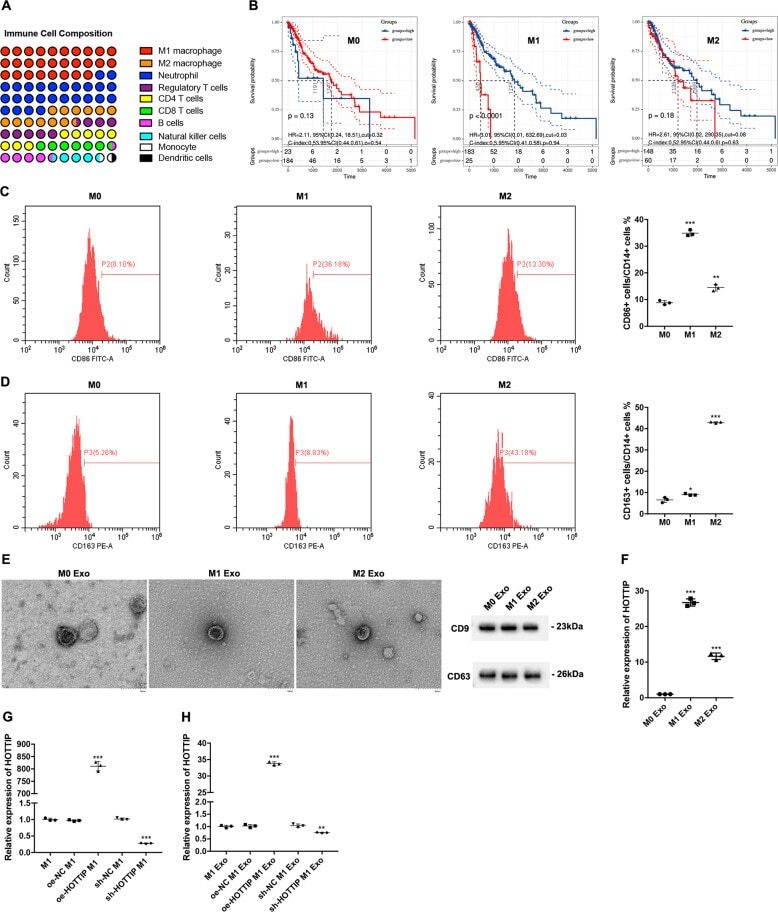
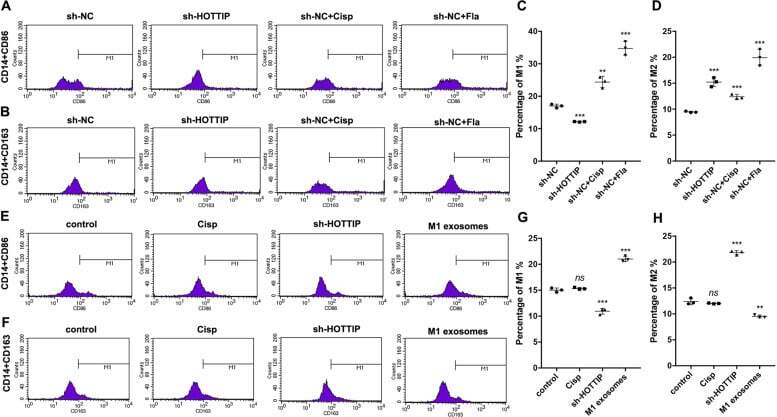
- The correlation between TAMs and HNSCC prognosis and the establishment of HOTTIP overexpression and knockdown exosomes in M1. A The infiltration levels of immune cells in HNSCC. B Prediction of overall survival according to high- and low-infiltration levels of M0, M1 and M2 macrophages. THP-1-derived M0, M1 and M2 macrophages were confirmed by flow cytometry using ( C ) CD14 plus CD86 and ( D ) CD14 plus CD163 ( n = 3). E The exosomes were extracted from three types of macrophages and confirmed by electronic microscopy and Western blot analysis using CD9 and CD63. F RT-qPCR was conducted to test the expression of HOTTIP in M0, M1 and M2 macrophages ( n = 3). RT-qPCR was conducted to test the expression of HOTTIP in wild type M1 macrophages, HOTTIP-overexpressed and HOTTIP-knockdown M1 macrophages ( G ) and their exosomes ( H ) ( n = 3). Data are presented as mean +- SD. Results were analyzed by One-way ANOVA with a post hoc t -test. Significance: * P < 0.05, ** P < 0.01, *** P < 0.001.
- Submitted by
- Invitrogen Antibodies (provider)
- Main image
- Experimental details
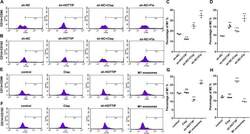
- Cancer cells expressing HOTTIP and M1 exosomes reprogram the circulating monocytes into M1 phenotype. A-D Flow cytometry assay detected CD14 + CD86 + M1 and CD14 + CD163 + M2 phenotype in circulating blood of nude mice bearing with HOTTIP-knockdown Hep-2 cells ( n = 3). HOTTIP-knockdown Hep-2 cells suppressed the polarization of M1 monocytes ( A , C ) but induced the polarization of M2 ( B , D ). E - H Flow cytometry assay detected M1 and M2 phenotypes in the blood of tumor-bearing nude mice treated by M1 exosomes ( n = 3). M1 exosomes induced the polarization of M1 monocytes ( E , G ) but inhibited the polarization of M2 ( F , H ). Data are presented as mean +- SD. Results were analyzed by One-way ANOVA with a post hoc test. Significance: ns not significant, ** P < 0.01, *** P < 0.001.
- Submitted by
- Invitrogen Antibodies (provider)
- Main image
- Experimental details
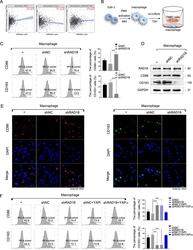
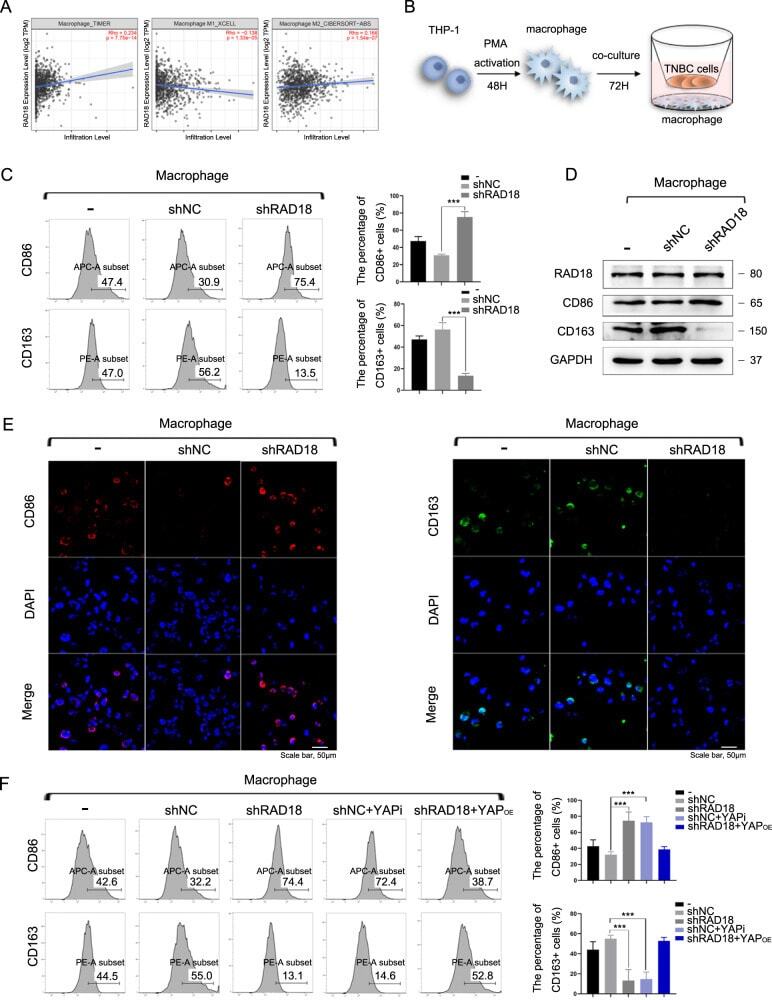
- Fig. 4 RAD18-driven YAP activation in TNBC cells promotes M2-like TAM polarization. A The Timer software showed that high-expressed RAD18 was correlated with high-level macrophage infiltration in BRCA. RAD18 expression level was proportional to M2-like TAM infiltration, whereas inversely proportional to M1-like TAM infiltration. B Schematic model of the co-culture system of macrophages and TNBC cells; THP-1 cells were stimulated by PMA for 48 h to form M0 macrophages, then MDA-MB-231 cells stably expressing shNC or shRAD18 were co-cultured with M0 macrophages for 72 h. The M0 alone were used as a negative control. C Detection of the expression of CD86 (M1-like macrophage marker) and CD163 (M2-like macrophage marker) in co-cultured macrophages by Flow cytometry analysis. D WB detection of protein expression of CD86 and CD163 in macrophages after co-culture. E The expressions of CD86 (red) and CD163 (green) in macrophages were detected using immunofluorescence staining (400x). Cell nuclei were stained with DAPI (blue). F The expression of CD86 and CD163 in macrophages co-cultured with the shNC TNBC treated with verteporfin or the shRAD18 TNBC treated with YAP OE plasmid were detected by flow cytometry analysis. * p < 0.05, ** p < 0.01, *** p < 0.001. All experiments were performed independently at least three times.
- Submitted by
- Invitrogen Antibodies (provider)
- Main image

- Experimental details
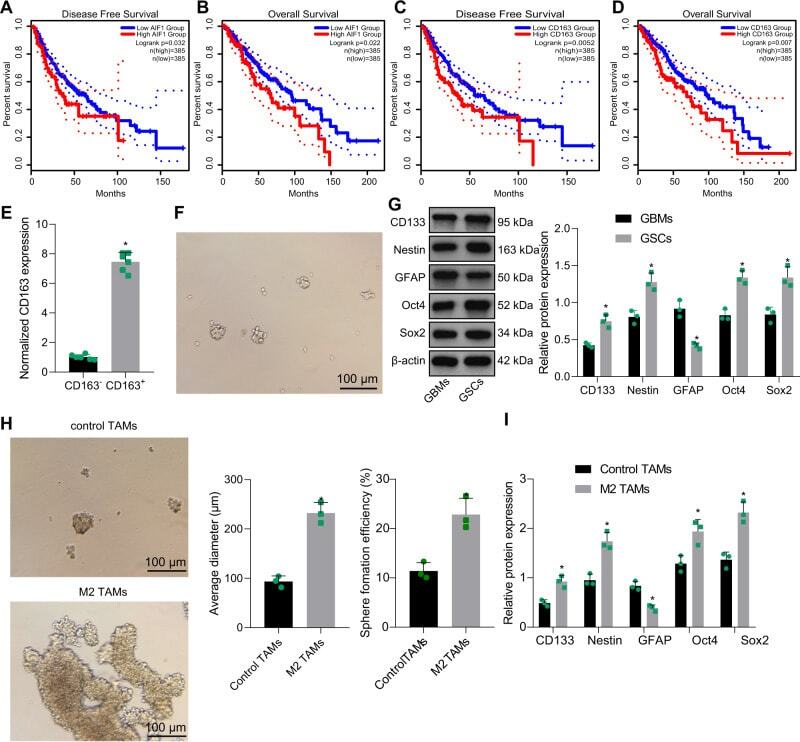
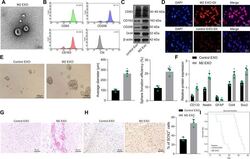
- Fig. 1 M2-TAMs maintain the properties of GSCs. Kaplan-Meier survival analysis of progression-free survival ( A ) and overall survival ( B ) of GBM patients with low or high Iba1 expression using GEPIA ( http://gepia2.cancer-pku.cn/#index ) in TCGA database ( https://portal.gdc.cancer.gov/ ). Kaplan-Meier survival analysis of progression-free survival ( C ) and overall survival ( D ) of GBM patients with high or low CD163 expression using GEPIA in TCGA database. E RT-qPCR was utilized to analyze the expression of CD163 in the CD11b + /CD163 + and CD11b + /CD163 - TAMs from 6 GBM patients sorted by FACS. F The morphology of GSCs. G Western blot analysis of stem cell-related proteins CD133, Nestin, Oct4, Sox2, and GFAP. H Representative images showing neurosphere formation of GSCs along with the statistics of GSC neurosphere formation rate and diameter. I Expression of stem cell-related protein CD133, Nestin, Oct4, Sox2 and GFAP in GSCs measured by Western blot analysis. * p < 0.05 vs. CD163, GBMs or control TAMs. Measurement data were depicted as mean +- standard deviation, and comparison of data between two groups was conducted by unpaired t test. Cell experiments were repeated three times independently.
- Submitted by
- Invitrogen Antibodies (provider)
- Main image
- Experimental details
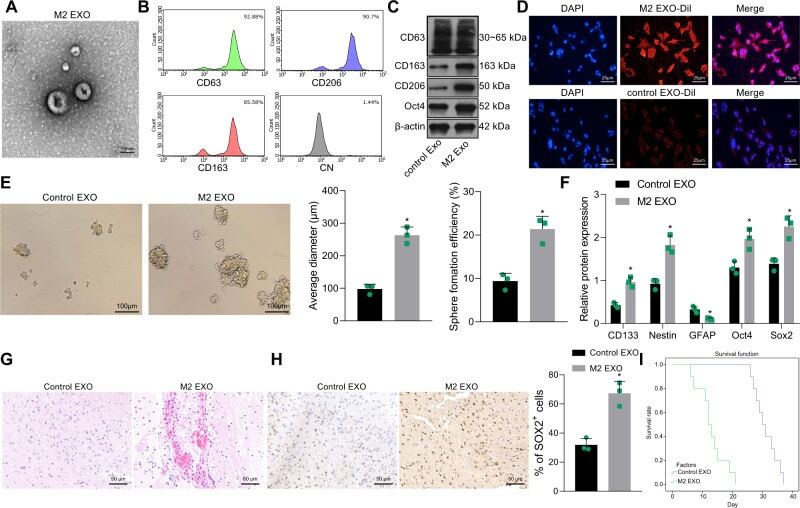
- Fig. 2 M2-TAM-derived exosomes enhance the stemness of GSCs. A TEM images of M2-TAM-derived exosomes. The presence of CD63, CD206, and CD163 in M2-TAM-derived exosomes analyzed by flow cytometric ( B ) and Western blot ( C ) analyses. D Fluorescence images of GSCs co-cultured with Dil-labeled M2-TAM-derived exosomes with nuclei stained with DAPI (blue). E Representative images showing neurosphere formation of GSCs along with the statistics of GSC formation rate and diameter of spheres. F Expression of stem cell-related protein CD133, Nestin, Oct4, Sox2, and GFAP in GSCs measured by Western blot analysis. G HE staining images of xenograft tumors from mice. H The representative immunohistochemical images of Sox2 in xenograft tumors and the percentage of GSCs labeled by Sox2. I Kaplan-Meier survive curve of tumor-bearing mice. n = 10. * p < 0.05 vs. the control EXO group. Measurement data were depicted as mean +- standard deviation, comparison of that between two groups was conducted by unpaired t test. Cell experiments were repeated three times independently.
- Submitted by
- Invitrogen Antibodies (provider)
- Main image
- Experimental details
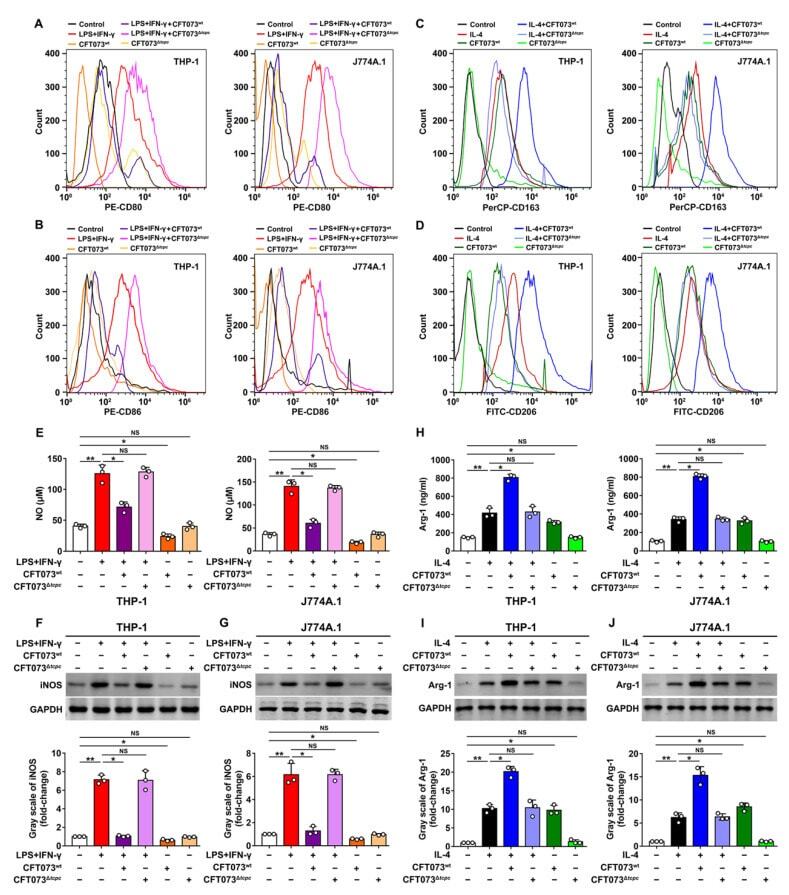
- Figure 3 CFT073 wt suppresses M1 but promotes M2 macrophage polarization in vitro. ( A , B ) The expression of M1 surface markers CD80 and CD86 in THP-1 and J774A.1 was detected by flow cytometry. ( C , D ) The expression of M2 surface markers CD163 and CD206 in THP-1 and J774A.1 was analyzed by flow cytometry. ( E ) The production of NO in THP-1 and J774A.1 was measured by Griess method. ( F , G ) The iNOS protein levels and bands' gray-scale analyses in THP-1 and J774A.1, respectively. ( H ) The protein levels of Arg-1 in THP-1 and J774A.1 were detected by ELISA. ( I , J ) The protein levels of Arg-1 were detected by Western blot and bands' gray-scale analyses in THP-1 and J774A.1, respectively. Gray scale in the control group was set as 1.0. Mean +- SD of three independent experiments are shown. *: p < 0.05; **: p < 0.01. NS: not significant.
- Submitted by
- Invitrogen Antibodies (provider)
- Main image
- Experimental details
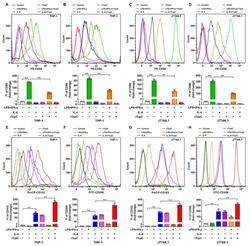
- Figure 4 rTcpC inhibits M1 markers CD80 and CD86 but promotes the expression of M2 markers CD163 and CD206 in macrophages. ( A - D ) The effects of rTcpC on M1 surface markers CD80 and CD86 detected by flow cytometry and FI were analyzed by FlowJo v10.0.7 software. ( E - H ) The surface markers CD163 and CD206 of M2 polarized macrophages were detected by flow cytometry. Mean +- SD of three independent experiments are shown. **: p < 0.01.
- Submitted by
- Invitrogen Antibodies (provider)
- Main image
- Experimental details
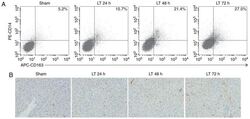
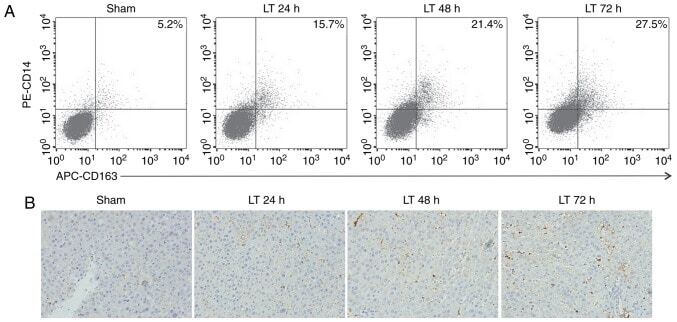
- Figure 1 Orthotopic liver transplantation increases KC activation and TIM-4 expression. (A) KCs were isolated from mice in the sham and LT groups 24, 48 and 72 h following surgery. Cells were double stained with PE-CD14 and APC-CD163 and quantified using flow cytometry. (B) Liver samples were obtained from mice in the sham and LT groups and assessed using immunohistochemistry (magnification, x400). Activated hepatic KCs are stained brown. (C) KCs were isolated from mice in the sham and LT groups 1, 3 and 7 days following surgery and TIM-4 expression was analyzed using western blotting. Data are presented as the mean +- standard deviation. a P
- Submitted by
- Invitrogen Antibodies (provider)
- Main image
- Experimental details
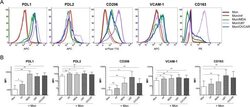
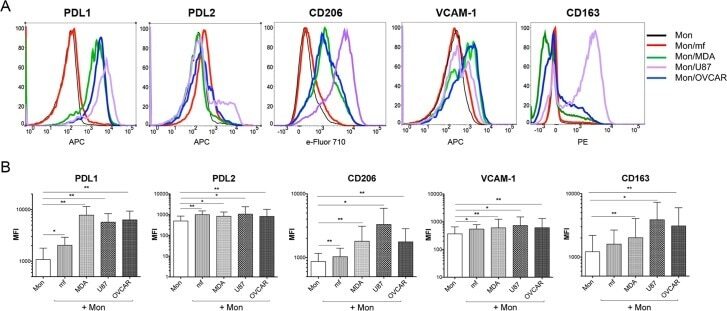
- Fig 3 Cancer cell lines and mf significantly upregulates the cell surface expressions of PDL1, PDL2, CD206 and VCAM-1 on human monocytes. Human monocytes were cultured in media alone, or with CMFDA-labeled three different cancer cell lines (MDA, OVCAR, U87), or with live mf of Brugia malayi for 48hr. Cells were harvested and cell surface expression PDL1, PDL2, CD206, VCAM-1, and CD163 was measured using flow cytometry gated on CD45 + /CMFDA - monocytes. (A) One representative set (n = 15) of flow histograms demonstrating cell surface expression in unexposed human monocytes and after exposure to mf or different cancer cell lines. (B). The data are expressed as the geometric mean with 95% confidence interval of the mean fluorescent intensity of unexposed and exposed monocytes ( n = 15). * P< 0.05, ** P< 0.005.
- Submitted by
- Invitrogen Antibodies (provider)
- Main image
- Experimental details
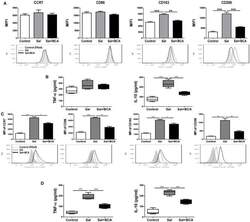
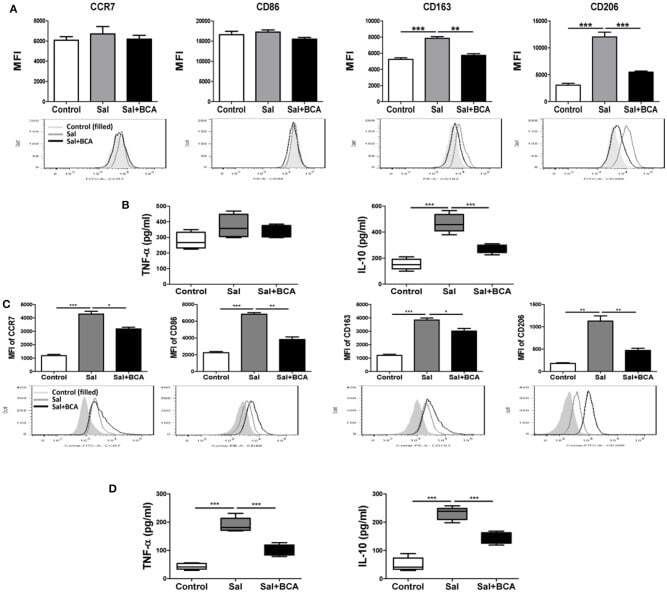
- Figure 7 BCA regulate MPhi polarization in vitro and in vivo . (A,B) Raw246.7 cells were treated with 4 mug/ml BCA for 2 h. Then, the cells were infected with Salmonella at MOI = 10:1 for 2 h. (A) The expression of surface markers (CCR7, CD86, CD163, and CD206) was determined by flow cytometry. The results are presented as MFI. (B) TNF-alpha and IL-10 in the supernatants were detected by ELISA. ** P < 0.01, *** P < 0.001. The data are representative of three experiments with similar results. (C,D) Mice were infected by intragastric administration of an overnight culture of Salmonella (10 5 bacteria in 0.1 ml PBS) through a gavage tube and then treated with 6.25 mg/kg BCA intragastrically by gavage daily (5 mice for each group). On the 5th day p.i., the mice were sacrificed and the peritoneal fluid was collected. (C) The expression of surface markers (CCR7, CD86, CD163, and CD206) in mouse peritoneal MPhis were determined by flow cytometry The results are presented as MFI. (D) TNF-alpha and IL-10 in ascitic fluid were detected by ELISA. * P < 0.05, ** P < 0.01, *** P < 0.001.
- Submitted by
- Invitrogen Antibodies (provider)
- Main image
- Experimental details
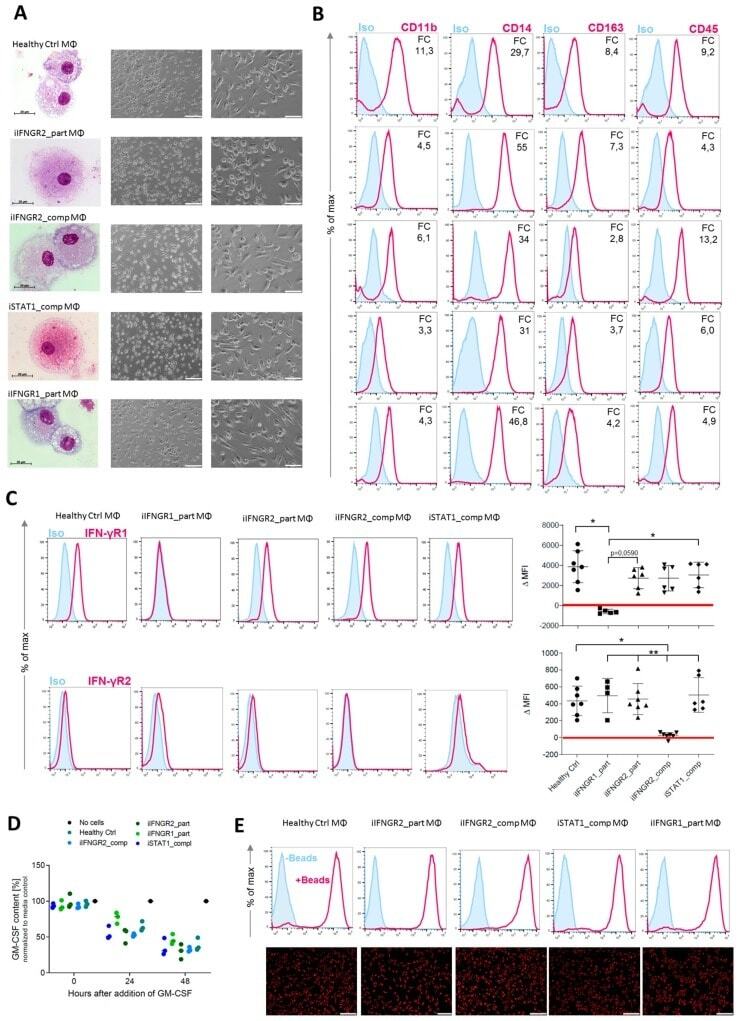
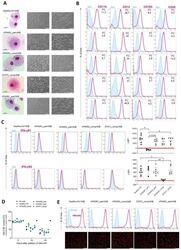
- Figure 3 Generation of patient specific iPSC-derived macrophages. Patient iPSCs have been differentiated into macrophages and compared to macrophages from a healthy iPSC line (hCD34_iPSC16). ( A ) Microscopic analysis of patient iPSCs in cytospin images after Pappenheim staining (left, scale bar = 20 um) or in brightfield images (middle scale bar 200 um, right scale bar = 100 um). ( B ) Representative flow cytometric analysis of CD11b, CD14, CD163 and CD45 expression on patient iPSCs and healthy macrophages of two independent experiments. Blue: Isotype. Pink: Surface marker. FC = fold change of the median fluorescent intensity. ( C ) Flow cytometric analysis of IFN-gammaR1 (top) and IFN-gammaR2 (bottom) expression on healthy and patient iPSC-derived macrophages. Blue: Isotype. Pink: Surface marker. Expression has been quantified by plotting the difference of the median fluorescent intensity (DeltaMFI). Each dot represents macrophages from an independent harvest and from at least three independent differentiations ( n = 4-7, mean +- SD, Kruskal-Wallis with Dunn''s multiple comparison). Red line shows DeltaMFI of 0. ( D ) GM-CSF clearance of healthy and patient iPSC-derived macrophages over a time of 48 h. Concentrations have been normalized to control well containing no cells (media only) ( n = 3, mean +- SD; each dot represents macrophages from an independent harvest and from at least three independent differentiations). ( E ) Representative flow cytometric (top) and microsco