 Explore
 Validate
 Learn
Learn Flow cytometry
Antibody data
- Antibody Data
- Antigen structure
- References [8]
- Comments [0]
- Validations
- Flow cytometry [2]
- Other assay [4]
Submit
Validation data
Reference
Comment
Report error
- Product number
- 12-0577-42 - Provider product page

- Provider
- Invitrogen Antibodies
- Product name
- CD57 Monoclonal Antibody (TB01 (TBO1)), PE, eBioscience™
- Antibody type
- Monoclonal
- Antigen
- Other
- Description
- Description: This TB01 monoclonal antibody reacts with human CD57 (also known as HNK-1 and Leu-7), a 110-kDa cell surface glycoprotein expressed on a subset of natural killer (NK) cells and NK T cells. Applications Reported: This TB01 (TBO1) antibody has been reported for use in flow cytometric analysis. Applications Tested: This TB01 (TBO1) antibody has been pre-titrated and tested by flow cytometric analysis of normal human peripheral blood cells. This can be used at 5 µL (0.25 µg) per test. A test is defined as the amount (µg) of antibody that will stain a cell sample in a final volume of 100 µL. Cell number should be determined empirically but can range from 10^5 to 10^8 cells/test. Excitation: 488-561 nm; Emission: 578 nm; Laser: Blue Laser, Green Laser, Yellow-Green Laser. Filtration: 0.2 µm post-manufacturing filtered.
- Reactivity
- Human
- Host
- Mouse
- Conjugate
- Yellow dye
- Isotype
- IgM
- Antibody clone number
- TB01 (TBO1)
- Vial size
- 100 Tests
- Concentration
- 5 μL/Test
- Storage
- 4°C, store in dark, DO NOT FREEZE!
Submitted references Aberrant newborn T cell and microbiota developmental trajectories predict respiratory compromise during infancy.
Phenotypic analysis of the unstimulated in vivo HIV CD4 T cell reservoir.
Defective Localization With Impaired Tumor Cytotoxicity Contributes to the Immune Escape of NK Cells in Pancreatic Cancer Patients.
Analysis of NK cell clones obtained using interleukin-2 and gene-modified K562 cells revealed the ability of "senescent" NK cells to lose CD57 expression and start expressing NKG2A.
Mass Cytometric Analysis of HIV Entry, Replication, and Remodeling in Tissue CD4+ T Cells.
Identification of Human Memory-Like NK Cells.
NKG2C(+)CD57(+) Natural Killer Cell Expansion Parallels Cytomegalovirus-Specific CD8(+) T Cell Evolution towards Senescence.
A novel method for autophagy detection in primary cells: impaired levels of macroautophagy in immunosenescent T cells.
McDavid A, Laniewski N, Grier A, Gill AL, Kessler HA, Huyck H, Carbonell E, Holden-Wiltse J, Bandyopadhyay S, Carnahan J, Dylag AM, Topham DJ, Falsey AR, Caserta MT, Pryhuber GS, Gill SR, Scheible KM
iScience 2022 Apr 15;25(4):104007
iScience 2022 Apr 15;25(4):104007
Phenotypic analysis of the unstimulated in vivo HIV CD4 T cell reservoir.
Neidleman J, Luo X, Frouard J, Xie G, Hsiao F, Ma T, Morcilla V, Lee A, Telwatte S, Thomas R, Tamaki W, Wheeler B, Hoh R, Somsouk M, Vohra P, Milush J, James KS, Archin NM, Hunt PW, Deeks SG, Yukl SA, Palmer S, Greene WC, Roan NR
eLife 2020 Sep 29;9
eLife 2020 Sep 29;9
Defective Localization With Impaired Tumor Cytotoxicity Contributes to the Immune Escape of NK Cells in Pancreatic Cancer Patients.
Lim SA, Kim J, Jeon S, Shin MH, Kwon J, Kim TJ, Im K, Han Y, Kwon W, Kim SW, Yee C, Kim SJ, Jang JY, Lee KM
Frontiers in immunology 2019;10:496
Frontiers in immunology 2019;10:496
Analysis of NK cell clones obtained using interleukin-2 and gene-modified K562 cells revealed the ability of "senescent" NK cells to lose CD57 expression and start expressing NKG2A.
Streltsova MA, Erokhina SA, Kanevskiy LM, Lee DA, Telford WG, Sapozhnikov AM, Kovalenko EI
PloS one 2018;13(12):e0208469
PloS one 2018;13(12):e0208469
Mass Cytometric Analysis of HIV Entry, Replication, and Remodeling in Tissue CD4+ T Cells.
Cavrois M, Banerjee T, Mukherjee G, Raman N, Hussien R, Rodriguez BA, Vasquez J, Spitzer MH, Lazarus NH, Jones JJ, Ochsenbauer C, McCune JM, Butcher EC, Arvin AM, Sen N, Greene WC, Roan NR
Cell reports 2017 Jul 25;20(4):984-998
Cell reports 2017 Jul 25;20(4):984-998
Identification of Human Memory-Like NK Cells.
Kovalenko EI, Streltsova MA, Kanevskiy LM, Erokhina SA, Telford WG
Current protocols in cytometry 2017 Jan 5;79:9.50.1-9.50.11
Current protocols in cytometry 2017 Jan 5;79:9.50.1-9.50.11
NKG2C(+)CD57(+) Natural Killer Cell Expansion Parallels Cytomegalovirus-Specific CD8(+) T Cell Evolution towards Senescence.
Heath J, Newhook N, Comeau E, Gallant M, Fudge N, Grant M
Journal of immunology research 2016;2016:7470124
Journal of immunology research 2016;2016:7470124
A novel method for autophagy detection in primary cells: impaired levels of macroautophagy in immunosenescent T cells.
Phadwal K, Alegre-Abarrategui J, Watson AS, Pike L, Anbalagan S, Hammond EM, Wade-Martins R, McMichael A, Klenerman P, Simon AK
Autophagy 2012 Apr;8(4):677-89
Autophagy 2012 Apr;8(4):677-89
No comments: Submit comment
Supportive validation
- Submitted by
- Invitrogen Antibodies (provider)
- Main image
- Experimental details
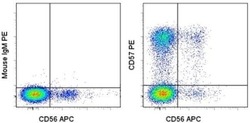
- Staining of normal human peripheral blood cells with Anti-Human CD56 (NCAM) APC (Product # 17-0567-42) and Mouse IgM Isotype Control PE (Product # 12-4752) (left) or Anti-Human CD57 PE (right). Cells in the lymphocyte gate were used for analysis.
- Conjugate
- Yellow dye
- Submitted by
- Invitrogen Antibodies (provider)
- Main image

- Experimental details
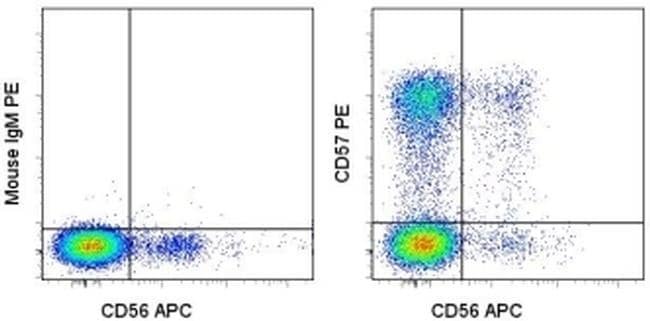
- Staining of normal human peripheral blood cells with Anti-Human CD56 (NCAM) APC (Product # 17-0567-42) and Mouse IgM Isotype Control PE (Product # 12-4752) (left) or Anti-Human CD57 PE (right). Cells in the lymphocyte gate were used for analysis.

Supportive validation
- Submitted by
- Invitrogen Antibodies (provider)
- Main image
- Experimental details
- NULL
- Conjugate
- Yellow dye
- Submitted by
- Invitrogen Antibodies (provider)
- Main image
- Experimental details
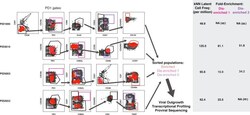
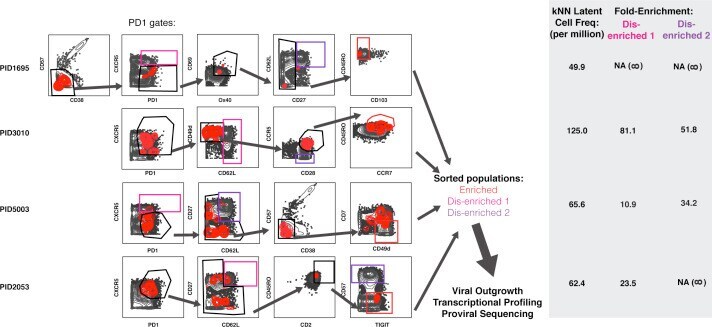
- Figure 5. Design of tailored sort strategies to isolate three populations memory CD4+ PD1+ T cells harboring different frequencies of kNN latent cells. Sort strategies were designed for each of the four leukapheresis donors analyzed by PP-SLIDE. Shown are the CyTOF datasets, the unstimulated atlas cells are shown as gray contours and kNN latent cells shown as red contours. Gates in black correspond to upstream gates. Each sorting strategy isolates three populations of memory CD4+ PD1+ T cells: two disenriched ( pink , purple ), and one enriched ( red ). Results were pre-gated on live, singlet memory CD4+ T cells (CD3+CD8-CD19-CD45RO+CD45RA-). The three functional assays applied to sorted cells are listed. The gray inset on the right shows frequencies of kNN latent cells in the final enriched populations (per million memory CD4+ T cells) and the fold-enrichment of kNN latent cells in the final sorted enriched population relative to each of the disenriched populations. In instances where a disenriched population did not harbor any kNN cells, the fold-enrichment is listed as NA (not available) because the fold-enrichment is infinity when divided by zero.
- Conjugate
- Yellow dye
- Submitted by
- Invitrogen Antibodies (provider)
- Main image
- Experimental details
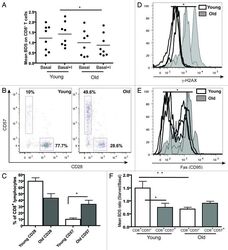
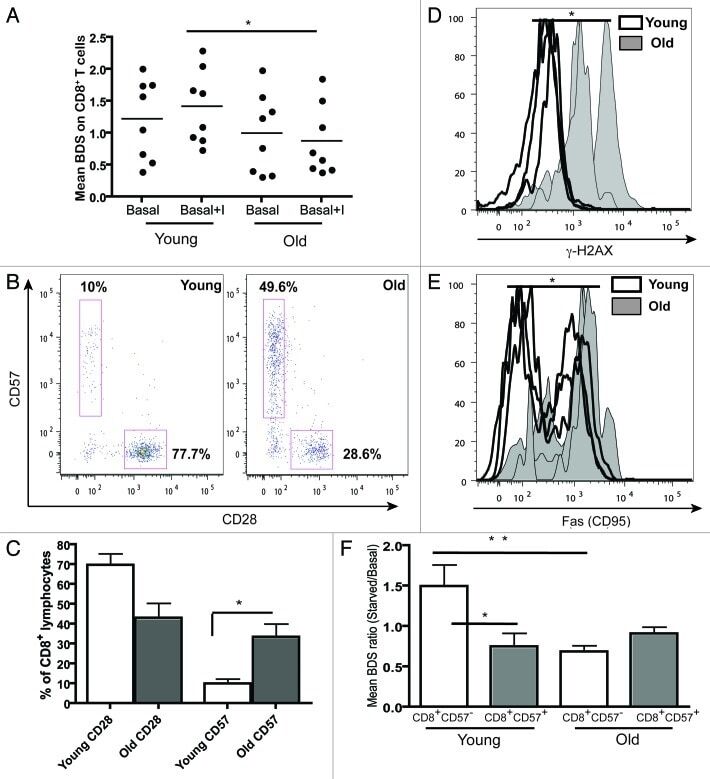
- Figure 5. Aging and replicative senescence markers in human T lymphocytes. PBMCs from healthy young (< 28 y) and old (> 56 y) donors were stained for CD28 and CD57 and run on LSR II flow cytometer. (A) Autophagy levels (Mean BDS) in CD8 + T cells from young (< 28 y, n = 8) and old (> 56 y, n = 8) donors under basal and basal+I (for 2 h) conditions (mean +- SEM, *p < 0.0499 between young and old basal+I). (B) Representative dot plots from a young and an old donor showing percentages of CD28 and CD57 cells gated on CD8 + T cells. (C) Bar graph showing % of CD8 + lymphocytes with CD28 and CD57 markers in four young and old donors (mean +- SEM, p = 0.0571 for CD8 CD28 population and *p = 0.0286 for CD8 CD57 population). (D) Overlaid histogram of gammaH2AX (DNA double-strand break) levels of CD8 + lymphocytes from three young and old donors gated on CD28 + CD57 - population (geometric mean +- SEM, *p = 0.0286). (E) Overlaid histogram of FAS (CD95) levels of CD8 + lymphocytes from four young and old donors gated on CD28 + CD57 - population (geometric mean +- SEM, *p = 0.0286). PBMCs from four healthy young and old donors were cultured under control and starved conditions for 2 h and stained for CD8, CD57, LC3 and Lyso-ID. (F) Colocalization of LC3 and lysosomal marker in CD8 + CD57 +/- cells, expressed as mean BDS ratio between starved and basal treatments (mean +- SEM, n = 5 (young donors), n = 8 (old donors), **p = 0.0049, *p = 0.035).
- Conjugate
- Yellow dye
- Submitted by
- Invitrogen Antibodies (provider)
- Main image
- Experimental details
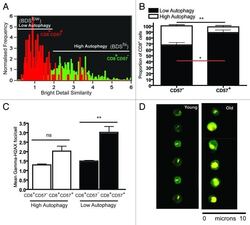
- Figure 6. Levels of gammaH2AX foci in senescent T cells with low autophagy. PBMCs from three healthy donors were bead sorted for CD8 + T cells and stained for CD57 gammaH2AX, LC3 and Lyso-ID and run on ImageStream. (A) Representative BDS overlay histogram for CD8 + CD57 + (red) for CD8 + CD57 - (green) depicts the low and high autophagy gates. (B) Bar graph showing proportion of CD8 + CD57 +/- lymphocytes with low and high autophagy in three healthy donors (mean +- SEM, **p = 0.0029, *p = 0.0273). (C) Bar graph showing mean gammaH2AX foci/cell in low and high autophagy CD8 + CD57 + , CD8 + CD57 - populations (geometric mean +- SEM, **p = 0.0057 and **p = 0.0087, respectively). (D) Representative ImageStream images of gammaH2AX foci in CD8 + lymphocytes from young and old cells.
- Conjugate
- Yellow dye
