 Explore
 Validate
 Learn
Learn Flow cytometry
Antibody data
- Antibody Data
- Antigen structure
- References [9]
- Comments [0]
- Validations
- Flow cytometry [1]
- Other assay [6]
Submit
Validation data
Reference
Comment
Report error
- Product number
- 48-0577-42 - Provider product page

- Provider
- Invitrogen Antibodies
- Product name
- CD57 Monoclonal Antibody (TB01 (TBO1)), eFluor™ 450, eBioscience™
- Antibody type
- Monoclonal
- Antigen
- Other
- Description
- Description: This TB01 monoclonal antibody reacts with human CD57 (also known as HNK-1 and Leu-7), a 110-kDa cell surface glycoprotein expressed on a subset of natural killer (NK) cells and NK T cells.
- Antibody clone number
- TB01 (TBO1)
- Concentration
- 5 µL/Test
Submitted references Phenotypic analysis of the unstimulated in vivo HIV CD4 T cell reservoir.
Influenza Vaccination Primes Human Myeloid Cell Cytokine Secretion and NK Cell Function.
Unique transcriptional and protein-expression signature in human lung tissue-resident NK cells.
IL-15 Promotes Polyfunctional NK Cell Responses to Influenza by Boosting IL-12 Production.
Enhancement of cytokine-driven NK cell IFN-γ production after vaccination of HCMV infected Africans.
Mass Cytometric Analysis of HIV Entry, Replication, and Remodeling in Tissue CD4+ T Cells.
Influenza Vaccination Generates Cytokine-Induced Memory-like NK Cells: Impact of Human Cytomegalovirus Infection.
High numbers of differentiated effector CD4 T cells are found in patients with cancer and correlate with clinical response after neoadjuvant therapy of breast cancer.
A novel method for autophagy detection in primary cells: impaired levels of macroautophagy in immunosenescent T cells.
Neidleman J, Luo X, Frouard J, Xie G, Hsiao F, Ma T, Morcilla V, Lee A, Telwatte S, Thomas R, Tamaki W, Wheeler B, Hoh R, Somsouk M, Vohra P, Milush J, James KS, Archin NM, Hunt PW, Deeks SG, Yukl SA, Palmer S, Greene WC, Roan NR
eLife 2020 Sep 29;9
eLife 2020 Sep 29;9
Influenza Vaccination Primes Human Myeloid Cell Cytokine Secretion and NK Cell Function.
Wagstaffe HR, Pickering H, Houghton J, Mooney JP, Wolf AS, Prevatt N, Behrens RH, Holland MJ, Riley EM, Goodier MR
Journal of immunology (Baltimore, Md. : 1950) 2019 Sep 15;203(6):1609-1618
Journal of immunology (Baltimore, Md. : 1950) 2019 Sep 15;203(6):1609-1618
Unique transcriptional and protein-expression signature in human lung tissue-resident NK cells.
Marquardt N, Kekäläinen E, Chen P, Lourda M, Wilson JN, Scharenberg M, Bergman P, Al-Ameri M, Hård J, Mold JE, Ljunggren HG, Michaëlsson J
Nature communications 2019 Aug 26;10(1):3841
Nature communications 2019 Aug 26;10(1):3841
IL-15 Promotes Polyfunctional NK Cell Responses to Influenza by Boosting IL-12 Production.
Wagstaffe HR, Nielsen CM, Riley EM, Goodier MR
Journal of immunology (Baltimore, Md. : 1950) 2018 Apr 15;200(8):2738-2747
Journal of immunology (Baltimore, Md. : 1950) 2018 Apr 15;200(8):2738-2747
Enhancement of cytokine-driven NK cell IFN-γ production after vaccination of HCMV infected Africans.
Darboe A, Danso E, Clarke E, Umesi A, Touray E, Wegmuller R, Moore SE, Riley EM, Goodier MR
European journal of immunology 2017 Jun;47(6):1040-1050
European journal of immunology 2017 Jun;47(6):1040-1050
Mass Cytometric Analysis of HIV Entry, Replication, and Remodeling in Tissue CD4+ T Cells.
Cavrois M, Banerjee T, Mukherjee G, Raman N, Hussien R, Rodriguez BA, Vasquez J, Spitzer MH, Lazarus NH, Jones JJ, Ochsenbauer C, McCune JM, Butcher EC, Arvin AM, Sen N, Greene WC, Roan NR
Cell reports 2017 Jul 25;20(4):984-998
Cell reports 2017 Jul 25;20(4):984-998
Influenza Vaccination Generates Cytokine-Induced Memory-like NK Cells: Impact of Human Cytomegalovirus Infection.
Goodier MR, Rodriguez-Galan A, Lusa C, Nielsen CM, Darboe A, Moldoveanu AL, White MJ, Behrens R, Riley EM
Journal of immunology (Baltimore, Md. : 1950) 2016 Jul 1;197(1):313-25
Journal of immunology (Baltimore, Md. : 1950) 2016 Jul 1;197(1):313-25
High numbers of differentiated effector CD4 T cells are found in patients with cancer and correlate with clinical response after neoadjuvant therapy of breast cancer.
Péguillet I, Milder M, Louis D, Vincent-Salomon A, Dorval T, Piperno-Neumann S, Scholl SM, Lantz O
Cancer research 2014 Apr 15;74(8):2204-16
Cancer research 2014 Apr 15;74(8):2204-16
A novel method for autophagy detection in primary cells: impaired levels of macroautophagy in immunosenescent T cells.
Phadwal K, Alegre-Abarrategui J, Watson AS, Pike L, Anbalagan S, Hammond EM, Wade-Martins R, McMichael A, Klenerman P, Simon AK
Autophagy 2012 Apr;8(4):677-89
Autophagy 2012 Apr;8(4):677-89
No comments: Submit comment
Supportive validation
- Submitted by
- Invitrogen Antibodies (provider)
- Main image
- Experimental details
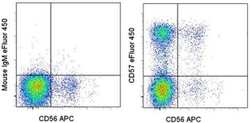
- Staining of normal human peripheral blood cells with Anti-Human CD56 (NCAM) APC (Product # 17-0567-42) and Mouse IgM Isotype Control eFluor® 450 (Product # 48-4752-80) (left) or Anti-Human CD57 eFluor® 450 (right). Cells in the lymphocyte gate were used for analysis.

Supportive validation
- Submitted by
- Invitrogen Antibodies (provider)
- Main image
- Experimental details
- NULL
- Submitted by
- Invitrogen Antibodies (provider)
- Main image

- Experimental details
- NULL

- Submitted by
- Invitrogen Antibodies (provider)
- Main image

- Experimental details
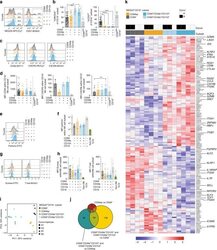
- Figure 5. Design of tailored sort strategies to isolate three populations memory CD4+ PD1+ T cells harboring different frequencies of kNN latent cells. Sort strategies were designed for each of the four leukapheresis donors analyzed by PP-SLIDE. Shown are the CyTOF datasets, the unstimulated atlas cells are shown as gray contours and kNN latent cells shown as red contours. Gates in black correspond to upstream gates. Each sorting strategy isolates three populations of memory CD4+ PD1+ T cells: two disenriched ( pink , purple ), and one enriched ( red ). Results were pre-gated on live, singlet memory CD4+ T cells (CD3+CD8-CD19-CD45RO+CD45RA-). The three functional assays applied to sorted cells are listed. The gray inset on the right shows frequencies of kNN latent cells in the final enriched populations (per million memory CD4+ T cells) and the fold-enrichment of kNN latent cells in the final sorted enriched population relative to each of the disenriched populations. In instances where a disenriched population did not harbor any kNN cells, the fold-enrichment is listed as NA (not available) because the fold-enrichment is infinity when divided by zero.

- Submitted by
- Invitrogen Antibodies (provider)
- Main image
- Experimental details
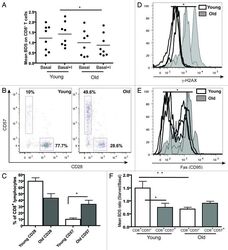
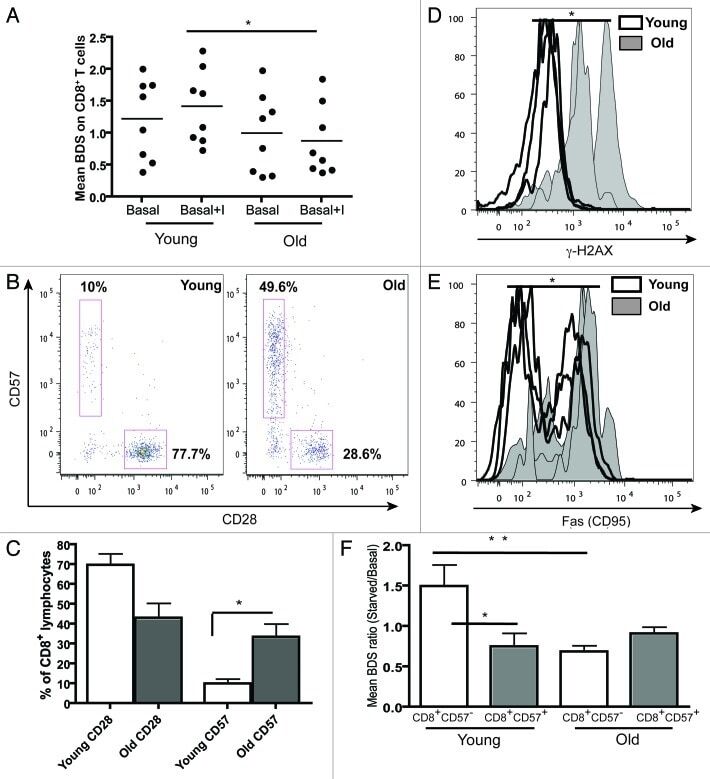
- Figure 5. Aging and replicative senescence markers in human T lymphocytes. PBMCs from healthy young (< 28 y) and old (> 56 y) donors were stained for CD28 and CD57 and run on LSR II flow cytometer. (A) Autophagy levels (Mean BDS) in CD8 + T cells from young (< 28 y, n = 8) and old (> 56 y, n = 8) donors under basal and basal+I (for 2 h) conditions (mean +- SEM, *p < 0.0499 between young and old basal+I). (B) Representative dot plots from a young and an old donor showing percentages of CD28 and CD57 cells gated on CD8 + T cells. (C) Bar graph showing % of CD8 + lymphocytes with CD28 and CD57 markers in four young and old donors (mean +- SEM, p = 0.0571 for CD8 CD28 population and *p = 0.0286 for CD8 CD57 population). (D) Overlaid histogram of gammaH2AX (DNA double-strand break) levels of CD8 + lymphocytes from three young and old donors gated on CD28 + CD57 - population (geometric mean +- SEM, *p = 0.0286). (E) Overlaid histogram of FAS (CD95) levels of CD8 + lymphocytes from four young and old donors gated on CD28 + CD57 - population (geometric mean +- SEM, *p = 0.0286). PBMCs from four healthy young and old donors were cultured under control and starved conditions for 2 h and stained for CD8, CD57, LC3 and Lyso-ID. (F) Colocalization of LC3 and lysosomal marker in CD8 + CD57 +/- cells, expressed as mean BDS ratio between starved and basal treatments (mean +- SEM, n = 5 (young donors), n = 8 (old donors), **p = 0.0049, *p = 0.035).
- Submitted by
- Invitrogen Antibodies (provider)
- Main image
- Experimental details
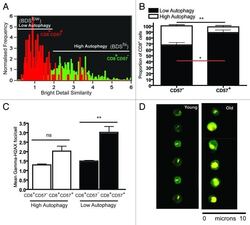
- Figure 6. Levels of gammaH2AX foci in senescent T cells with low autophagy. PBMCs from three healthy donors were bead sorted for CD8 + T cells and stained for CD57 gammaH2AX, LC3 and Lyso-ID and run on ImageStream. (A) Representative BDS overlay histogram for CD8 + CD57 + (red) for CD8 + CD57 - (green) depicts the low and high autophagy gates. (B) Bar graph showing proportion of CD8 + CD57 +/- lymphocytes with low and high autophagy in three healthy donors (mean +- SEM, **p = 0.0029, *p = 0.0273). (C) Bar graph showing mean gammaH2AX foci/cell in low and high autophagy CD8 + CD57 + , CD8 + CD57 - populations (geometric mean +- SEM, **p = 0.0057 and **p = 0.0087, respectively). (D) Representative ImageStream images of gammaH2AX foci in CD8 + lymphocytes from young and old cells.

- Submitted by
- Invitrogen Antibodies (provider)
- Main image
- Experimental details
- Fig. 2 Human CD69 + CD16 - lung NK cell subsets have unique characteristics. a Representative overlays and b summary of data of expression of NKG2A and CD57 on CD16 - human lung CD69 - CD49a - CD103 - ( n = 20 for both), CD69sp ( n = 20 for both), CD69 + CD49a + CD103 - ( n = 14 and n = 13, respectively), and CD69 + CD49a + CD103 + ( n = 17 and n = 15, respectively) NK cells. CD56 dim CD16 + NK cells are shown for comparison ( n = 20 and n = 19, respectively). Numbers in a indicate %NKG2A + and %CD57 + NK cells, respectively. c Representative overlays and d summary of mean fluorescence intensity (MFI) of CD56 ( n = 18 for CD16 - CD69 - CD49a - CD103 - NKG2A + CD57 - , n = 21 for CD69 + CD49a - CD103 - CD16 - , n = 16 for CD69 + CD49a + CD103 - CD16 - , n = 19 for CD69 + CD49a + CD103 + CD16 - , and n = 20 for CD56 dim CD16 + ), CXCR3 ( n = 3) and CXCR6 ( n = 7) on human lung CD69 - CD49a - CD103 - NKG2A + CD57 - , CD69sp, CD69 + CD49a + CD103 - , and CD69 + CD49a + CD103 + NK cells within the CD16 - subset. e Representative overlay and f summary of MFI of perforin expression in CD16 - CD69 - CD49a - CD103 - NKG2A + CD57 - , CD69spCD16 - , CD69 + CD49a + CD103 - CD16 - , CD69 + CD49a + CD103 + CD16 - , and CD69 - CD49a - CD103 - CD16 + NK cells in human lung ( n = 5). CD127 + CD161 + cells from lung tissue are shown as a comparison ( n = 5). g Representative overlays and h summary of MFI of Eomes (left panel) (CD16 - CD69 - CD49a - CD103 - NKG2A + CD57 - ( n = 5, other subsets
