Explore
 Validate
 Learn
Learn Flow cytometry
Antibody data
- Antibody Data
- Antigen structure
- References [32]
- Comments [0]
- Validations
- Flow cytometry [1]
- Other assay [20]
Submit
Validation data
Reference
Comment
Report error
- Product number
- 12-0699-41 - Provider product page

- Provider
- Invitrogen Antibodies
- Product name
- CD69 Monoclonal Antibody (FN50), PE, eBioscience™
- Antibody type
- Monoclonal
- Antigen
- Other
- Description
- Description: The FN50 monoclonal antibody reacts with human CD69, also known as very early activation antigen (VEA). CD69 is approximately 30 kDa and is expressed on the cell-surface as a disulfide-linked dimer. CD69 is rapidly upregulated upon activation and expressed on lymphocytes, monocytes and platelets. Applications Reported: The FN50 antibody has been reported for use in flow cytometric analysis. Applications Tested: This FN50 antibody has been pre-titrated and tested by flow cytometric analysis of stimulated normal human peripheral blood cells. This can be used at 5 µL (0.015 µg) per test. A test is defined as the amount (µg) of antibody that will stain a cell sample in a final volume of 100 µL. Cell number should be determined empirically but can range from 10^5 to 10^8 cells/test. Excitation: 488-561 nm; Emission: 578 nm; Laser: Blue Laser, Green Laser, Yellow-Green Laser. Filtration: 0.2 µm post-manufacturing filtered.
- Reactivity
- Human
- Host
- Mouse
- Conjugate
- Yellow dye
- Isotype
- IgG
- Antibody clone number
- FN50
- Vial size
- 25 Tests
- Concentration
- 5 µL/Test
- Storage
- 4° C, store in dark, DO NOT FREEZE!
Submitted references SARS CoV-2 mRNA vaccination exposes latent HIV to Nef-specific CD8(+) T-cells.
Dysregulated Peripheral Invariant Natural Killer T Cells in Plaque Psoriasis Patients.
Identification of celastrol as a novel HIV-1 latency reversal agent by an image-based screen.
Human endoglin-CD3 bispecific T cell engager antibody induces anti-tumor effect in vivo.
Longitudinal single-cell profiling reveals molecular heterogeneity and tumor-immune evolution in refractory mantle cell lymphoma.
T cell receptor-dependent S-acylation of ZAP-70 controls activation of T cells.
Cancer-secreted exosomal miR-1468-5p promotes tumor immune escape via the immunosuppressive reprogramming of lymphatic vessels.
Murlentamab, a Low Fucosylated Anti-Müllerian Hormone Type II Receptor (AMHRII) Antibody, Exhibits Anti-Tumor Activity through Tumor-Associated Macrophage Reprogrammation and T Cell Activation.
Coagulation factor V is a marker of tumor-infiltrating immune cells in breast cancer.
Unique natural killer cell subpopulations are associated with exacerbation risk in chronic obstructive pulmonary disease.
Heterogeneity of human bone marrow and blood natural killer cells defined by single-cell transcriptome.
Transcriptional down-regulation of ccr5 in a subset of HIV+ controllers and their family members.
VEGFR2-specific FnCAR effectively redirects the cytotoxic activity of T cells and YT NK cells.
Pathogen-derived HLA-E bound epitopes reveal broad primary anchor pocket tolerability and conformationally malleable peptide binding.
Glossogyne tenuifolia (Hsiang-ju) extract suppresses T cell activation by inhibiting activation of c-Jun N-terminal kinase.
Hormonal vitamin D up-regulates tissue-specific PD-L1 and PD-L2 surface glycoprotein expression in humans but not mice.
Combinations of isoform-targeted histone deacetylase inhibitors and bryostatin analogues display remarkable potency to activate latent HIV without global T-cell activation.
The 4E-BP-eIF4E axis promotes rapamycin-sensitive growth and proliferation in lymphocytes.
Early changes within the lymphocyte population are associated with the development of multiple organ dysfunction syndrome in trauma patients.
MAIT cells are activated during human viral infections.
HIV Tat controls RNA Polymerase II and the epigenetic landscape to transcriptionally reprogram target immune cells.
RSV-specific airway resident memory CD8+ T cells and differential disease severity after experimental human infection.
A generally applicable translational strategy identifies S100A4 as a candidate gene in allergy.
Alternative capture of noncoding RNAs or protein-coding genes by herpesviruses to alter host T cell function.
Small molecule inhibitor of antigen binding and presentation by HLA-DR2b as a therapeutic strategy for the treatment of multiple sclerosis.
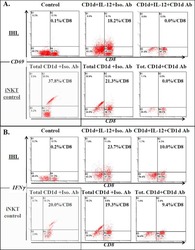
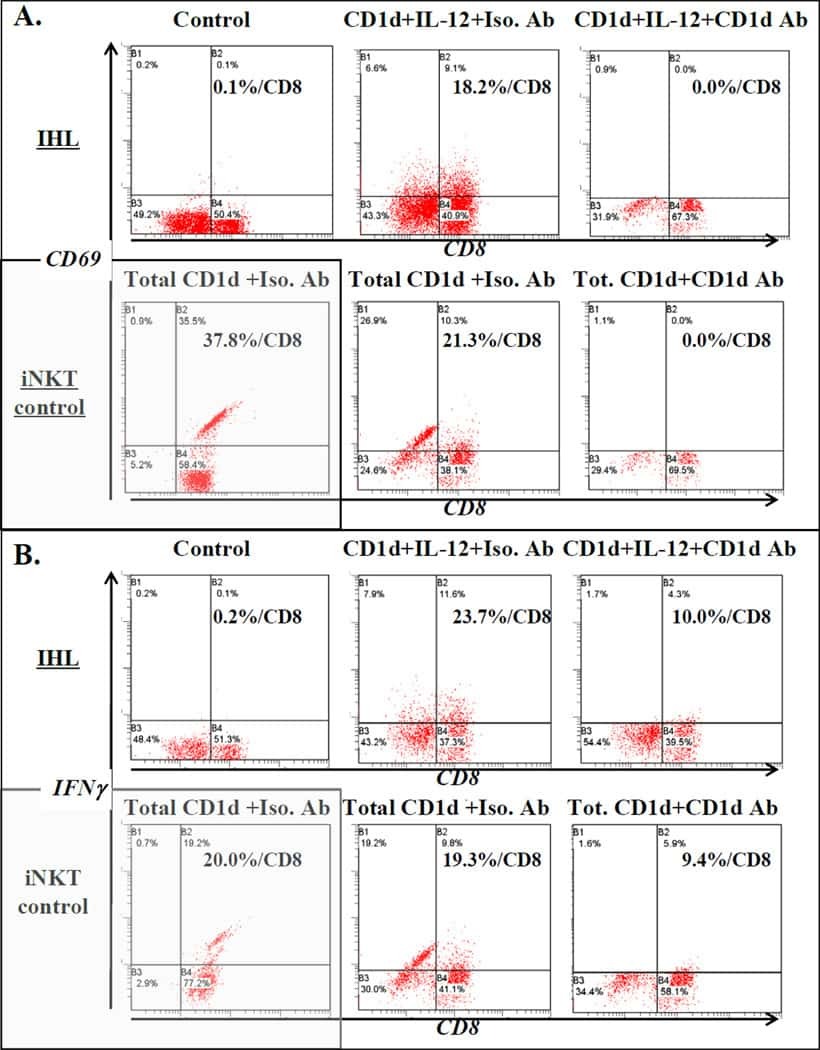
Ex vivo analysis of resident hepatic pro-inflammatory CD1d-reactive T cells and hepatocyte surface CD1d expression in hepatitis C.
Heterogeneity of multifunctional IL-17A producing S. Typhi-specific CD8+ T cells in volunteers following Ty21a typhoid immunization.
Role of actin dependent nuclear deformation in regulating early gene expression.
Alleviation of insulin resistance and liver damage by oral administration of Imm124-E is mediated by increased Tregs and associated with increased serum GLP-1 and adiponectin: results of a phase I/II clinical trial in NASH.
Functional requirements for inhibitory signal transmission by the immunomodulatory receptor CD300a.
Penicillium marneffei-stimulated dendritic cells enhance HIV-1 trans-infection and promote viral infection by activating primary CD4+ T cells.
Mycobacterium tuberculosis-induced gamma interferon production by natural killer cells requires cross talk with antigen-presenting cells involving Toll-like receptors 2 and 4 and the mannose receptor in tuberculous pleurisy.
Stevenson EM, Terry S, Copertino D, Leyre L, Danesh A, Weiler J, Ward AR, Khadka P, McNeil E, Bernard K, Miller IG, Ellsworth GB, Johnston CD, Finkelsztein EJ, Zumbo P, Betel D, Dündar F, Duncan MC, Lapointe HR, Speckmaier S, Moran-Garcia N, Papa MP, Nicholes S, Stover CJ, Lynch RM, Caskey M, Gaebler C, Chun TW, Bosque A, Wilkin TJ, Lee GQ, Brumme ZL, Jones RB
Nature communications 2022 Aug 19;13(1):4888
Nature communications 2022 Aug 19;13(1):4888
Dysregulated Peripheral Invariant Natural Killer T Cells in Plaque Psoriasis Patients.
Hu Y, Chen Y, Chen Z, Zhang X, Guo C, Yu Z, Xu P, Sun L, Zhou X, Gong Y, Yu Q, Shi Y
Frontiers in cell and developmental biology 2021;9:799560
Frontiers in cell and developmental biology 2021;9:799560
Identification of celastrol as a novel HIV-1 latency reversal agent by an image-based screen.
Liu H, Hu PW, Dubrulle J, Stossi F, Nikolai BC, Mancini MA, Rice AP
PloS one 2021;16(4):e0244771
PloS one 2021;16(4):e0244771
Human endoglin-CD3 bispecific T cell engager antibody induces anti-tumor effect in vivo.
Zhong L, Shi W, Gan L, Liu X, Huo Y, Wu P, Zhang Z, Wu T, Peng H, Huang Y, Zhao Y, Yuan Y, Deng Z, Tang H
Theranostics 2021;11(13):6393-6406
Theranostics 2021;11(13):6393-6406
Longitudinal single-cell profiling reveals molecular heterogeneity and tumor-immune evolution in refractory mantle cell lymphoma.
Zhang S, Jiang VC, Han G, Hao D, Lian J, Liu Y, Zhang R, McIntosh J, Wang R, Dang M, Dai E, Wang Y, Santos D, Badillo M, Leeming A, Chen Z, Hartig K, Bigcal J, Zhou J, Kanagal-Shamanna R, Ok CY, Lee H, Steiner RE, Zhang J, Song X, Nair R, Ahmed S, Rodriquez A, Thirumurthi S, Jain P, Wagner-Bartak N, Hill H, Nomie K, Flowers C, Futreal A, Wang L, Wang M
Nature communications 2021 May 17;12(1):2877
Nature communications 2021 May 17;12(1):2877
T cell receptor-dependent S-acylation of ZAP-70 controls activation of T cells.
Tewari R, Shayahati B, Fan Y, Akimzhanov AM
The Journal of biological chemistry 2021 Jan-Jun;296:100311
The Journal of biological chemistry 2021 Jan-Jun;296:100311
Cancer-secreted exosomal miR-1468-5p promotes tumor immune escape via the immunosuppressive reprogramming of lymphatic vessels.
Zhou C, Wei W, Ma J, Yang Y, Liang L, Zhang Y, Wang Z, Chen X, Huang L, Wang W, Wu S
Molecular therapy : the journal of the American Society of Gene Therapy 2021 Apr 7;29(4):1512-1528
Molecular therapy : the journal of the American Society of Gene Therapy 2021 Apr 7;29(4):1512-1528
Murlentamab, a Low Fucosylated Anti-Müllerian Hormone Type II Receptor (AMHRII) Antibody, Exhibits Anti-Tumor Activity through Tumor-Associated Macrophage Reprogrammation and T Cell Activation.
Prat M, Salon M, Allain T, Dubreuil O, Noël G, Preisser L, Jean B, Cassard L, Lemée F, Tabah-Fish I, Pipy B, Jeannin P, Prost JF, Barret JM, Coste A
Cancers 2021 Apr 13;13(8)
Cancers 2021 Apr 13;13(8)
Coagulation factor V is a marker of tumor-infiltrating immune cells in breast cancer.
Tinholt M, Stavik B, Tekpli X, Garred Ø, Borgen E, Kristensen V, Sahlberg KK, Sandset PM, Iversen N
Oncoimmunology 2020 Sep 29;9(1):1824644
Oncoimmunology 2020 Sep 29;9(1):1824644
Unique natural killer cell subpopulations are associated with exacerbation risk in chronic obstructive pulmonary disease.
Osterburg AR, Lach L, Panos RJ, Borchers MT
Scientific reports 2020 Jan 27;10(1):1238
Scientific reports 2020 Jan 27;10(1):1238
Heterogeneity of human bone marrow and blood natural killer cells defined by single-cell transcriptome.
Yang C, Siebert JR, Burns R, Gerbec ZJ, Bonacci B, Rymaszewski A, Rau M, Riese MJ, Rao S, Carlson KS, Routes JM, Verbsky JW, Thakar MS, Malarkannan S
Nature communications 2019 Sep 2;10(1):3931
Nature communications 2019 Sep 2;10(1):3931
Transcriptional down-regulation of ccr5 in a subset of HIV+ controllers and their family members.
Gonzalo-Gil E, Rapuano PB, Ikediobi U, Leibowitz R, Mehta S, Coskun AK, Porterfield JZ, Lampkin TD, Marconi VC, Rimland D, Walker BD, Deeks S, Sutton RE
eLife 2019 Apr 9;8
eLife 2019 Apr 9;8
VEGFR2-specific FnCAR effectively redirects the cytotoxic activity of T cells and YT NK cells.
Kulemzin SV, Gorchakov AA, Chikaev AN, Kuznetsova VV, Volkova OY, Matvienko DA, Petukhov AV, Zaritskey AY, Taranin AV
Oncotarget 2018 Feb 6;9(10):9021-9029
Oncotarget 2018 Feb 6;9(10):9021-9029
Pathogen-derived HLA-E bound epitopes reveal broad primary anchor pocket tolerability and conformationally malleable peptide binding.
Walters LC, Harlos K, Brackenridge S, Rozbesky D, Barrett JR, Jain V, Walter TS, O'Callaghan CA, Borrow P, Toebes M, Hansen SG, Sacha JB, Abdulhaqq S, Greene JM, Früh K, Marshall E, Picker LJ, Jones EY, McMichael AJ, Gillespie GM
Nature communications 2018 Aug 7;9(1):3137
Nature communications 2018 Aug 7;9(1):3137
Glossogyne tenuifolia (Hsiang-ju) extract suppresses T cell activation by inhibiting activation of c-Jun N-terminal kinase.
Houng JY, Tai TS, Hsu SC, Hsu HF, Hwang TS, Lin CJ, Fang LW
Chinese medicine 2017;12:9
Chinese medicine 2017;12:9
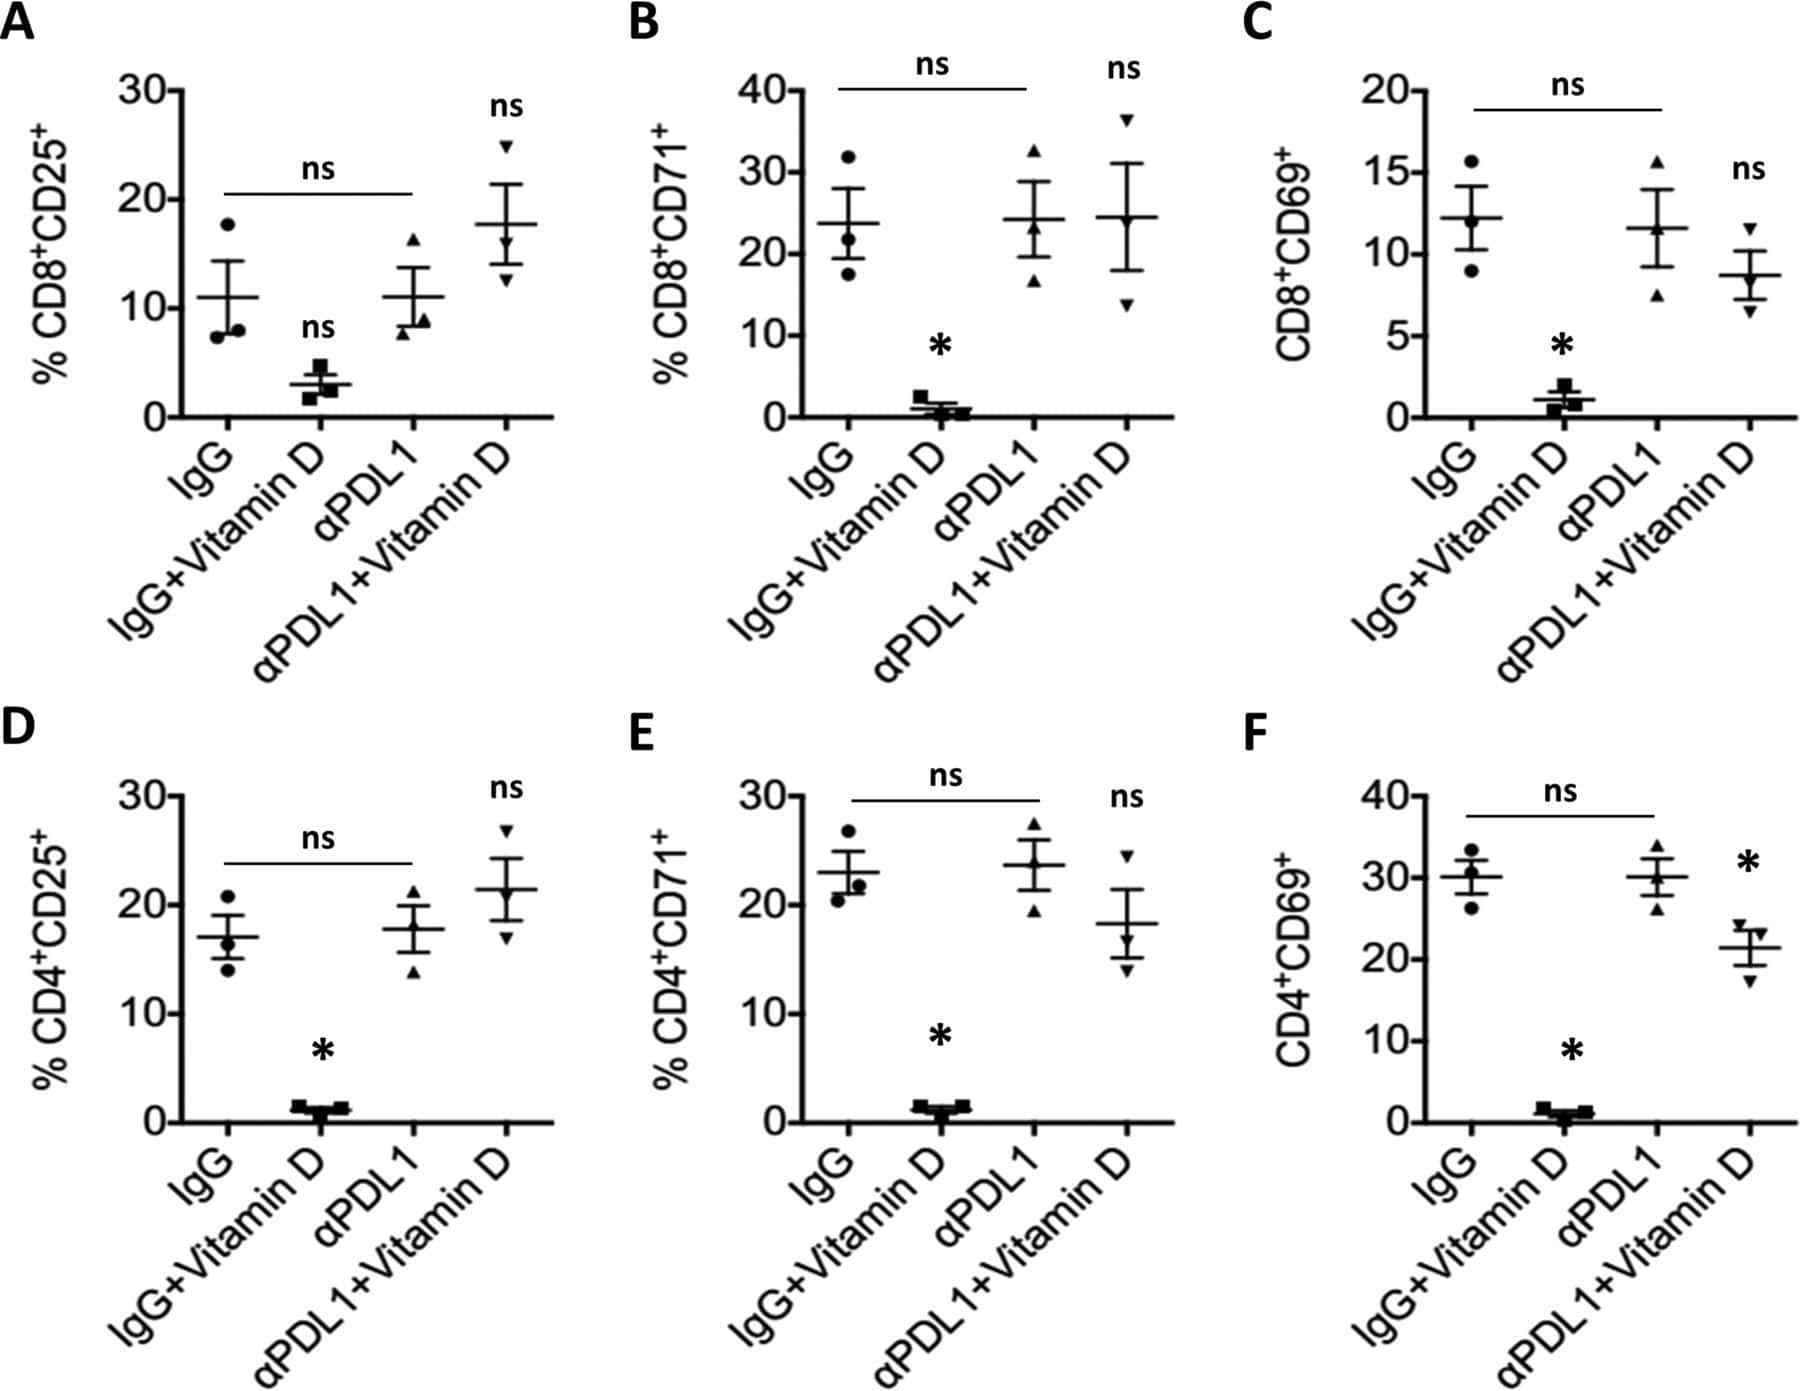
Hormonal vitamin D up-regulates tissue-specific PD-L1 and PD-L2 surface glycoprotein expression in humans but not mice.
Dimitrov V, Bouttier M, Boukhaled G, Salehi-Tabar R, Avramescu RG, Memari B, Hasaj B, Lukacs GL, Krawczyk CM, White JH
The Journal of biological chemistry 2017 Dec 15;292(50):20657-20668
The Journal of biological chemistry 2017 Dec 15;292(50):20657-20668
Combinations of isoform-targeted histone deacetylase inhibitors and bryostatin analogues display remarkable potency to activate latent HIV without global T-cell activation.
Albert BJ, Niu A, Ramani R, Marshall GR, Wender PA, Williams RM, Ratner L, Barnes AB, Kyei GB
Scientific reports 2017 Aug 7;7(1):7456
Scientific reports 2017 Aug 7;7(1):7456
The 4E-BP-eIF4E axis promotes rapamycin-sensitive growth and proliferation in lymphocytes.
So L, Lee J, Palafox M, Mallya S, Woxland CG, Arguello M, Truitt ML, Sonenberg N, Ruggero D, Fruman DA
Science signaling 2016 May 31;9(430):ra57
Science signaling 2016 May 31;9(430):ra57
Early changes within the lymphocyte population are associated with the development of multiple organ dysfunction syndrome in trauma patients.
Manson J, Cole E, De'Ath HD, Vulliamy P, Meier U, Pennington D, Brohi K
Critical care (London, England) 2016 Jun 7;20(1):176
Critical care (London, England) 2016 Jun 7;20(1):176
MAIT cells are activated during human viral infections.
van Wilgenburg B, Scherwitzl I, Hutchinson EC, Leng T, Kurioka A, Kulicke C, de Lara C, Cole S, Vasanawathana S, Limpitikul W, Malasit P, Young D, Denney L, STOP-HCV consortium, Moore MD, Fabris P, Giordani MT, Oo YH, Laidlaw SM, Dustin LB, Ho LP, Thompson FM, Ramamurthy N, Mongkolsapaya J, Willberg CB, Screaton GR, Klenerman P
Nature communications 2016 Jun 23;7:11653
Nature communications 2016 Jun 23;7:11653
HIV Tat controls RNA Polymerase II and the epigenetic landscape to transcriptionally reprogram target immune cells.
Reeder JE, Kwak YT, McNamara RP, Forst CV, D'Orso I
eLife 2015 Oct 21;4
eLife 2015 Oct 21;4
RSV-specific airway resident memory CD8+ T cells and differential disease severity after experimental human infection.
Jozwik A, Habibi MS, Paras A, Zhu J, Guvenel A, Dhariwal J, Almond M, Wong EHC, Sykes A, Maybeno M, Del Rosario J, Trujillo-Torralbo MB, Mallia P, Sidney J, Peters B, Kon OM, Sette A, Johnston SL, Openshaw PJ, Chiu C
Nature communications 2015 Dec 21;6:10224
Nature communications 2015 Dec 21;6:10224
A generally applicable translational strategy identifies S100A4 as a candidate gene in allergy.
Bruhn S, Fang Y, Barrenäs F, Gustafsson M, Zhang H, Konstantinell A, Krönke A, Sönnichsen B, Bresnick A, Dulyaninova N, Wang H, Zhao Y, Klingelhöfer J, Ambartsumian N, Beck MK, Nestor C, Bona E, Xiang Z, Benson M
Science translational medicine 2014 Jan 8;6(218):218ra4
Science translational medicine 2014 Jan 8;6(218):218ra4
Alternative capture of noncoding RNAs or protein-coding genes by herpesviruses to alter host T cell function.
Guo YE, Riley KJ, Iwasaki A, Steitz JA
Molecular cell 2014 Apr 10;54(1):67-79
Molecular cell 2014 Apr 10;54(1):67-79
Small molecule inhibitor of antigen binding and presentation by HLA-DR2b as a therapeutic strategy for the treatment of multiple sclerosis.
Ji N, Somanaboeina A, Dixit A, Kawamura K, Hayward NJ, Self C, Olson GL, Forsthuber TG
Journal of immunology (Baltimore, Md. : 1950) 2013 Nov 15;191(10):5074-84
Journal of immunology (Baltimore, Md. : 1950) 2013 Nov 15;191(10):5074-84
Ex vivo analysis of resident hepatic pro-inflammatory CD1d-reactive T cells and hepatocyte surface CD1d expression in hepatitis C.
Yanagisawa K, Yue S, van der Vliet HJ, Wang R, Alatrakchi N, Golden-Mason L, Schuppan D, Koziel MJ, Rosen HR, Exley MA
Journal of viral hepatitis 2013 Aug;20(8):556-65
Journal of viral hepatitis 2013 Aug;20(8):556-65
Heterogeneity of multifunctional IL-17A producing S. Typhi-specific CD8+ T cells in volunteers following Ty21a typhoid immunization.
McArthur MA, Sztein MB
PloS one 2012;7(6):e38408
PloS one 2012;7(6):e38408
Role of actin dependent nuclear deformation in regulating early gene expression.
Gupta S, Marcel N, Sarin A, Shivashankar GV
PloS one 2012;7(12):e53031
PloS one 2012;7(12):e53031
Alleviation of insulin resistance and liver damage by oral administration of Imm124-E is mediated by increased Tregs and associated with increased serum GLP-1 and adiponectin: results of a phase I/II clinical trial in NASH.
Mizrahi M, Shabat Y, Ben Ya'acov A, Lalazar G, Adar T, Wong V, Muller B, Rawlin G, Ilan Y
Journal of inflammation research 2012;5:141-50
Journal of inflammation research 2012;5:141-50
Functional requirements for inhibitory signal transmission by the immunomodulatory receptor CD300a.
DeBell KE, Simhadri VR, Mariano JL, Borrego F
BMC immunology 2012 Apr 26;13:23
BMC immunology 2012 Apr 26;13:23
Penicillium marneffei-stimulated dendritic cells enhance HIV-1 trans-infection and promote viral infection by activating primary CD4+ T cells.
Qin Y, Li Y, Liu W, Tian R, Guo Q, Li S, Li H, Zhang D, Zheng Y, Wu L, Lan K, Wang J
PloS one 2011;6(11):e27609
PloS one 2011;6(11):e27609
Mycobacterium tuberculosis-induced gamma interferon production by natural killer cells requires cross talk with antigen-presenting cells involving Toll-like receptors 2 and 4 and the mannose receptor in tuberculous pleurisy.
Schierloh P, Yokobori N, Alemán M, Landoni V, Geffner L, Musella RM, Castagnino J, Baldini M, Abbate E, de la Barrera SS, Sasiain MC
Infection and immunity 2007 Nov;75(11):5325-37
Infection and immunity 2007 Nov;75(11):5325-37
No comments: Submit comment
Supportive validation
- Submitted by
- Invitrogen Antibodies (provider)
- Main image
- Experimental details
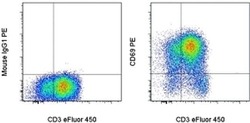
- Staining of overnight PHA-stimulated normal human peripheral blood cells with Anti-Human CD3 eFluor® 450 (Product # 48-0037-42) and Mouse IgG1 K Isotype Control PE (Product # 12-4714-81) (left) or Anti-Human CD69 PE (right). Cells in the lymphocyte gate were used for analysis.
- Conjugate
- Yellow dye

Supportive validation
- Submitted by
- Invitrogen Antibodies (provider)
- Main image
- Experimental details
- NULL
- Conjugate
- Yellow dye

- Submitted by
- Invitrogen Antibodies (provider)
- Main image
- Experimental details
- NULL
- Conjugate
- Yellow dye
- Submitted by
- Invitrogen Antibodies (provider)
- Main image
- Experimental details
- NULL
- Conjugate
- Yellow dye
- Submitted by
- Invitrogen Antibodies (provider)
- Main image

- Experimental details
- NULL
- Conjugate
- Yellow dye
- Submitted by
- Invitrogen Antibodies (provider)
- Main image
- Experimental details
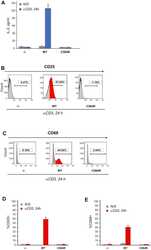
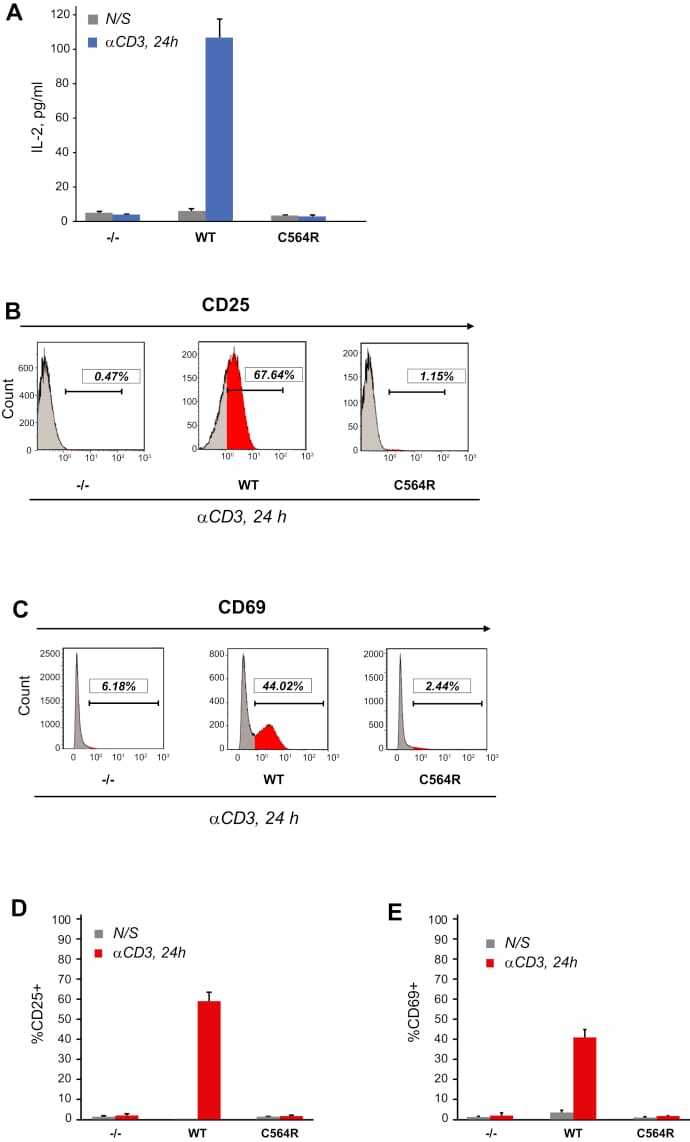
- Figure 5 S-acylation of ZAP-70 is required for T cell activation. A , IL-2 production by P116 (ZAP-70 -/-) Jurkat T cells stably rescued with WT or acylation-deficient C564R ZAP-70. IL-2 concentrations were measured by ELISA in supernatants from resting cells or cells stimulated for 24 h with plate-bound anti-CD3 antibody. Data shown are representative of three independent biological repeats and represented as mean +- SEM. B and C , Expression of CD25 and CD69 T cell surface activation markers by P116 stably rescued with WT or C564R ZAP-70. Cells were stimulated for 24 h with plate-bound anti-CD3 antibody and analyzed by flow cytometry. D and E , Quantification of CD25 and CD69 expression measured by flow cytometry. Data shown are pooled from three independent biological repeats and represented as mean +- SEM.
- Conjugate
- Yellow dye
- Submitted by
- Invitrogen Antibodies (provider)
- Main image
- Experimental details
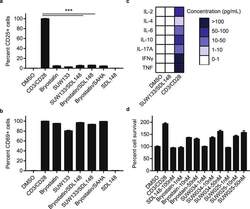
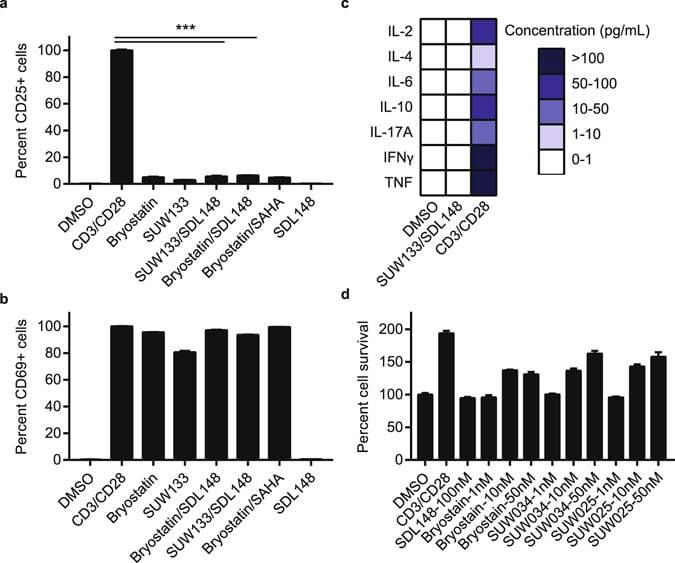
- Figure 7 Synergistic combinations avoid global T-cell activation and induction of cytokine release. Resting CD4+ CD25- T-cells were isolated from a HIV-1 negative donor blood. Cells were incubated 24 h with 1 nM bryologs and 100 nM HDAC inhibitor. Cells were stained with fluorescent-conjugated antibodies (a) CD25-APC and (b) CD69-FITC and analyzed by FACS (see Methods). Data indicate mean values and error bars indicate mean +- s.e.m. (n >= 3). ***p < 0.001, (ANOVA). (c) ELISA results for cytokine release from CD4+ CD25- T-cells following 24 h incubation with LRA combinations (see Methods). ( d ) Toxicity profile of LRA combinations. Resting CD4+ T-cells were incubated with compounds at indicated concentrations and MTT toxicity assay was performed as described in Methods.
- Conjugate
- Yellow dye
- Submitted by
- Invitrogen Antibodies (provider)
- Main image
- Experimental details
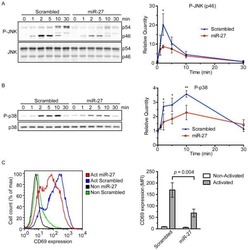
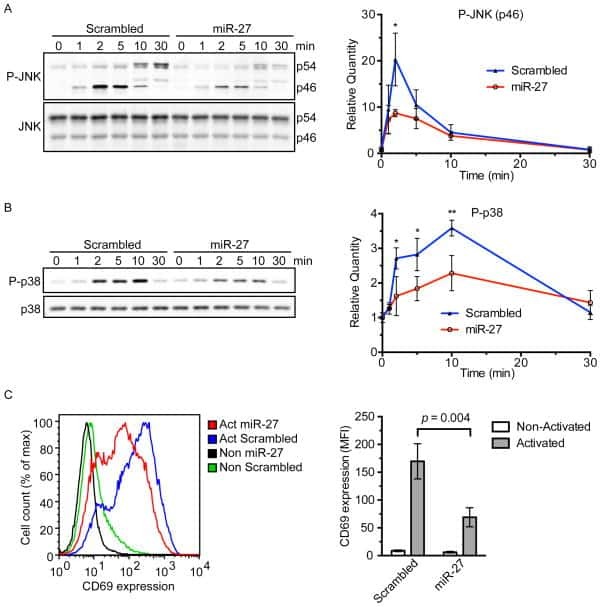
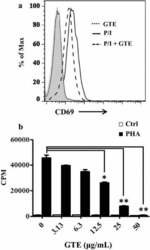
- Fig. 1 GTE blocks T cell activation. a CD69 induction decreased in GTE-treated Jurkat T cells. Jurkat T cells were activated by PMA/ionomycin alone (P/I; solid line ) or with 25 mug/mL GTE ( long dashed line ). GTE treatment alone ( short dashed line ) was used as a control. The cells were stained with an anti-CD69-PE antibody. The CD69-positive cells were then analyzed by flow cytometry. Data were assessed with FlowJo software. b Decreased proliferation of GTE-treated PBMCs. Freshly purified PBMCs were pretreated with various doses of GTE for 30 min and then stimulated by 2.5 mug/mL PHA. Cell proliferation was examined by 3 H-thymidine incorporation after a 20 h pulse with 0.5 muCi/well 3 H-thymidine. Data are expressed as counts per minute (CPM) of 3 H-thymidine uptake. A significant difference from the vehicle is indicated as * P < 0.05 or ** P < 0.01
- Conjugate
- Yellow dye

- Submitted by
- Invitrogen Antibodies (provider)
- Main image
- Experimental details
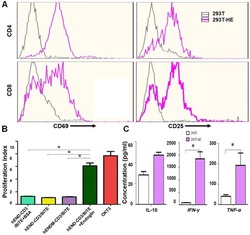
- Figure 3 hEND-CD3/BiTE activates T cells, stimulates T-cell proliferation, and increases secretion of Th1 cytokines. (A) PBMCs were co-cultured with 293T (grey signal) or 293T-hE (pink signal) cells in the presence of hEND-CD3/BiTE. The expression of T-cell activation markers CD69 (left panels) and CD25 (right panels) was detected in CD4 + (upper rows) and CD8 + (lower rows) by flow cytometry. (B) Proliferation of CFSE-labeled T cells in response to hEND-CD3/BiTE and other indicated reagents in the solid phase was measured using flow cytometry. The proliferation index was calculated using the ModFit LT software. (C) Supernatants were collected from the co-cultures of PBMCs with 293T (white bar) or 293T-hE cells (purple bar) in the presence of hEND-CD3/BiTE. The secretion of Th1 cytokines, including IFN-gamma, and TNF-alpha, and Th2 cytokine IL10 was measured using ELISA assays. * P < 0.001.
- Conjugate
- Yellow dye

- Submitted by
- Invitrogen Antibodies (provider)
- Main image
- Experimental details
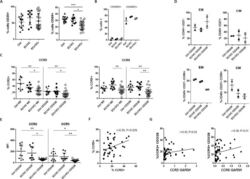
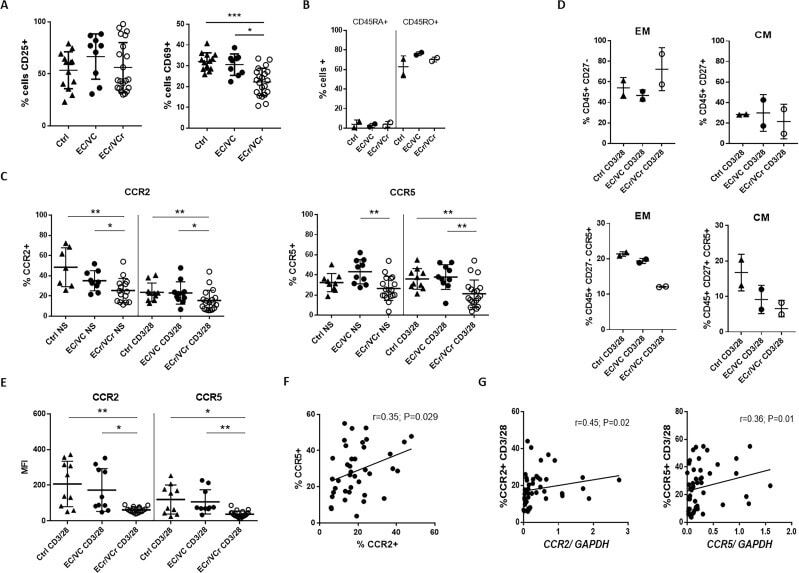
- 10.7554/eLife.44360.007 Figure 3. Lower proliferative responses and CCR2 and CCR5 cell surface levels in activated CD4 +T cells from ECr/VCrs. ( A ) Reduced CD69, but not CD25 levels in activated CD4 +T cells from ECr/VCrs. Graph shows representative data N = 13 (Ctrl), n = 9 (EC/VC) and n = 21 (ECr/VCr). ( B ) Comparable frequencies of naive CD45RA + and memory CD45RO + T cells after anti-CD3/CD28 activation between groups (n = 2 per group). ( C ) CCR5 and CCR2 cell surface levels measured by flow cytometry are reduced in freshly thawed (NS, non-stimulated) and activated CD4 +T cells (anti-CD3/28) from ECr/VCr. ( D ) Percentages of CCR5 +in effector memory (EM) and central memory (CM) compartments of activated CD4 +T cells (n = 2 per group). ( E ) Reduced CCR2 and CCR5 cell surface levels, expressed as MFI, in activated (anti-CD3/28) CD4 +T cells from ECr/VCr. Data in D-E shown pooled results from different experiments with n = 10 (Ctrl and EC/VC) and n = 19 (ECr/VCr). ( F ) Positive correlation between CCR2 and CCR5 cell surface levels. ( G ) Positive correlation observed between ccr2/ccr5 RNA levels and cell surface expression. Values obtained using the non-parametric Spearman correlation test. *p
- Conjugate
- Yellow dye
- Submitted by
- Invitrogen Antibodies (provider)
- Main image
- Experimental details
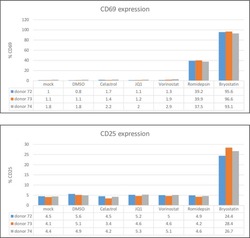
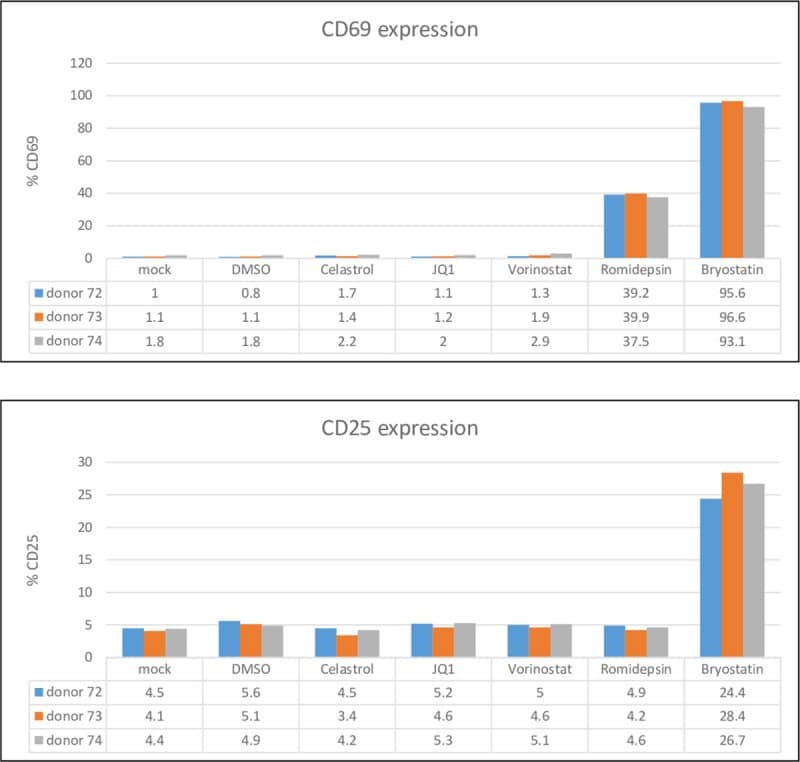
- 10.1371/journal.pone.0244771.g004 Fig 4 Celastrol does not activate resting CD4+ T cells. Resting CD4 + T cells were isolated from three healthy donors and treated with 400 nM celastrol, 200 nM JQ1, 400 nM vorinostat, 20 nM romidepsin, or 0.2 ng/ml bryostatin for 24 hours. Expression of CD25 and CD69 was quantified by flow cytometry.
- Conjugate
- Yellow dye
- Submitted by
- Invitrogen Antibodies (provider)
- Main image
- Experimental details
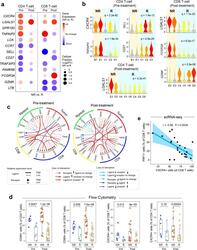
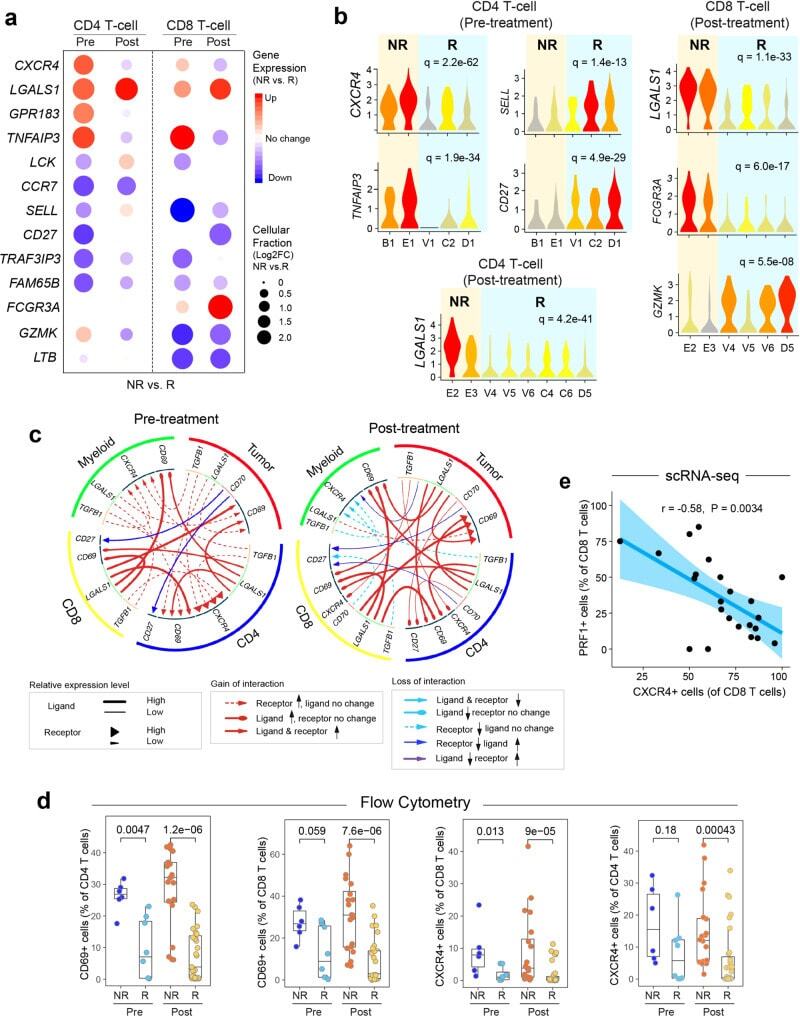
- Fig. 7 Aberrant cell-to-cell communication signaling associated with therapeutic resistance. a Differentially expressed genes (NR vs. R) in CD4+ and CD8+ T-cells pre- and post-ibrutinib treatment, respectively. Filled circle sizes are proportional to the Log2-scaled fold changes of each gene. Upregulated genes are shown in red; downregulated genes are shown in blue. Pre: pre-treatment; Post: post-treatment. b Representative genes are shown in violin plots. c Alterations (NR vs. R) of ligand-receptor-based cell-to-cell communication networks based in pre- and post-treatment samples. d Flow cytometry validation of upregulated CD69 and CXCR4 expression in ibrutinib nonresponders in comparison to the responders in additional patient cohorts ( n = 65 samples collected from 22 patients). The line in the box is the median value. The bottom and top of the box are the 25th and 75th percentiles of the sample. The bottom and top of the whiskers are the minimum and maximum values of the sample. p Values from the two-side Wilcoxon Signed-rank Test are shown. e Reverse correlation between the proportion of PRF1+ CD8 T cells (cytotoxic) and the expression of CXCR4 using scRNA-seq. The bounds of shape correspond to 95% confidence band for the regression line. The Pearson correlation coefficient ( r ) is shown. p Value corresponds to F test of linear regression model.
- Conjugate
- Yellow dye
- Submitted by
- Invitrogen Antibodies (provider)
- Main image

- Experimental details
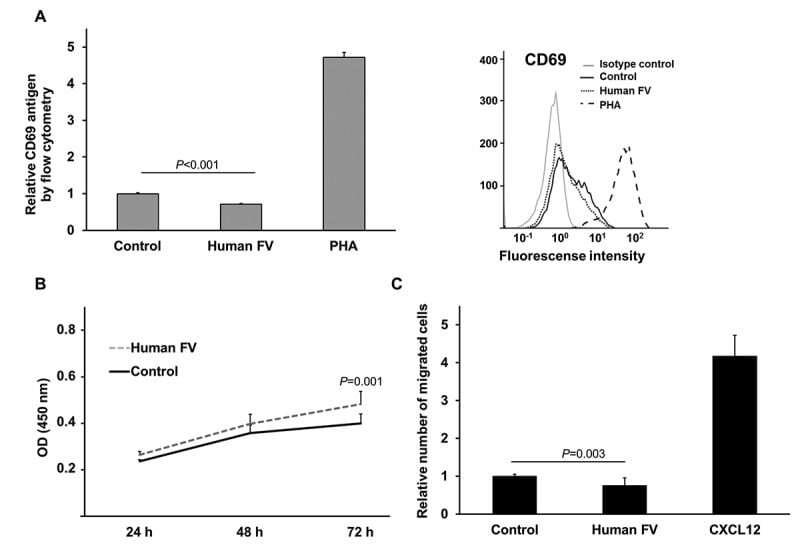
- Figure 2. T cell activation marker CD69 levels, WST-1 proliferation analysis and cell migration of FV treated Jurkat T cells. Cell surface expression of CD69, measured by flow cytometry, following 24 hour treatment with human FV (7 ug/mL) or control (50% (vol/vol) glycerol/H2O) in Jurkat T cells. The T cell mitogen PHA (20 ug/mL) served as positive control for CD69 expression. Left: Relative cell surface expression of CD69. Mean values + SD (n = 6 biological parallels) of two individual experiments. Right: Representative histogram showing the cell surface expression of CD69 for isotype control (background staining), control, human FV, and PHA (positive control). B) Cell viability following 24, 48, and 72 hours of treatment with human FV (7 ug/mL) or control (50% (vol/vol) glycerol/H2O) in Jurkat T cells. WST-1 was added to the cells and OD measurements were conducted after 1 hour incubation. Mean values + SD (n = 15 biological parallels) of three individual experiments. C) The relative number of migrated Jurkat T cells in response to human FV (7 ug/mL) or control (50% (vol/vol) glycerol/H2O) in the bottom chamber of a transwell assay. CXCL12 served as a positive control for migration. Cells were allowed to migrate for 24 hours. Mean values + SD (n = 9 biological parallels) of three individual experiments. P -values for two-group comparisons (Mann-Whitney U) are indicated.
- Conjugate
- Yellow dye
- Submitted by
- Invitrogen Antibodies (provider)
- Main image
- Experimental details
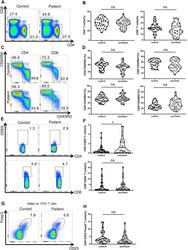
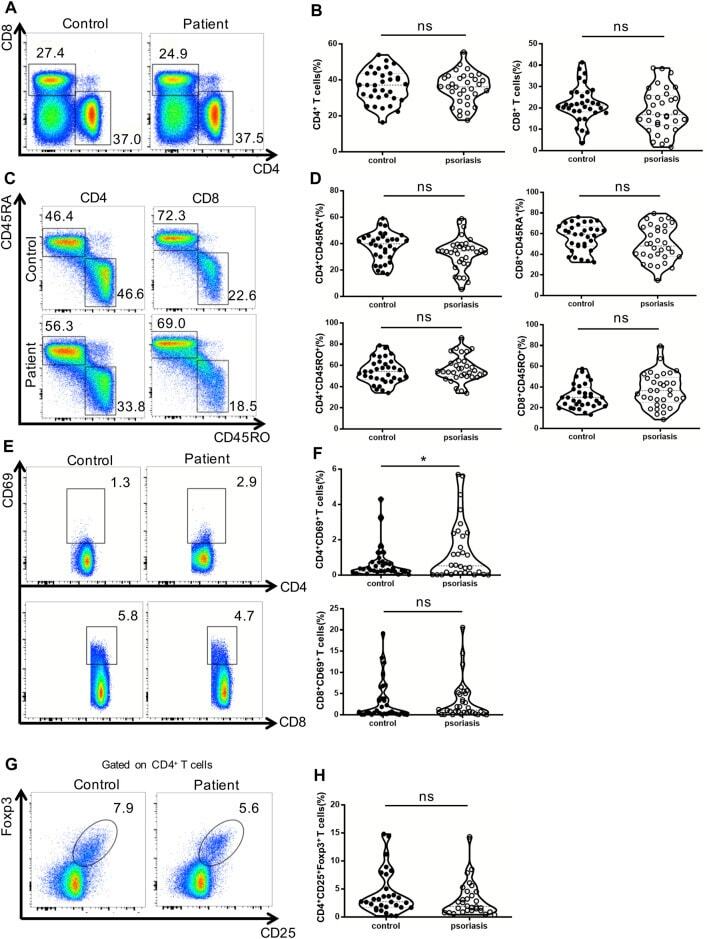
- FIGURE 1 Distribution of conventional T cells and Tregs in the peripheral blood. (A) Flow cytometry analysis of CD4 + and CD8 + T cells in PBMCs from moderate-to-severe plaque psoriasis patients and healthy controls. (B) Summary plots showing individual results of the frequency of CD4 + and CD8 + T cells in moderate-to-severe plaque psoriasis patients versus healthy controls. (C) Flow cytometry analysis of memory (CD45RO+) and naive (CD45RA+) CD4 + and CD8 + T cells in PBMCs from moderate-to-severe plaque psoriasis patients and healthy controls. (D) Summary plots showing individual results of the frequency of CD45RA+ and CD45RO + CD4 + and CD8 + T cells in moderate-to-severe plaque psoriasis patients versus healthy controls. (E) Flow cytometry analysis of CD69 expression in CD4 + and CD8 + T cells in PBMCs from moderate-to-severe plaque psoriasis patients and healthy controls. (F) Summary plots showing individual results of the frequency of CD69 + CD4 + T cells and CD69 + CD8 + T cells in moderate-to-severe plaque psoriasis patients versus healthy controls. (G) Flow cytometry analysis of CD4 + CD25 + Foxp3+ Tregs in PBMCs from moderate-to-severe plaque psoriasis patients and healthy controls. (H) Summary plots showing individual results of the frequency of CD4 + CD25 + Foxp3+ Tregs in psoriasis patients versus healthy controls. Data show mean +SEM. p -values were determined by paired Student's t-test. ns, no significance, * p < 0.05, ** p < 0.01, *** p < 0.001 and **** p < 0.
- Conjugate
- Yellow dye
- Submitted by
- Invitrogen Antibodies (provider)
- Main image
- Experimental details
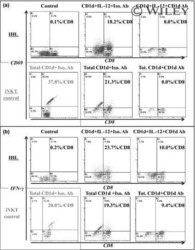
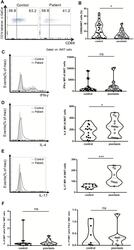
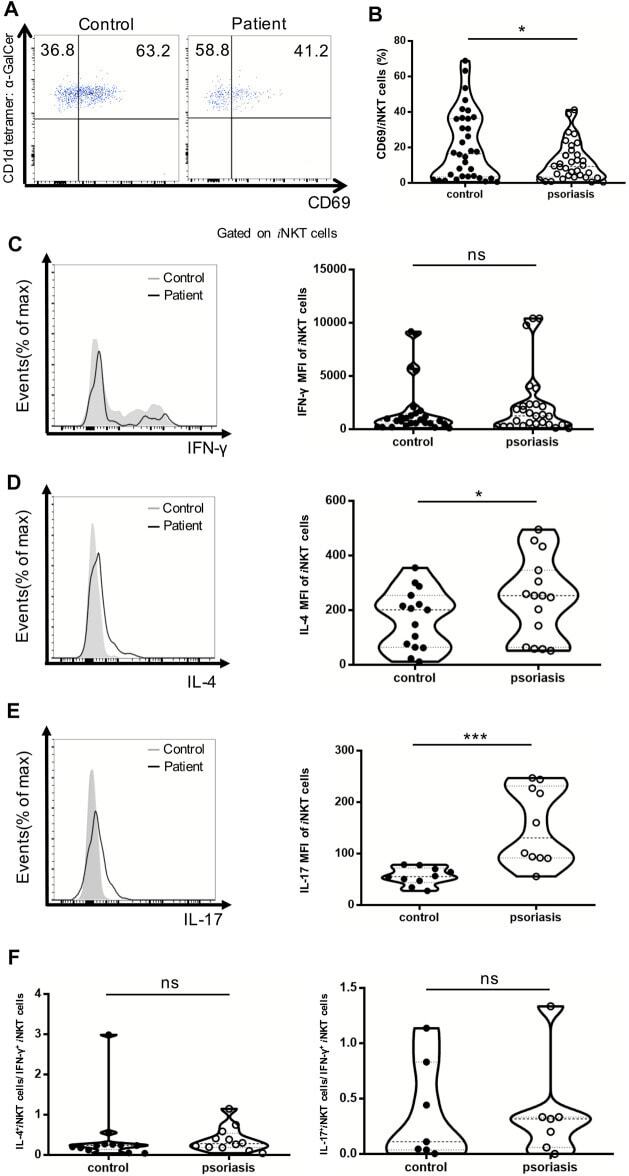
- FIGURE 4 i NKT cells activation status and cytokine production in PBMCs of psoriasis patients. Intracellular IFN-gamma and IL-4 production of circulating i NKT cells was analyzed after stimulation with Cell Stimulation Cocktail for 5 h. (A) Representative FACS dot plots for iNKT cell CD69 expression in psoriasis patients and healthy controls. (B) Summary plots showing individual results of the frequency of CD69 + iNKT cells in psoriasis patients versus healthy controls. (C) Representative histogram and summary plots showing individual results of the MFI of IFN-gamma-producing iNKT cells in psoriasis patients versus healthy controls. (D) Representative histogram and summary plots showing individual results of the MFI of IL-4-producing iNKT cells in psoriasis patients versus healthy controls. (E) Representative histogram and summary plots showing individual results of the MFI of IL-17-producing iNKT cells in psoriasis patients versus healthy controls. (F) Summary plots showing individual results of IL-4-producing i NKT cells/IFN-gamma-producing i NKT cells and IL-17-producing i NKT cells/IFN-gamma-producing i NKT cells in psoriasis patients versus healthy controls. Data show mean +SEM. p -values were determined by paired Student's t-test. ns, no significance, * p < 0.05, ** p < 0.01, *** p < 0.001 and **** p < 0.0001.
- Conjugate
- Yellow dye
- Submitted by
- Invitrogen Antibodies (provider)
- Main image
- Experimental details
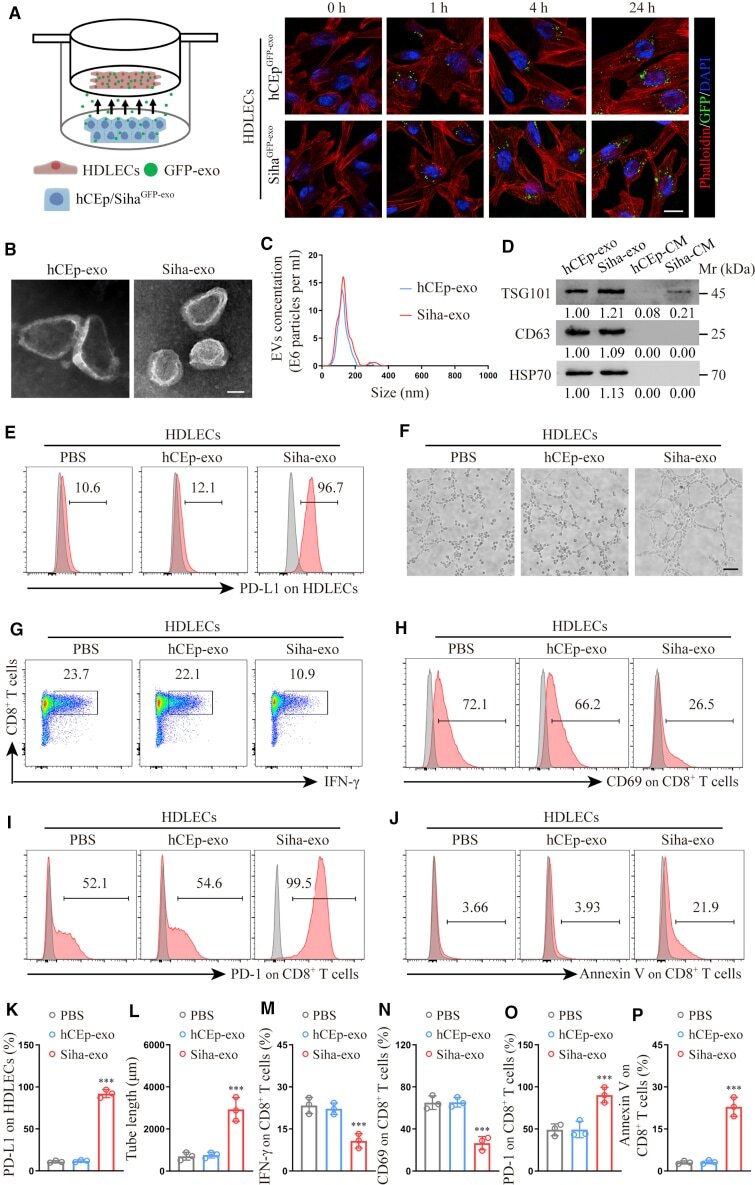
- Cancer-secreted exosomes reprogram HDLECs to suppress CD8 + T cell immunity (A) Confocal imaging showed the transfer of GFP-labeled exosomes (green) to phalloidin-labeled HDLECs (red) at the indicated time point using Transwell chamber. (B and C) Exosomes secreted by Siha and hCEp were detected by transmission electron microscopy (TEM) (B) and NanoSight analysis (C). Scale bar, 100 nm. (D) Western blot for characteristic proteins of exosomes compared with conditioned media (CM) from Siha and hCEp. (E and F) Flow cytometry analysis of PD-L1 expression (E) and tube-formation assay (F) in HDLECs treated with PBS, hCEp-exo, or Siha-exo. Scale bar, 10 mum. (G-J) Flow cytometry analysis of IFN-gamma (G), CD69 (H), PD-1 (I), and Annexin V (J) expression on CD8 + T cells co-cultured with HDLECs treated with PBS, hCEp-exo, or Siha-exo. (K and L) Quantification of PD-L1 expression (K) and tube formation (L) in HDLECs with indicated treatment. (M-P) Quantification of IFN-gamma (M), CD69 (N), PD-1 (O), and Annexin V (P) expression on CD8 + T cells co-cultured with HDLECs with indicated treatment. The numeric values under the western blot bands represent the protein relative expression (baseline value 1.00). Error bars represent the mean +- SD of three independent experiments. ***p < 0.001.
- Conjugate
- Yellow dye
- Submitted by
- Invitrogen Antibodies (provider)
- Main image

- Experimental details
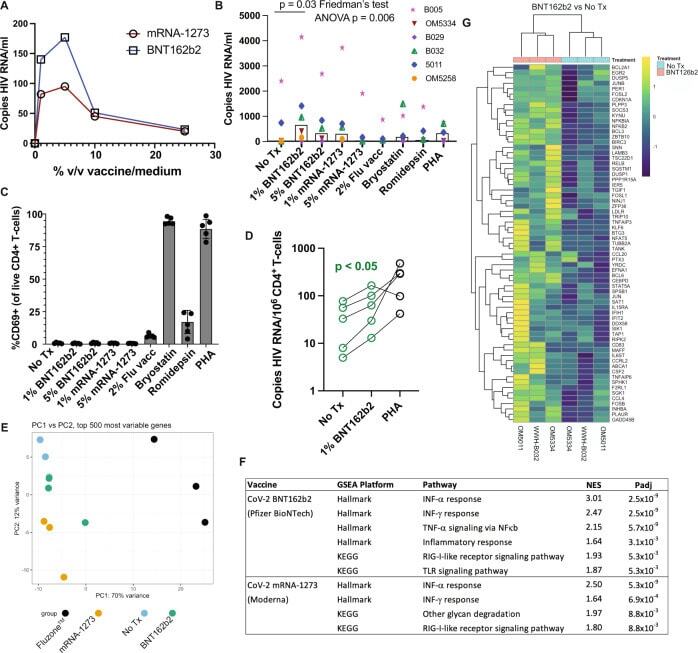
- The BNT162b2 mRNA vaccine stimulates the RIG-I/TLR - TNF-alpha - NFkappab axis and activates HIV transcription ex vivo. A qPCR measurements of HIV RNA in supernatants, 48 hours following ex vivo treatment of PBMCs from an ART-treated participant with the indicated concentrations of BNT126b2 (Pfizer BioNTech) or mRNA-1273 (Moderna) mRNA vaccines. B Extension of results from A to n = 6 ART-treated participants, adding treatments with 2% volume/volume Fluzone(tm) influenza vaccine, 25 nM bryostatin-1, 40 nM romidepsin, or 2 mug/ml phytohemagglutinin-L (PHA). P values were calculated by Friedman test with Dunn's multiple comparison test (two-tailed). C Flow cytometry data from the same samples n = 5 donors harvested for ( B ) Shown are % CD69 + (activated) following gating on viable CD4 + T-cells. Data are presented as mean values +/- SD. D Cell-associated HIV RNA measures from the same samples as ( B ) P value of 0.0487 was calculated by a two-tailed paired t test between No Tx and 1% BNT162b2. E - G Bulk mRNA-seq data was generated using a subset of the samples plotted in (WWH-B032, OM5011, and OM5334). B , E Principal component analysis (PCA). The results show that transcriptional profiles of BNT126b2- and mRNA-1273-treated cells are more similar to 'No treatment' and to each other than Fluzone(tm)-treated cells. F Gene set enrichment analyses showing pathways activated following mRNA vaccine treatments. Benjamini-Hochberg corrected P-values were calculated with the fgsea pack
- Conjugate
- Yellow dye
- Submitted by
- Invitrogen Antibodies (provider)
- Main image
- Experimental details
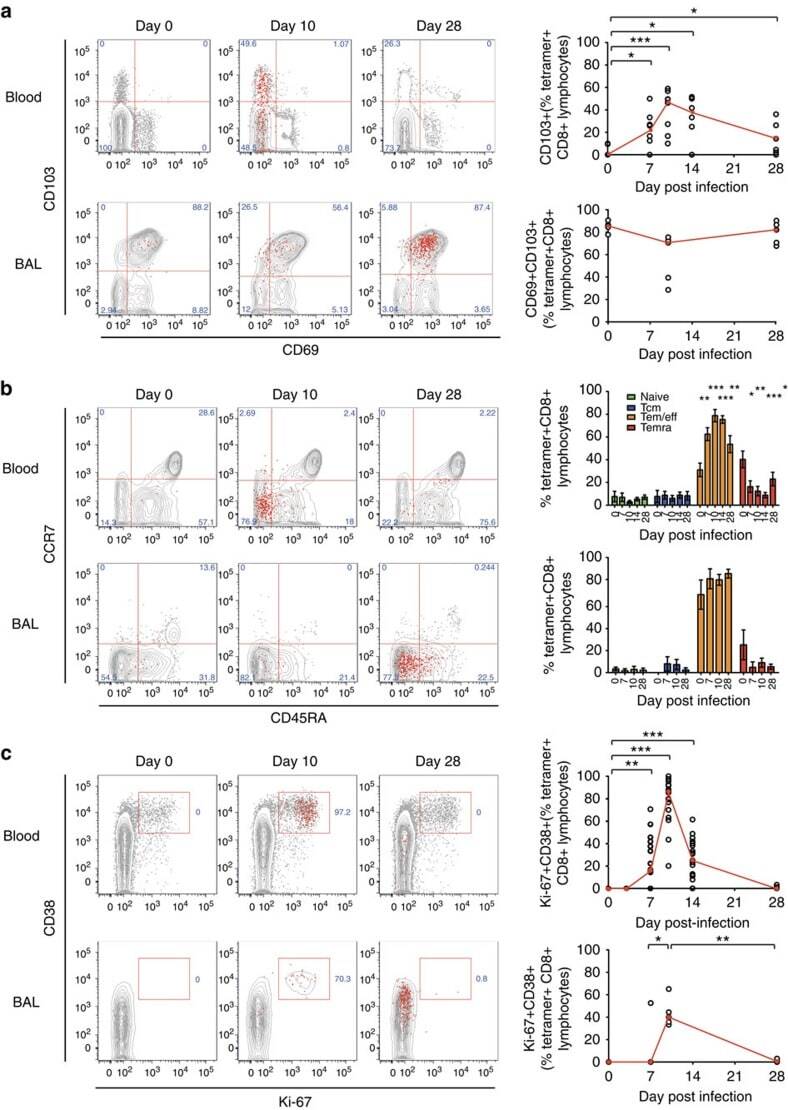
- Figure 6 RSV-specific CD8+ T cells in BAL display a distinctive resident memory phenotype. Tetramer+ CD8+ T cells in blood and BAL were co-stained for markers to assess their differentiation status. ( a ) CD69 and CD103 as canonical markers of resident memory CD8+ T cells are shown in blood ( n =9) and BAL ( n =5) from infected volunteers. Significant P values for two-tailed Wilcoxon matched pairs tests in blood compared with baseline are shown (day 7, P =0.0313; day 10, P =0.0039; day 14, P =0.0313; and day 28, P =0.0313). ( b ) Memory markers CD45RA and CCR7 are shown in blood ( n =19) and BAL ( n =8). Mean+-significant P values for two-tailed Wilcoxon matched pairs tests compared with baseline are shown in blood for T-effector/effector memory cells (day 7, P =0.0034; day 10, P =0.0002; day 14, P =0.0002; day 28, P =0.0067) and effector memory T cells re-expressing CD45RA (day 7, P =0.0443; day 10, P =0.0025; day 14, P =0.0003; day 28, P =0.0135). ( c ) Proliferation and activation markers Ki-67 and CD38 are shown in blood ( n =19) and BAL ( n =8). Significant P values for two-tailed Wilcoxon matched pairs tests are shown compared with baseline in blood (day 7, P =0.0025; day 10, P =0.0001; and day 14, P =0.0005) and BAL (day 7 versus day 10, P =0.0444; and day 10 versus day 28, P =0.0022 as no Ki-67+CD38+ cells were found in any baseline samples). Throughout, representative plots from a single subject at day 0, 10 and 28 post infection are shown with tetramer+ cells as red
- Conjugate
- Yellow dye
- Submitted by
- Invitrogen Antibodies (provider)
- Main image
- Experimental details
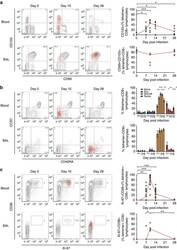
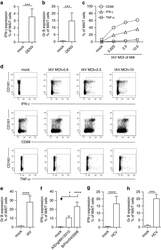
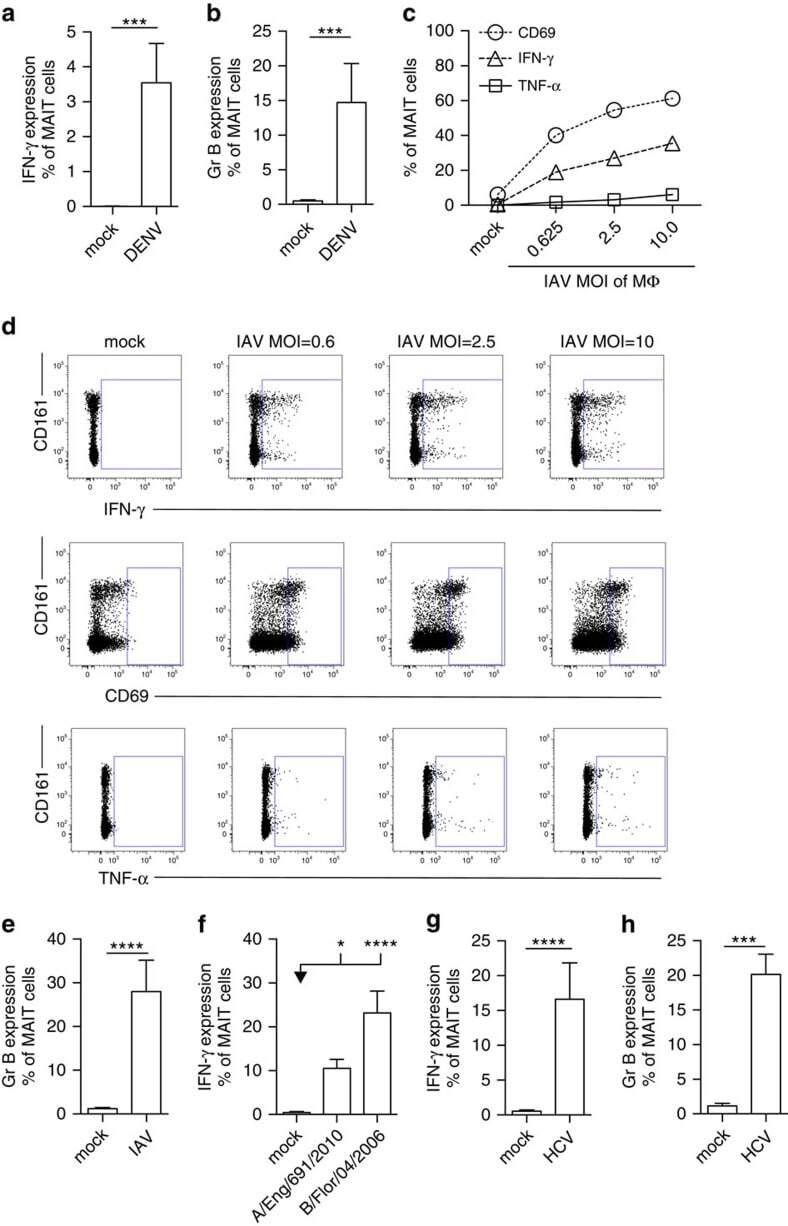
- Figure 3 Viral MAIT cell activation in vitro . MAIT cells from healthy individuals were analysed by flow cytometry, gated on live CD3 + CD161 ++ Valpha7.2 + cells. ( a , b ) PBMC's ( n =7) were co-cultured with autologous monocyte-derived DC's exposed to DENV (MOI=1) as described in 'Methods'. ( c - e ) CD8 + T cells isolated from PBMC's ( n =11-12) were co-cultured with IAV-exposed macrophages (MOI=1) as described in 'Methods', unless indicated otherwise. ( f ) CD8 + T cells isolated from PBMC's ( n =11-12) were co-cultured with macrophages exposed to the clinical H3N2 influenza A strain (A/England/691/2010 ( n =7)) or influenza B (B/Florida/04/2006 ( n =8)) (MOI=1) as described in 'Methods'. ( g , h ) CD8 + T cells isolated from PBMC's ( n =7-12) co-cultured with macrophages exposed to HCV (MOI=1) as described in 'Methods'. Proportion of MAIT cells producing IFN-gamma ( a , c , d , f , g ), TNF-alpha ( c , d ), CD69 ( c , d ) or Granzyme B ( b , e , h ). ( d ) Representative flow cytometry plots. All data are representative from at least two independent experiments. Bars represent means+-s.e.m. Statistical significance was determined with the Kruskal-Wallis test followed by the Dunns' test ( f ) or the Mann-Whitney test ( a , b , e , g , h ). ns>0.05, * P 0.05, *** P
- Conjugate
- Yellow dye
- Submitted by
- Invitrogen Antibodies (provider)
- Main image

- Experimental details
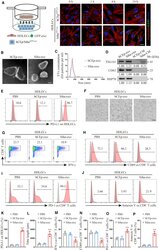
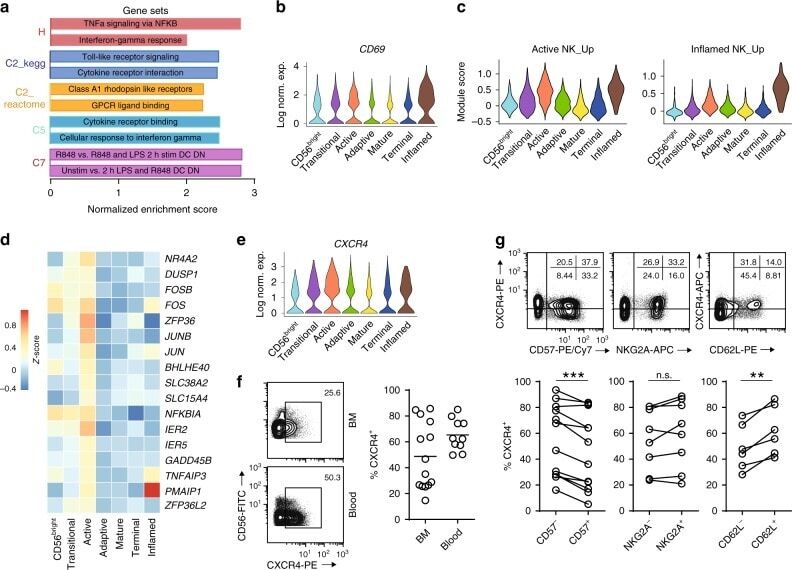
- Fig. 4 Active NK cells with a unique transcriptome profile. a Top two enriched gene sets (ranked by normalized enrichment score) of five different datasets from GSEA of the ""Inflamed NK"" cluster compared to the rest of the cells were plotted. b The expression of CD69 in the BM sample was shown as a violin plot. The y -axis represents log-normalized expression value. c Module score was calculated using up-regulated DEGs of ""Active NK"" (left) or ""Inflamed NK"" (right) cluster from BM sample and plotted via violin plots. d Up-regulated IEGs from ""Active NK"" cluster were plotted using heatmap of the BM sample. e The expression of CXCR4 in the BM sample was shown as a violin plot. The y -axis represents log-normalized expression value. f Percentage of CXCR4 + NK cells (gated on Lin - CD56 + cells) was evaluated via flow cytometry. g The expression of CXCR4 in CD57 +/- , CD62L +/- , or NKG2A +/- CD56 dim NK populations from BM was assessed via flow cytometry (top). Percentage of CXCR4 + cells within each population were quantified (bottom). n >= 6 from two to five independent experiments. Paired Student's t test was used for the statistical analysis. * P < 0.05; ** p < 0.01; *** p < 0.001; n.s. stands for ""not significant."" Source data for f and g are provided as a Source Data file. See also Supplementary Fig. 5
- Conjugate
- Yellow dye
- Submitted by
- Invitrogen Antibodies (provider)
- Main image

- Experimental details
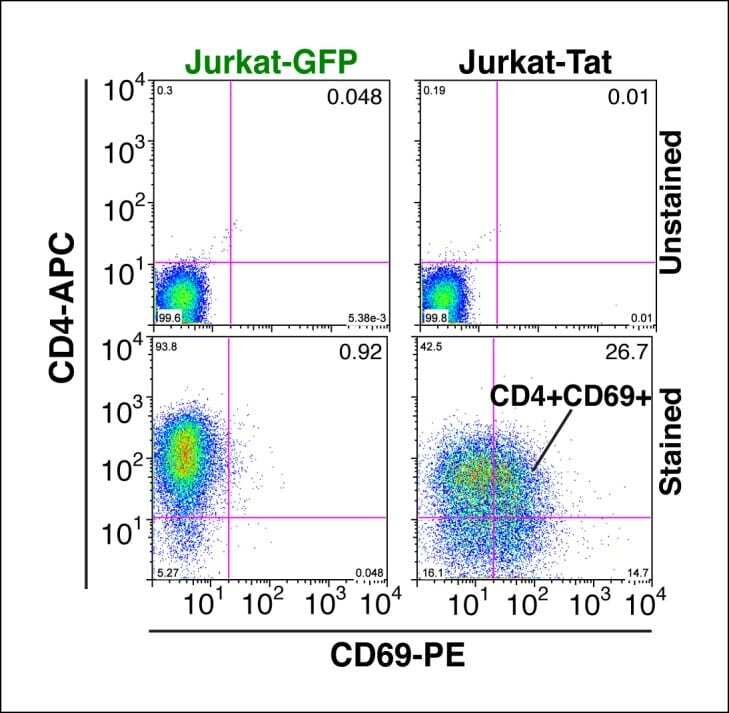
- Figure 1--figure supplement 4. Tat-induced transcriptome changes are also observed at the protein level. Flow cytometry analysis of Jurkat-GFP and -Tat cell lines induced with doxycycline for 24 hr and stained with CD4-APC and CD69-PE antibodies or unstained (negative control) to monitor levels of CD4 and CD69 proteins expressed at the cell surface. Note the increase in the CD69+ population in the presence of Tat. GFP, green fluorescent protein. DOI: http://dx.doi.org/
- Conjugate
- Yellow dye