Explore
 Validate
 Learn
Learn Flow cytometry
Antibody data
- Antibody Data
- Antigen structure
- References [11]
- Comments [0]
- Validations
- Flow cytometry [1]
- Other assay [12]
Submit
Validation data
Reference
Comment
Report error
- Product number
- 78-0699-42 - Provider product page

- Provider
- Invitrogen Antibodies
- Product name
- CD69 Monoclonal Antibody (FN50), Super Bright™ 780, eBioscience™
- Antibody type
- Monoclonal
- Antigen
- Other
- Description
- Description: The FN50 monoclonal antibody reacts with human CD69, also known as very early activation antigen (VEA). CD69 is approximately 30 kDa and is expressed on the cell-surface as a disulfide-linked dimer. CD69 is rapidly upregulated upon activation and expressed on lymphocytes, monocytes and platelets. Applications Reported: This FN50 antibody has been reported for use in flow cytometric analysis. Applications Tested: This FN50 antibody has been pre-titrated and tested by flow cytometric analysis of stimulated normal human peripheral blood cells. This can be used at 5 µL (0.125 µg) per test. A test is defined as the amount (µg) of antibody that will stain a cell sample in a final volume of 100 µL. Cell number should be determined empirically but can range from 10^5 to 10^8 cells/test. Super Bright 780 is a tandem dye that can be excited with the violet laser line (405 nm) and emits at 780 nm. We recommend using a 780/60 bandpass filter. Please make sure that your instrument is capable of detecting this fluorochrome. When using two or more Super Bright dye-conjugated antibodies in a staining panel, it is recommended to use Super Bright Complete Staining Buffer (Product # SB-4401) to minimize any non-specific polymer interactions. Please refer to the datasheet for Super Bright Staining Buffer for more information. In some experiments, we have observed that compensation values for Super Bright 780-conjugated antibodies are higher in the violet 450/50 channel when using UltraComp eBeads microspheres (Product # 01-2222-42) as compared to single-color stained cells. In such circumstances, we would recommend setting compensation with cells. We have also observed this in some experiments using AbC Total Antibody Compensation beads (Product # A10497). Light sensitivity: This tandem dye is sensitive to photo-induced oxidation. Please protect this vial and stained samples from light. Fixation: Samples can be stored in IC Fixation Buffer (Product # 00-8222) (100 µL of cell sample + 100 µL of IC Fixation Buffer) or 1-step Fix/Lyse Solution (Product # 00-5333) for up to 3 days in the dark at 4°C with minimal impact on brightness and FRET efficiency/compensation. Some generalizations regarding fluorophore performance after fixation can be made, but clone specific performance should be determined empirically. Excitation: 405 nm; Emission: 780 nm; Laser: Violet Laser Super Bright Polymer Dyes are sold under license from Becton, Dickinson and Company.
- Reactivity
- Human
- Host
- Mouse
- Isotype
- IgG
- Antibody clone number
- FN50
- Vial size
- 100 Tests
- Concentration
- 5 µL/Test
- Storage
- 4° C, store in dark, DO NOT FREEZE!
Submitted references SARS CoV-2 mRNA vaccination exposes latent HIV to Nef-specific CD8(+) T-cells.
Dysregulated Peripheral Invariant Natural Killer T Cells in Plaque Psoriasis Patients.
Identification of celastrol as a novel HIV-1 latency reversal agent by an image-based screen.
Human endoglin-CD3 bispecific T cell engager antibody induces anti-tumor effect in vivo.
Longitudinal single-cell profiling reveals molecular heterogeneity and tumor-immune evolution in refractory mantle cell lymphoma.
T cell receptor-dependent S-acylation of ZAP-70 controls activation of T cells.
Distinct populations of antigen-specific tissue-resident CD8+ T cells in human cervix mucosa.
Cancer-secreted exosomal miR-1468-5p promotes tumor immune escape via the immunosuppressive reprogramming of lymphatic vessels.
Coagulation factor V is a marker of tumor-infiltrating immune cells in breast cancer.
Transcriptional down-regulation of ccr5 in a subset of HIV+ controllers and their family members.
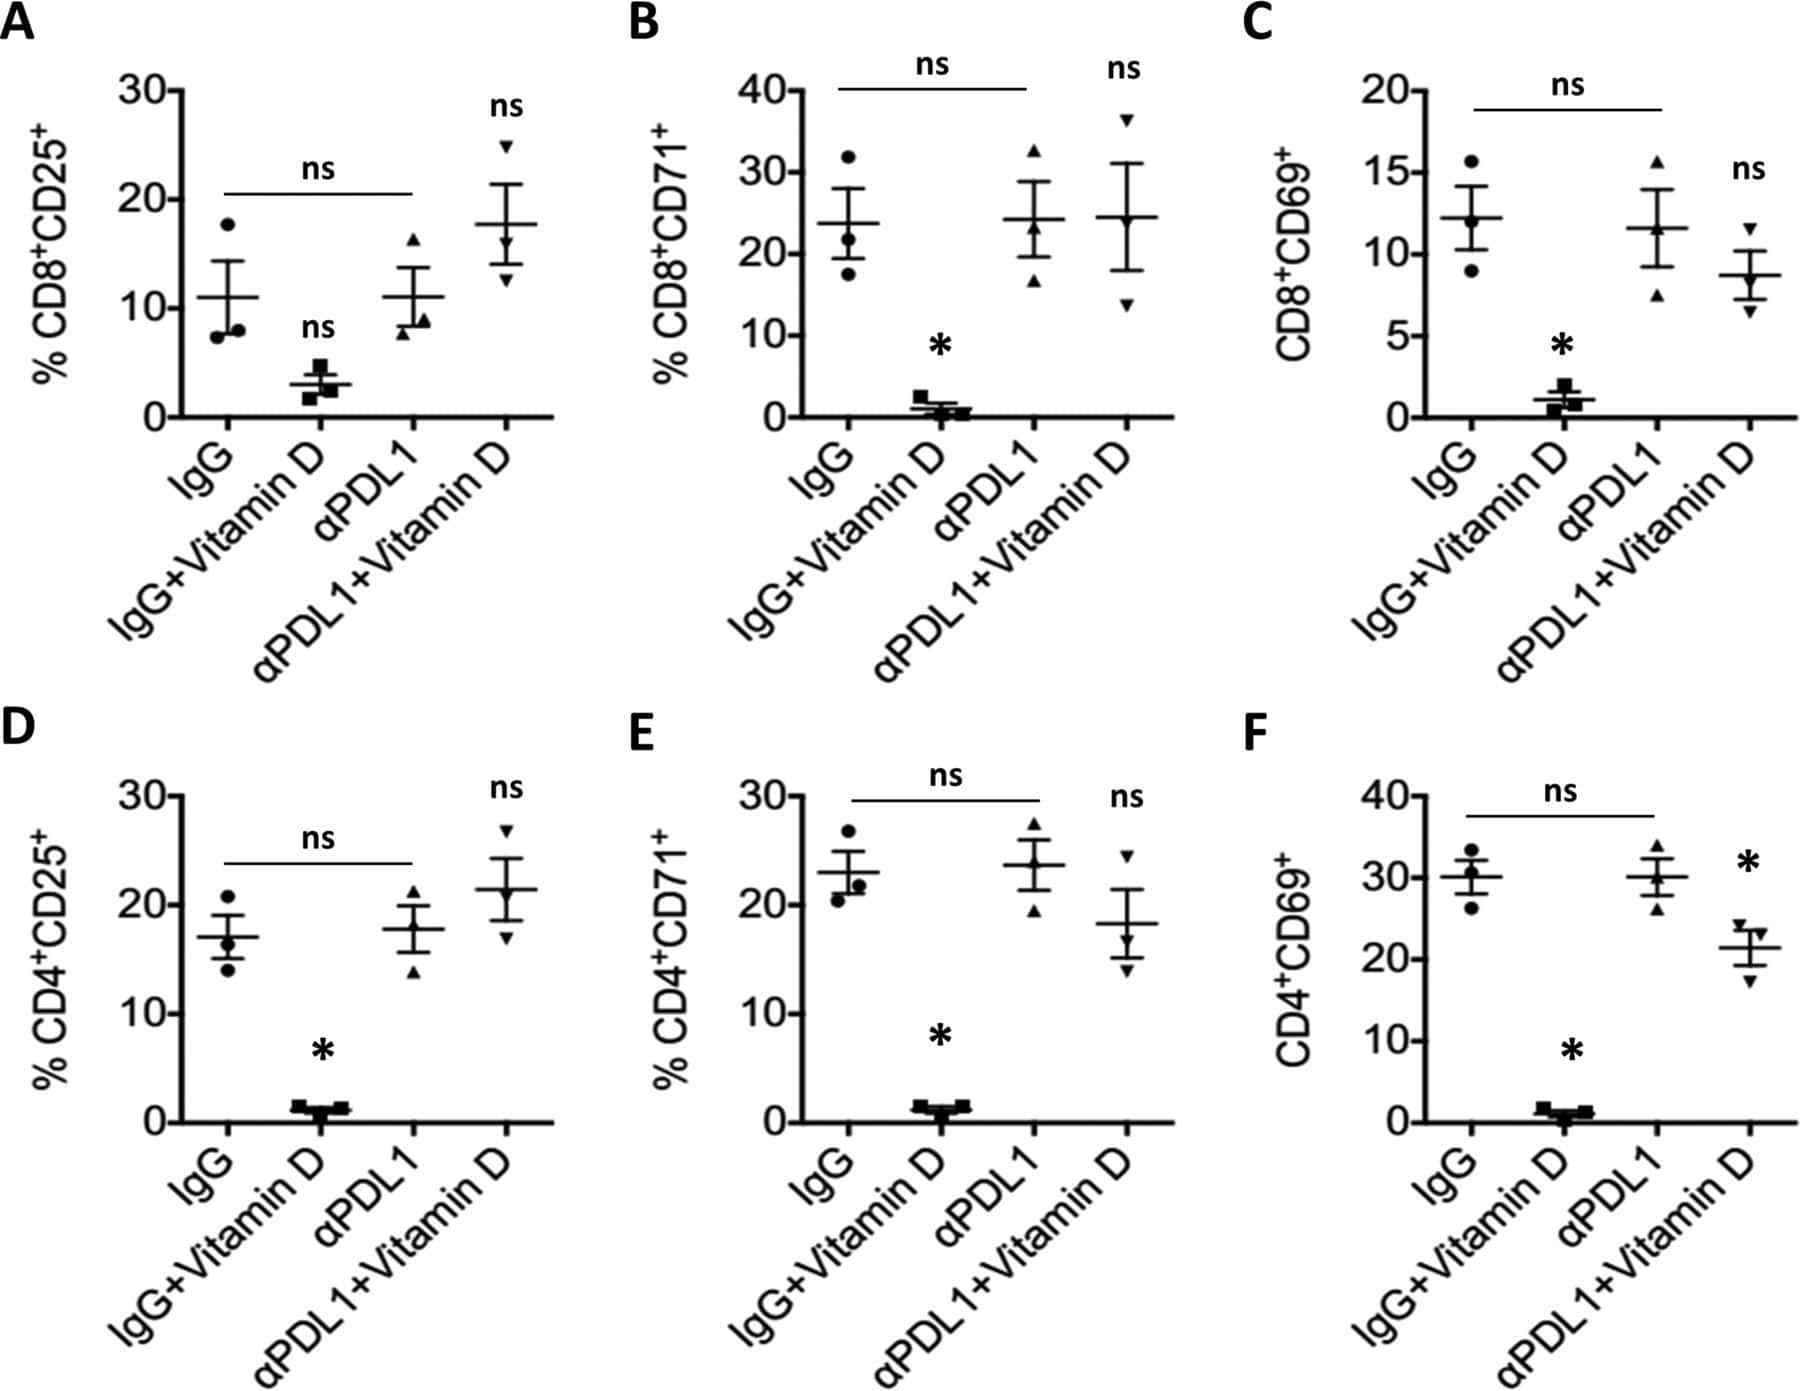
Hormonal vitamin D up-regulates tissue-specific PD-L1 and PD-L2 surface glycoprotein expression in humans but not mice.
Stevenson EM, Terry S, Copertino D, Leyre L, Danesh A, Weiler J, Ward AR, Khadka P, McNeil E, Bernard K, Miller IG, Ellsworth GB, Johnston CD, Finkelsztein EJ, Zumbo P, Betel D, Dündar F, Duncan MC, Lapointe HR, Speckmaier S, Moran-Garcia N, Papa MP, Nicholes S, Stover CJ, Lynch RM, Caskey M, Gaebler C, Chun TW, Bosque A, Wilkin TJ, Lee GQ, Brumme ZL, Jones RB
Nature communications 2022 Aug 19;13(1):4888
Nature communications 2022 Aug 19;13(1):4888
Dysregulated Peripheral Invariant Natural Killer T Cells in Plaque Psoriasis Patients.
Hu Y, Chen Y, Chen Z, Zhang X, Guo C, Yu Z, Xu P, Sun L, Zhou X, Gong Y, Yu Q, Shi Y
Frontiers in cell and developmental biology 2021;9:799560
Frontiers in cell and developmental biology 2021;9:799560
Identification of celastrol as a novel HIV-1 latency reversal agent by an image-based screen.
Liu H, Hu PW, Dubrulle J, Stossi F, Nikolai BC, Mancini MA, Rice AP
PloS one 2021;16(4):e0244771
PloS one 2021;16(4):e0244771
Human endoglin-CD3 bispecific T cell engager antibody induces anti-tumor effect in vivo.
Zhong L, Shi W, Gan L, Liu X, Huo Y, Wu P, Zhang Z, Wu T, Peng H, Huang Y, Zhao Y, Yuan Y, Deng Z, Tang H
Theranostics 2021;11(13):6393-6406
Theranostics 2021;11(13):6393-6406
Longitudinal single-cell profiling reveals molecular heterogeneity and tumor-immune evolution in refractory mantle cell lymphoma.
Zhang S, Jiang VC, Han G, Hao D, Lian J, Liu Y, Zhang R, McIntosh J, Wang R, Dang M, Dai E, Wang Y, Santos D, Badillo M, Leeming A, Chen Z, Hartig K, Bigcal J, Zhou J, Kanagal-Shamanna R, Ok CY, Lee H, Steiner RE, Zhang J, Song X, Nair R, Ahmed S, Rodriquez A, Thirumurthi S, Jain P, Wagner-Bartak N, Hill H, Nomie K, Flowers C, Futreal A, Wang L, Wang M
Nature communications 2021 May 17;12(1):2877
Nature communications 2021 May 17;12(1):2877
T cell receptor-dependent S-acylation of ZAP-70 controls activation of T cells.
Tewari R, Shayahati B, Fan Y, Akimzhanov AM
The Journal of biological chemistry 2021 Jan-Jun;296:100311
The Journal of biological chemistry 2021 Jan-Jun;296:100311
Distinct populations of antigen-specific tissue-resident CD8+ T cells in human cervix mucosa.
Peng T, Phasouk K, Bossard E, Klock A, Jin L, Laing KJ, Johnston C, Williams NA, Czartoski JL, Varon D, Long AN, Bielas JH, Snyder TM, Robins H, Koelle DM, McElrath MJ, Wald A, Corey L, Zhu J
JCI insight 2021 Aug 9;6(15)
JCI insight 2021 Aug 9;6(15)
Cancer-secreted exosomal miR-1468-5p promotes tumor immune escape via the immunosuppressive reprogramming of lymphatic vessels.
Zhou C, Wei W, Ma J, Yang Y, Liang L, Zhang Y, Wang Z, Chen X, Huang L, Wang W, Wu S
Molecular therapy : the journal of the American Society of Gene Therapy 2021 Apr 7;29(4):1512-1528
Molecular therapy : the journal of the American Society of Gene Therapy 2021 Apr 7;29(4):1512-1528
Coagulation factor V is a marker of tumor-infiltrating immune cells in breast cancer.
Tinholt M, Stavik B, Tekpli X, Garred Ø, Borgen E, Kristensen V, Sahlberg KK, Sandset PM, Iversen N
Oncoimmunology 2020 Sep 29;9(1):1824644
Oncoimmunology 2020 Sep 29;9(1):1824644
Transcriptional down-regulation of ccr5 in a subset of HIV+ controllers and their family members.
Gonzalo-Gil E, Rapuano PB, Ikediobi U, Leibowitz R, Mehta S, Coskun AK, Porterfield JZ, Lampkin TD, Marconi VC, Rimland D, Walker BD, Deeks S, Sutton RE
eLife 2019 Apr 9;8
eLife 2019 Apr 9;8
Hormonal vitamin D up-regulates tissue-specific PD-L1 and PD-L2 surface glycoprotein expression in humans but not mice.
Dimitrov V, Bouttier M, Boukhaled G, Salehi-Tabar R, Avramescu RG, Memari B, Hasaj B, Lukacs GL, Krawczyk CM, White JH
The Journal of biological chemistry 2017 Dec 15;292(50):20657-20668
The Journal of biological chemistry 2017 Dec 15;292(50):20657-20668
No comments: Submit comment
Supportive validation
- Submitted by
- Invitrogen Antibodies (provider)
- Main image
- Experimental details
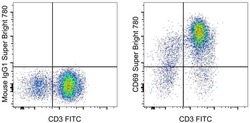
- Staining of overnight PHA-stimulated normal human peripheral blood cells with CD3 Monoclonal Antibody, FITC (Product # 11-0038-42) and Mouse IgG1 kappa Isotype Control, Super Bright 780 (Product # 78-4714-81) (left) or CD69 Monoclonal Antibody, Super Bright 780 (right). Cells in the lymphocyte gate were used for analysis.

Supportive validation
- Submitted by
- Invitrogen Antibodies (provider)
- Main image

- Experimental details
- NULL
- Submitted by
- Invitrogen Antibodies (provider)
- Main image
- Experimental details
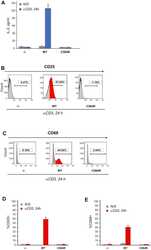
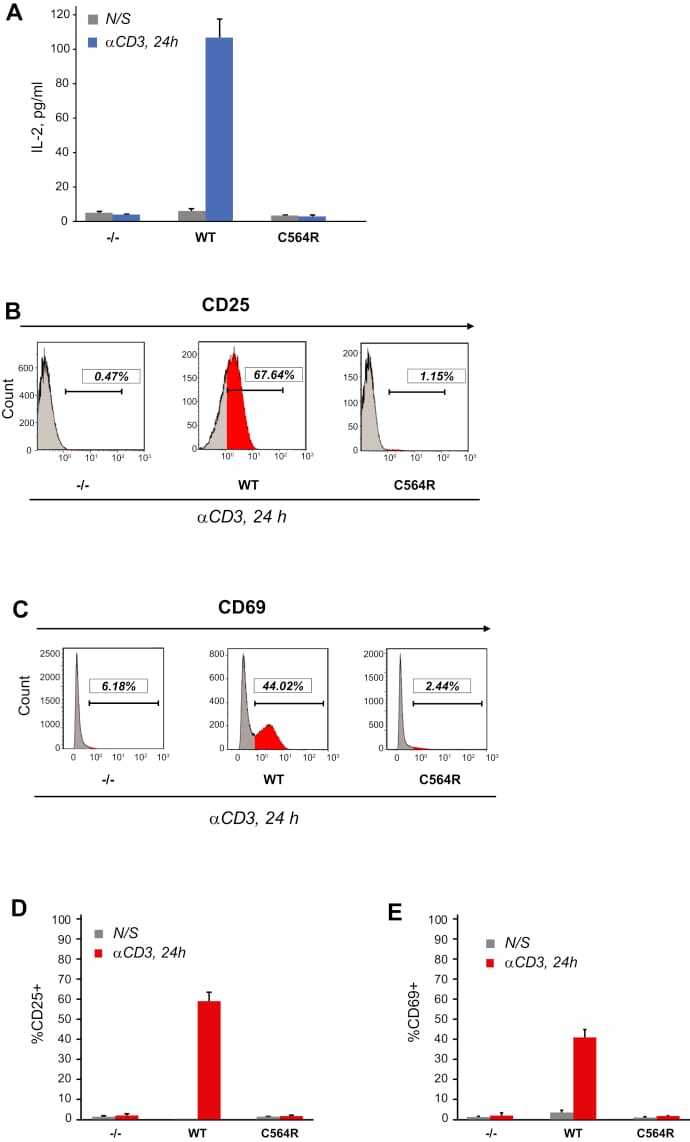
- Figure 5 S-acylation of ZAP-70 is required for T cell activation. A , IL-2 production by P116 (ZAP-70 -/-) Jurkat T cells stably rescued with WT or acylation-deficient C564R ZAP-70. IL-2 concentrations were measured by ELISA in supernatants from resting cells or cells stimulated for 24 h with plate-bound anti-CD3 antibody. Data shown are representative of three independent biological repeats and represented as mean +- SEM. B and C , Expression of CD25 and CD69 T cell surface activation markers by P116 stably rescued with WT or C564R ZAP-70. Cells were stimulated for 24 h with plate-bound anti-CD3 antibody and analyzed by flow cytometry. D and E , Quantification of CD25 and CD69 expression measured by flow cytometry. Data shown are pooled from three independent biological repeats and represented as mean +- SEM.
- Submitted by
- Invitrogen Antibodies (provider)
- Main image
- Experimental details
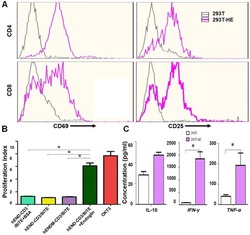
- Figure 3 hEND-CD3/BiTE activates T cells, stimulates T-cell proliferation, and increases secretion of Th1 cytokines. (A) PBMCs were co-cultured with 293T (grey signal) or 293T-hE (pink signal) cells in the presence of hEND-CD3/BiTE. The expression of T-cell activation markers CD69 (left panels) and CD25 (right panels) was detected in CD4 + (upper rows) and CD8 + (lower rows) by flow cytometry. (B) Proliferation of CFSE-labeled T cells in response to hEND-CD3/BiTE and other indicated reagents in the solid phase was measured using flow cytometry. The proliferation index was calculated using the ModFit LT software. (C) Supernatants were collected from the co-cultures of PBMCs with 293T (white bar) or 293T-hE cells (purple bar) in the presence of hEND-CD3/BiTE. The secretion of Th1 cytokines, including IFN-gamma, and TNF-alpha, and Th2 cytokine IL10 was measured using ELISA assays. * P < 0.001.

- Submitted by
- Invitrogen Antibodies (provider)
- Main image
- Experimental details
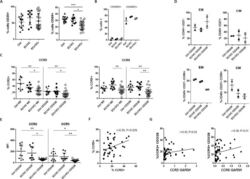
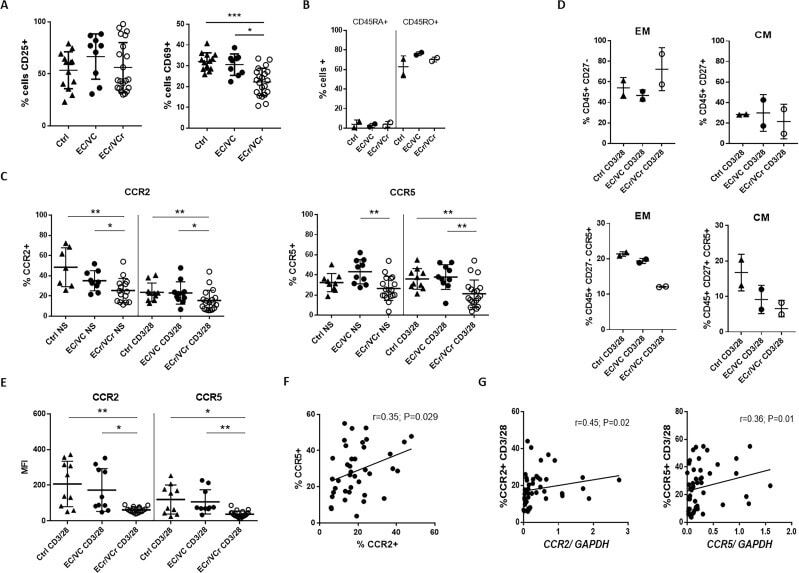
- 10.7554/eLife.44360.007 Figure 3. Lower proliferative responses and CCR2 and CCR5 cell surface levels in activated CD4 +T cells from ECr/VCrs. ( A ) Reduced CD69, but not CD25 levels in activated CD4 +T cells from ECr/VCrs. Graph shows representative data N = 13 (Ctrl), n = 9 (EC/VC) and n = 21 (ECr/VCr). ( B ) Comparable frequencies of naive CD45RA + and memory CD45RO + T cells after anti-CD3/CD28 activation between groups (n = 2 per group). ( C ) CCR5 and CCR2 cell surface levels measured by flow cytometry are reduced in freshly thawed (NS, non-stimulated) and activated CD4 +T cells (anti-CD3/28) from ECr/VCr. ( D ) Percentages of CCR5 +in effector memory (EM) and central memory (CM) compartments of activated CD4 +T cells (n = 2 per group). ( E ) Reduced CCR2 and CCR5 cell surface levels, expressed as MFI, in activated (anti-CD3/28) CD4 +T cells from ECr/VCr. Data in D-E shown pooled results from different experiments with n = 10 (Ctrl and EC/VC) and n = 19 (ECr/VCr). ( F ) Positive correlation between CCR2 and CCR5 cell surface levels. ( G ) Positive correlation observed between ccr2/ccr5 RNA levels and cell surface expression. Values obtained using the non-parametric Spearman correlation test. *p
- Submitted by
- Invitrogen Antibodies (provider)
- Main image
- Experimental details
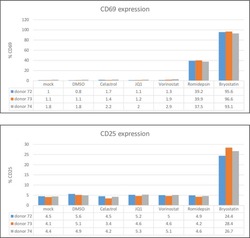
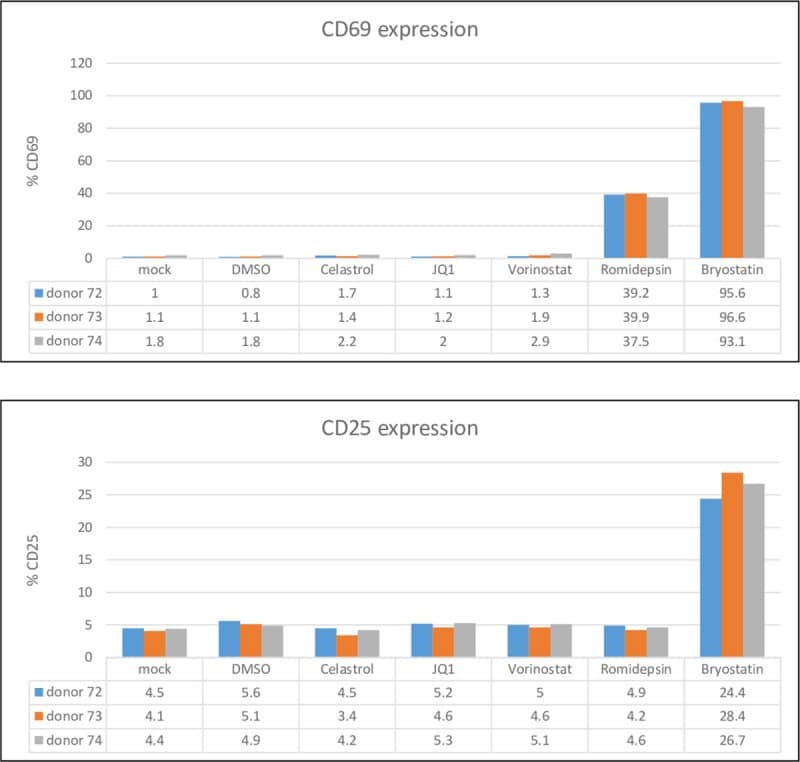
- 10.1371/journal.pone.0244771.g004 Fig 4 Celastrol does not activate resting CD4+ T cells. Resting CD4 + T cells were isolated from three healthy donors and treated with 400 nM celastrol, 200 nM JQ1, 400 nM vorinostat, 20 nM romidepsin, or 0.2 ng/ml bryostatin for 24 hours. Expression of CD25 and CD69 was quantified by flow cytometry.
- Submitted by
- Invitrogen Antibodies (provider)
- Main image
- Experimental details
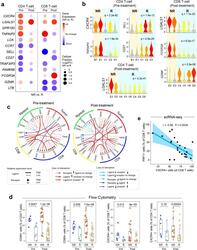
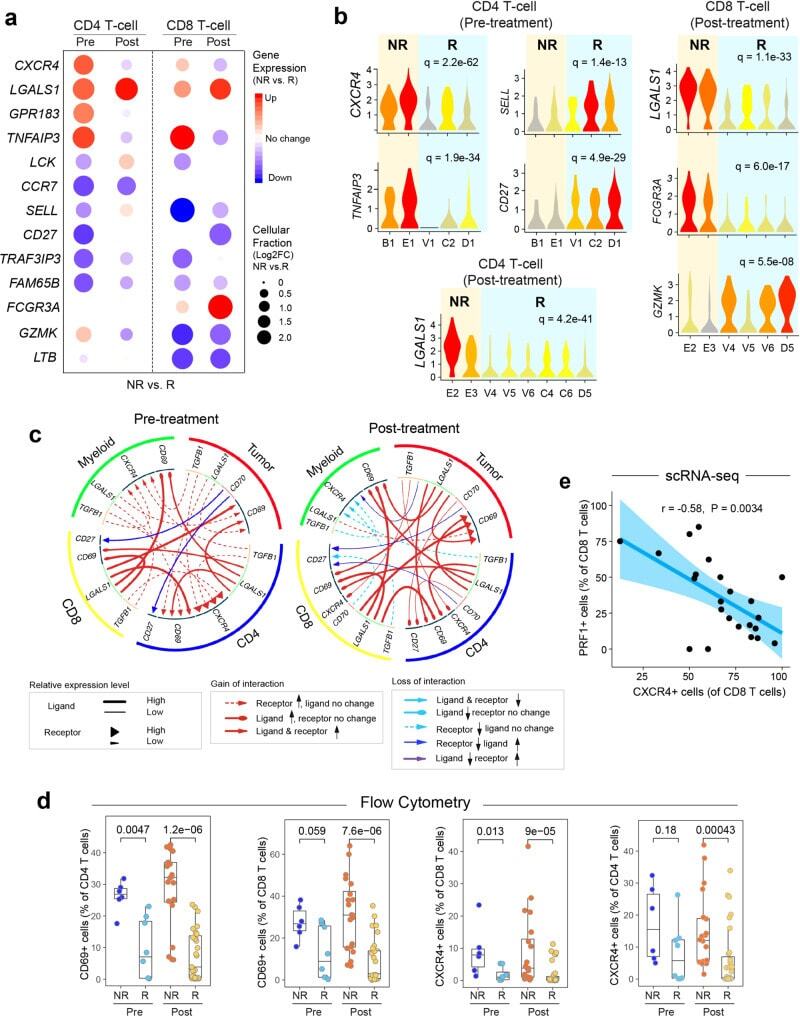
- Fig. 7 Aberrant cell-to-cell communication signaling associated with therapeutic resistance. a Differentially expressed genes (NR vs. R) in CD4+ and CD8+ T-cells pre- and post-ibrutinib treatment, respectively. Filled circle sizes are proportional to the Log2-scaled fold changes of each gene. Upregulated genes are shown in red; downregulated genes are shown in blue. Pre: pre-treatment; Post: post-treatment. b Representative genes are shown in violin plots. c Alterations (NR vs. R) of ligand-receptor-based cell-to-cell communication networks based in pre- and post-treatment samples. d Flow cytometry validation of upregulated CD69 and CXCR4 expression in ibrutinib nonresponders in comparison to the responders in additional patient cohorts ( n = 65 samples collected from 22 patients). The line in the box is the median value. The bottom and top of the box are the 25th and 75th percentiles of the sample. The bottom and top of the whiskers are the minimum and maximum values of the sample. p Values from the two-side Wilcoxon Signed-rank Test are shown. e Reverse correlation between the proportion of PRF1+ CD8 T cells (cytotoxic) and the expression of CXCR4 using scRNA-seq. The bounds of shape correspond to 95% confidence band for the regression line. The Pearson correlation coefficient ( r ) is shown. p Value corresponds to F test of linear regression model.
- Submitted by
- Invitrogen Antibodies (provider)
- Main image
- Experimental details
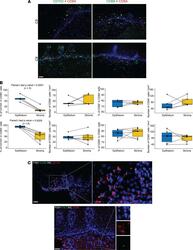
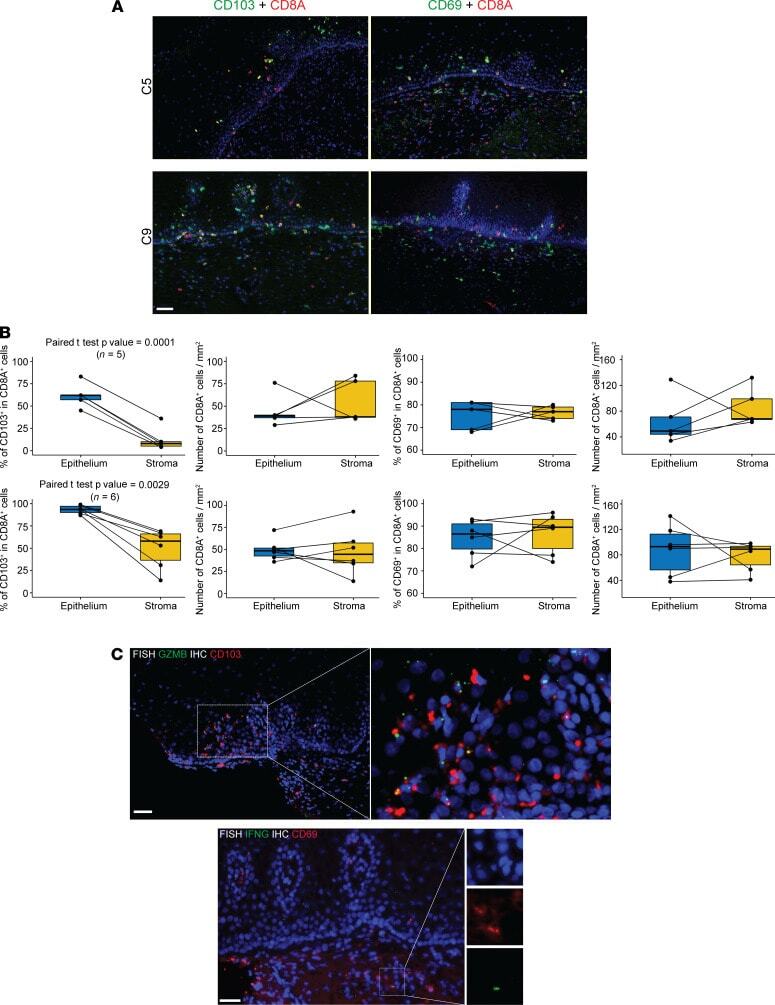
- Figure 4 Distinct anatomic location of CD103 + GZMB + CD8A + and CD69 + IFNG + CD8A + T cells in the human cervix. ( A ) Double immunofluorescence staining of cervix biopsies (C5 and C9) with CD8A and CD103 antibodies or CD8A and CD69 antibodies. ( B ) Quantitation of CD103 + CD8A + and CD69 + CD8A + cells and density of CD8A + cells in epithelium and stroma from individual cervix biopsies (top row, n = 5, C1, C5, C7.2, C8.1, and C8.2 from HSV-2-seropositive participants; bottom row: n = 6, C9 to C15 from HSV-2-seronegative participants). ( C ) CD103 + GZMB + cells in epithelium and CD69 + IFNG + cells in stroma of cervix biopsies ( n = 3). Top panels: RNA FISH for GZMB and immunofluorescence staining for CD103; bottom panels: RNA FISH for IFNG and immunofluorescence staining for CD69. Scale bar: 50 mum.
- Submitted by
- Invitrogen Antibodies (provider)
- Main image

- Experimental details
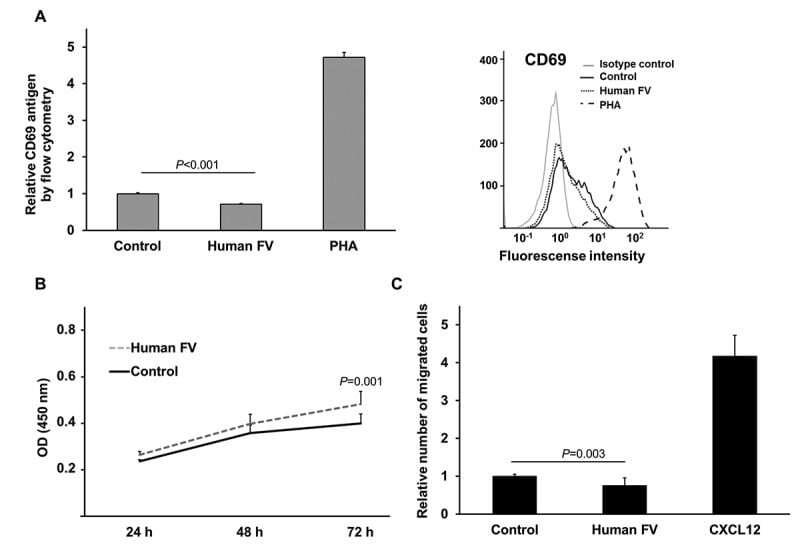
- Figure 2. T cell activation marker CD69 levels, WST-1 proliferation analysis and cell migration of FV treated Jurkat T cells. Cell surface expression of CD69, measured by flow cytometry, following 24 hour treatment with human FV (7 ug/mL) or control (50% (vol/vol) glycerol/H2O) in Jurkat T cells. The T cell mitogen PHA (20 ug/mL) served as positive control for CD69 expression. Left: Relative cell surface expression of CD69. Mean values + SD (n = 6 biological parallels) of two individual experiments. Right: Representative histogram showing the cell surface expression of CD69 for isotype control (background staining), control, human FV, and PHA (positive control). B) Cell viability following 24, 48, and 72 hours of treatment with human FV (7 ug/mL) or control (50% (vol/vol) glycerol/H2O) in Jurkat T cells. WST-1 was added to the cells and OD measurements were conducted after 1 hour incubation. Mean values + SD (n = 15 biological parallels) of three individual experiments. C) The relative number of migrated Jurkat T cells in response to human FV (7 ug/mL) or control (50% (vol/vol) glycerol/H2O) in the bottom chamber of a transwell assay. CXCL12 served as a positive control for migration. Cells were allowed to migrate for 24 hours. Mean values + SD (n = 9 biological parallels) of three individual experiments. P -values for two-group comparisons (Mann-Whitney U) are indicated.
- Submitted by
- Invitrogen Antibodies (provider)
- Main image
- Experimental details
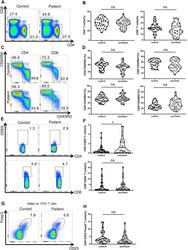
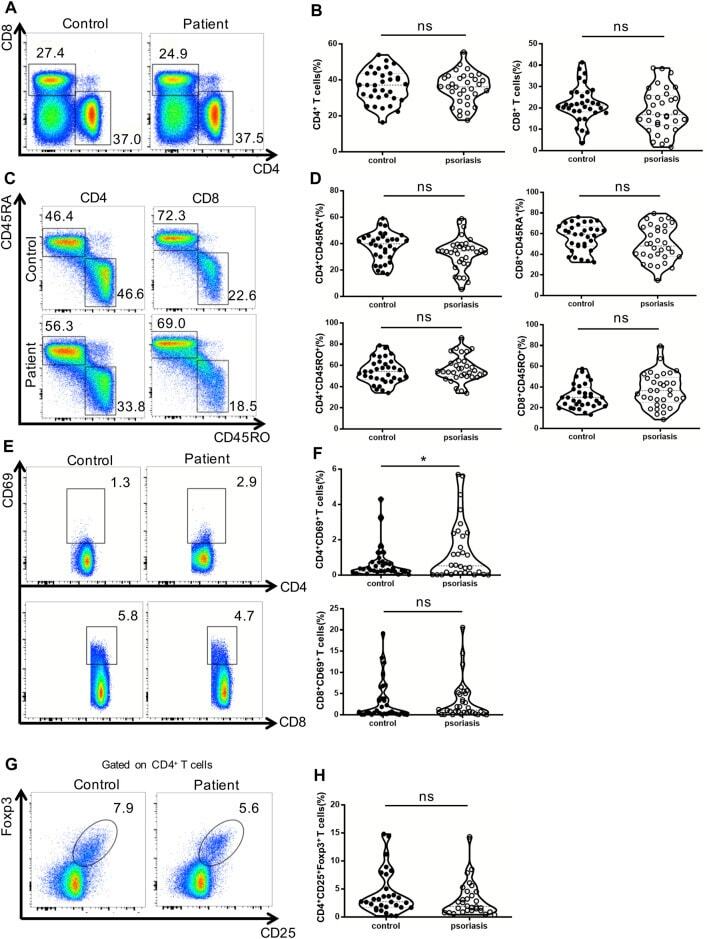
- FIGURE 1 Distribution of conventional T cells and Tregs in the peripheral blood. (A) Flow cytometry analysis of CD4 + and CD8 + T cells in PBMCs from moderate-to-severe plaque psoriasis patients and healthy controls. (B) Summary plots showing individual results of the frequency of CD4 + and CD8 + T cells in moderate-to-severe plaque psoriasis patients versus healthy controls. (C) Flow cytometry analysis of memory (CD45RO+) and naive (CD45RA+) CD4 + and CD8 + T cells in PBMCs from moderate-to-severe plaque psoriasis patients and healthy controls. (D) Summary plots showing individual results of the frequency of CD45RA+ and CD45RO + CD4 + and CD8 + T cells in moderate-to-severe plaque psoriasis patients versus healthy controls. (E) Flow cytometry analysis of CD69 expression in CD4 + and CD8 + T cells in PBMCs from moderate-to-severe plaque psoriasis patients and healthy controls. (F) Summary plots showing individual results of the frequency of CD69 + CD4 + T cells and CD69 + CD8 + T cells in moderate-to-severe plaque psoriasis patients versus healthy controls. (G) Flow cytometry analysis of CD4 + CD25 + Foxp3+ Tregs in PBMCs from moderate-to-severe plaque psoriasis patients and healthy controls. (H) Summary plots showing individual results of the frequency of CD4 + CD25 + Foxp3+ Tregs in psoriasis patients versus healthy controls. Data show mean +SEM. p -values were determined by paired Student's t-test. ns, no significance, * p < 0.05, ** p < 0.01, *** p < 0.001 and **** p < 0.
- Submitted by
- Invitrogen Antibodies (provider)
- Main image
- Experimental details
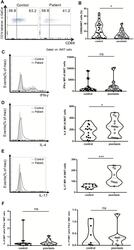
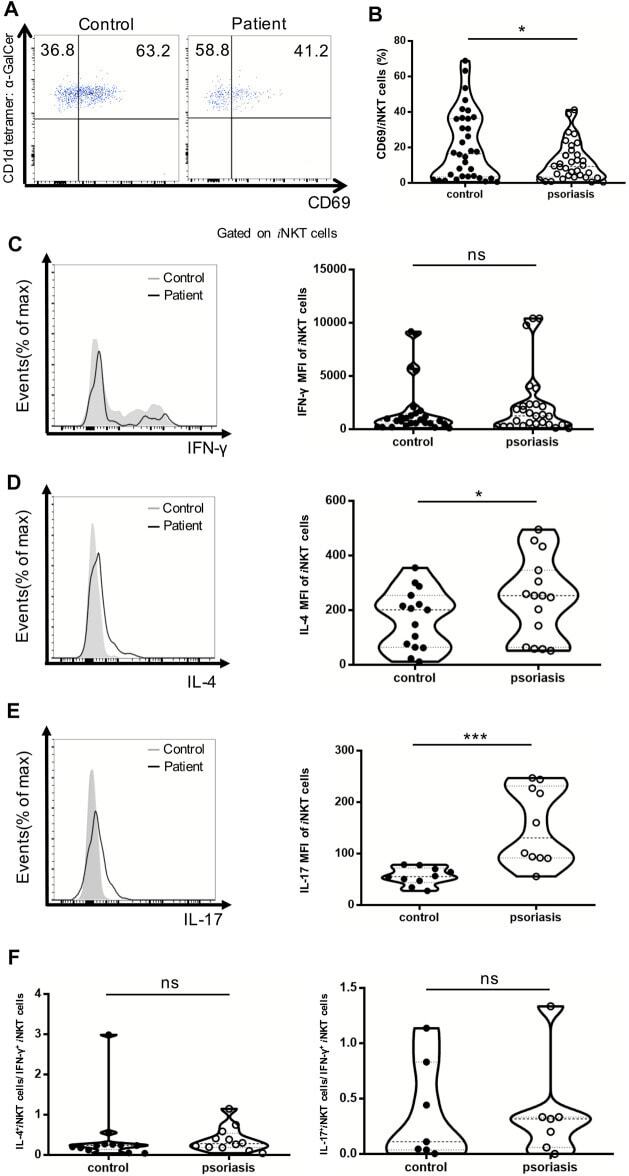
- FIGURE 4 i NKT cells activation status and cytokine production in PBMCs of psoriasis patients. Intracellular IFN-gamma and IL-4 production of circulating i NKT cells was analyzed after stimulation with Cell Stimulation Cocktail for 5 h. (A) Representative FACS dot plots for iNKT cell CD69 expression in psoriasis patients and healthy controls. (B) Summary plots showing individual results of the frequency of CD69 + iNKT cells in psoriasis patients versus healthy controls. (C) Representative histogram and summary plots showing individual results of the MFI of IFN-gamma-producing iNKT cells in psoriasis patients versus healthy controls. (D) Representative histogram and summary plots showing individual results of the MFI of IL-4-producing iNKT cells in psoriasis patients versus healthy controls. (E) Representative histogram and summary plots showing individual results of the MFI of IL-17-producing iNKT cells in psoriasis patients versus healthy controls. (F) Summary plots showing individual results of IL-4-producing i NKT cells/IFN-gamma-producing i NKT cells and IL-17-producing i NKT cells/IFN-gamma-producing i NKT cells in psoriasis patients versus healthy controls. Data show mean +SEM. p -values were determined by paired Student's t-test. ns, no significance, * p < 0.05, ** p < 0.01, *** p < 0.001 and **** p < 0.0001.
- Submitted by
- Invitrogen Antibodies (provider)
- Main image
- Experimental details
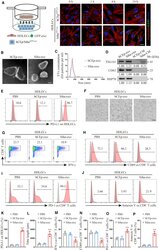
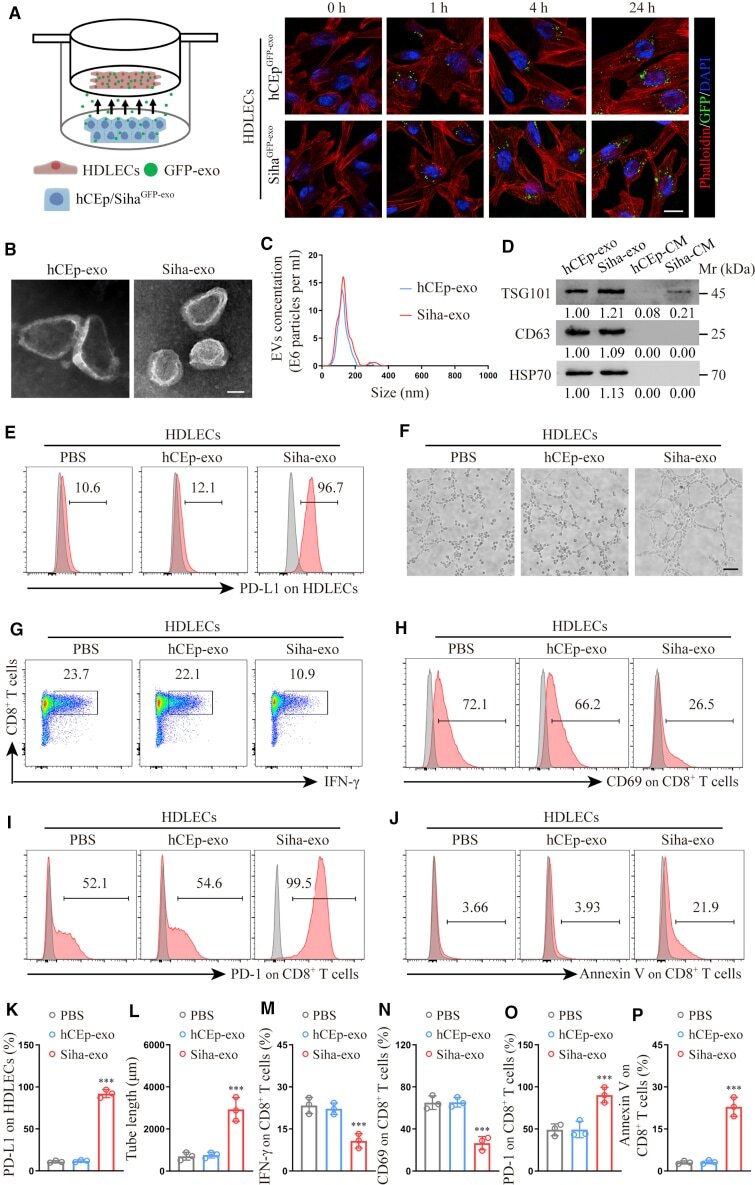
- Cancer-secreted exosomes reprogram HDLECs to suppress CD8 + T cell immunity (A) Confocal imaging showed the transfer of GFP-labeled exosomes (green) to phalloidin-labeled HDLECs (red) at the indicated time point using Transwell chamber. (B and C) Exosomes secreted by Siha and hCEp were detected by transmission electron microscopy (TEM) (B) and NanoSight analysis (C). Scale bar, 100 nm. (D) Western blot for characteristic proteins of exosomes compared with conditioned media (CM) from Siha and hCEp. (E and F) Flow cytometry analysis of PD-L1 expression (E) and tube-formation assay (F) in HDLECs treated with PBS, hCEp-exo, or Siha-exo. Scale bar, 10 mum. (G-J) Flow cytometry analysis of IFN-gamma (G), CD69 (H), PD-1 (I), and Annexin V (J) expression on CD8 + T cells co-cultured with HDLECs treated with PBS, hCEp-exo, or Siha-exo. (K and L) Quantification of PD-L1 expression (K) and tube formation (L) in HDLECs with indicated treatment. (M-P) Quantification of IFN-gamma (M), CD69 (N), PD-1 (O), and Annexin V (P) expression on CD8 + T cells co-cultured with HDLECs with indicated treatment. The numeric values under the western blot bands represent the protein relative expression (baseline value 1.00). Error bars represent the mean +- SD of three independent experiments. ***p < 0.001.
- Submitted by
- Invitrogen Antibodies (provider)
- Main image

- Experimental details
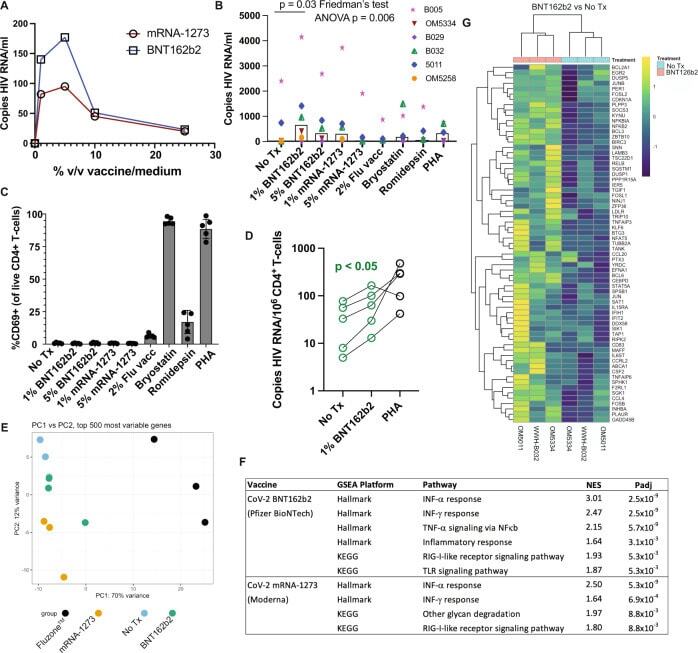
- The BNT162b2 mRNA vaccine stimulates the RIG-I/TLR - TNF-alpha - NFkappab axis and activates HIV transcription ex vivo. A qPCR measurements of HIV RNA in supernatants, 48 hours following ex vivo treatment of PBMCs from an ART-treated participant with the indicated concentrations of BNT126b2 (Pfizer BioNTech) or mRNA-1273 (Moderna) mRNA vaccines. B Extension of results from A to n = 6 ART-treated participants, adding treatments with 2% volume/volume Fluzone(tm) influenza vaccine, 25 nM bryostatin-1, 40 nM romidepsin, or 2 mug/ml phytohemagglutinin-L (PHA). P values were calculated by Friedman test with Dunn's multiple comparison test (two-tailed). C Flow cytometry data from the same samples n = 5 donors harvested for ( B ) Shown are % CD69 + (activated) following gating on viable CD4 + T-cells. Data are presented as mean values +/- SD. D Cell-associated HIV RNA measures from the same samples as ( B ) P value of 0.0487 was calculated by a two-tailed paired t test between No Tx and 1% BNT162b2. E - G Bulk mRNA-seq data was generated using a subset of the samples plotted in (WWH-B032, OM5011, and OM5334). B , E Principal component analysis (PCA). The results show that transcriptional profiles of BNT126b2- and mRNA-1273-treated cells are more similar to 'No treatment' and to each other than Fluzone(tm)-treated cells. F Gene set enrichment analyses showing pathways activated following mRNA vaccine treatments. Benjamini-Hochberg corrected P-values were calculated with the fgsea pack