Explore
 Validate
 Learn
Learn Western blot
 Immunocytochemistry
 Immunohistochemistry
Antibody data
- Antibody Data
- Antigen structure
- References [1]
- Comments [0]
- Validations
- Immunocytochemistry [1]
- Other assay [1]
Submit
Validation data
Reference
Comment
Report error
- Product number
- PA5-102562 - Provider product page

- Provider
- Invitrogen Antibodies
- Product name
- CD69 Polyclonal Antibody
- Antibody type
- Polyclonal
- Antigen
- Synthetic peptide
- Description
- Antibody detects endogenous levels of total CD69.
- Reactivity
- Human, Mouse, Rat
- Host
- Rabbit
- Isotype
- IgG
- Vial size
- 100 µL
- Concentration
- 1 mg/mL
- Storage
- -20°C
Submitted references Molecular Mechanism of Sphingosine-1-Phosphate Receptor 1 Regulating CD4(+) Tissue Memory in situ T Cells in Primary Sjogren's Syndrome.
Yang XX, Yang C, Wang L, Zhou YB, Yuan X, Xiang N, Wang YP, Li XM
International journal of general medicine 2021;14:6177-6188
International journal of general medicine 2021;14:6177-6188
No comments: Submit comment
Supportive validation
- Submitted by
- Invitrogen Antibodies (provider)
- Main image

- Experimental details
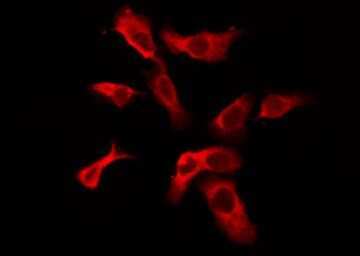
- Immunofluorescent analysis of CD69 in HUVEC cell lysate. Samples were fixed with paraformaldehyde, permeabilized with 0.1% Triton X-100, blocked with 10% serum (45 min at 25°C) incubated with CD69 polyclonal antibody (Product # PA5-102562) using a dilution of 1:200 (1 hr, 37°C), and followed by goat anti-rabbit IgG Alexa Fluor 594 at a dilution of 1:600.
Supportive validation
- Submitted by
- Invitrogen Antibodies (provider)
- Main image
- Experimental details
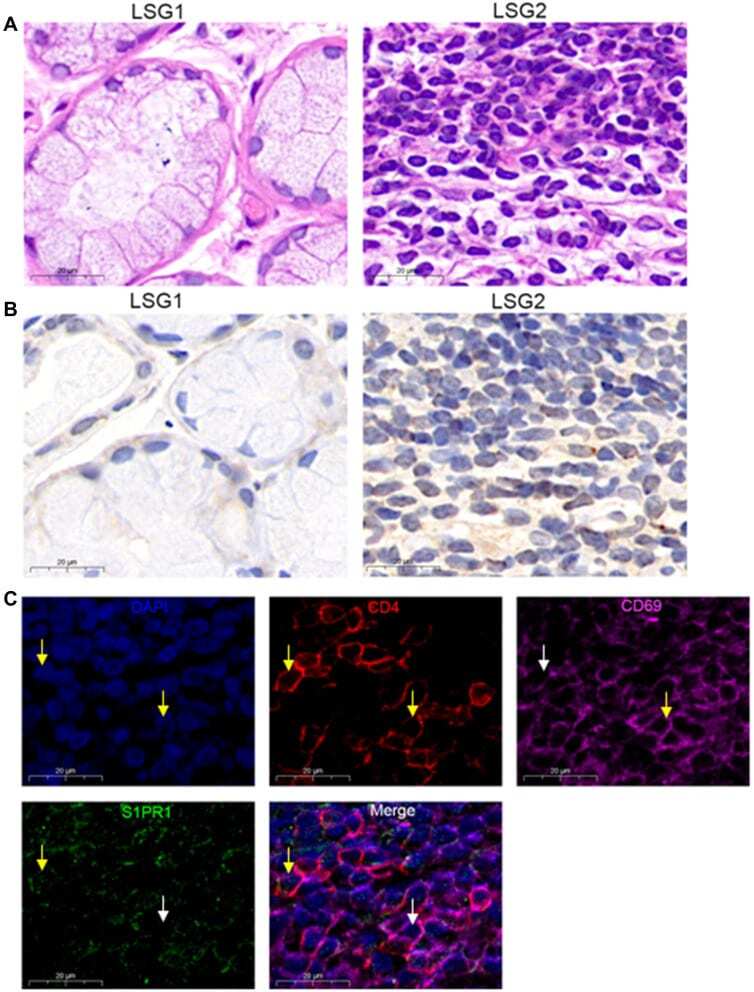
- Figure 1 S1PR1 expression in CD4 + CD69 + T RM cells. ( A ) Lymphocyte infiltration was detected by H&E staining of the labial salivary glands(LSG) of patients with pSS. ( B ) Expression of S1PR1 was detected by immunohistochemistry in labial salivary glands (LSG) of patients with pSS. ( C ) Immunofluorescence was performed to detect the expression of CD4, CD69 and S1PR1 in LSG samples with lymphocyte infiltration foci. Bar=20mum. DAPI was used to stain the nuclei and glowed blue. CD4 was pink light, CD69 was red light, and S1PR1 was green light. The yellow arrows point to positive fluorescence results and the white arrows point to negative fluorescence results in the DAPI, CD4, CD69 and S1PR1 image. In the in Merge image, the yellow arrows represent only S1PR1 expression in CD4 + T cells and no surface expression of CD69, the white arrows point to the CD4 + CD69 + T cells without the expression of S1PR1.