Explore
 Validate
 Learn
Learn Flow cytometry
 Other assay
Antibody data
- Antibody Data
- Antigen structure
- References [15]
- Comments [0]
- Validations
- Other assay [5]
Submit
Validation data
Reference
Comment
Report error
- Product number
- 14-0839-80 - Provider product page

- Provider
- Invitrogen Antibodies
- Product name
- CD83 Monoclonal Antibody (HB15e), eBioscience™
- Antibody type
- Monoclonal
- Antigen
- Other
- Description
- Description: The HB15e monoclonal antibody reacts with human CD83, a 45 kDa transmembrane glycoprotein. CD83, a member of the Ig superfamily, is expressed on cultured dendritic cells, interdigitating, follicular, and circulating dendritic cells as well as some proliferating lymphocytes, and human cell lines express this antigen. While the function of CD83 is unclear, it can serve as a useful marker for mature human blood dendritic cells. Applications Reported: The HB15e antibody has been reported for use in flow cytometric analysis. Applications Tested: The HB15e antibody has been tested by flow cytometric analysis of human peripheral blood-derived dendritic cells. This can be used at less than or equal to 1 µg per test. A test is defined as the amount (µg) of antibody that will stain a cell sample in a final volume of 100 µL. Cell number should be determined empirically but can range from 10^5 to 10^8 cells/test. It is recommended that the antibody be carefully titrated for optimal performance in the assay of interest. Purity: Greater than 90%, as determined by SDS-PAGE. Aggregation: Less than 10%, as determined by HPLC. Filtration: 0.2 µm post-manufacturing filtered.
- Reactivity
- Human
- Host
- Mouse
- Isotype
- IgG
- Antibody clone number
- HB15e
- Vial size
- 25 µg
- Concentration
- 0.5 mg/mL
- Storage
- 4° C
Submitted references STAT3 phosphorylation at Ser727 and Tyr705 differentially regulates the EMT-MET switch and cancer metastasis.
Contact-dependent delivery of IL-2 by dendritic cells to CD4 T cells in the contraction phase promotes their long-term survival.
The Polyunsaturated Fatty Acids Arachidonic Acid and Docosahexaenoic Acid Induce Mouse Dendritic Cells Maturation but Reduce T-Cell Responses In Vitro.
In vitro and in vivo studies of the immunomodulatory effect of Echinacea purpurea on dendritic cells.
Comparative transcriptional and functional profiling defines conserved programs of intestinal DC differentiation in humans and mice.
Dectin-1/TLR2 and NOD2 agonists render dendritic cells susceptible to infection by X4-using HIV-1 and promote cis-infection of CD4(+) T cells.
The mucosal factors retinoic acid and TGF-β1 induce phenotypically and functionally distinct dendritic cell types.
CD137L-stimulated dendritic cells are more potent than conventional dendritic cells at eliciting cytotoxic T-cell responses.
Noncanonical dendritic cell differentiation and survival driven by a bacteremic pathogen.
CD137 ligand signaling induces human monocyte to dendritic cell differentiation.
IL-15 trans-presentation promotes human NK cell development and differentiation in vivo.
Lung dendritic cell expression of maturation molecules increases with worsening chronic obstructive pulmonary disease.
CD14+ blood monocytes can differentiate into functionally mature CD83+ dendritic cells.
A distinct pattern of cytokine gene expression by human CD83+ blood dendritic cells.
Human blood dendritic cells selectively express CD83, a member of the immunoglobulin superfamily.
Lin WH, Chang YW, Hong MX, Hsu TC, Lee KC, Lin C, Lee JL
Oncogene 2021 Jan;40(4):791-805
Oncogene 2021 Jan;40(4):791-805
Contact-dependent delivery of IL-2 by dendritic cells to CD4 T cells in the contraction phase promotes their long-term survival.
Tong D, Zhang L, Ning F, Xu Y, Hu X, Shi Y
Protein & cell 2020 Feb;11(2):108-123
Protein & cell 2020 Feb;11(2):108-123
The Polyunsaturated Fatty Acids Arachidonic Acid and Docosahexaenoic Acid Induce Mouse Dendritic Cells Maturation but Reduce T-Cell Responses In Vitro.
Carlsson JA, Wold AE, Sandberg AS, Östman SM
PloS one 2015;10(11):e0143741
PloS one 2015;10(11):e0143741
In vitro and in vivo studies of the immunomodulatory effect of Echinacea purpurea on dendritic cells.
El-Ashmawy NE, El-Zamarany EA, Salem ML, El-Bahrawy HA, Al-Ashmawy GM
Journal, genetic engineering & biotechnology 2015 Dec;13(2):185-192
Journal, genetic engineering & biotechnology 2015 Dec;13(2):185-192
Comparative transcriptional and functional profiling defines conserved programs of intestinal DC differentiation in humans and mice.
Watchmaker PB, Lahl K, Lee M, Baumjohann D, Morton J, Kim SJ, Zeng R, Dent A, Ansel KM, Diamond B, Hadeiba H, Butcher EC
Nature immunology 2014 Jan;15(1):98-108
Nature immunology 2014 Jan;15(1):98-108
Dectin-1/TLR2 and NOD2 agonists render dendritic cells susceptible to infection by X4-using HIV-1 and promote cis-infection of CD4(+) T cells.
Côté SC, Plante A, Tardif MR, Tremblay MJ
PloS one 2013;8(7):e67735
PloS one 2013;8(7):e67735
The mucosal factors retinoic acid and TGF-β1 induce phenotypically and functionally distinct dendritic cell types.
den Hartog G, van Altena C, Savelkoul HF, van Neerven RJ
International archives of allergy and immunology 2013;162(3):225-36
International archives of allergy and immunology 2013;162(3):225-36
CD137L-stimulated dendritic cells are more potent than conventional dendritic cells at eliciting cytotoxic T-cell responses.
Harfuddin Z, Kwajah S, Chong Nyi Sim A, Macary PA, Schwarz H
Oncoimmunology 2013 Nov 1;2(11):e26859
Oncoimmunology 2013 Nov 1;2(11):e26859
Noncanonical dendritic cell differentiation and survival driven by a bacteremic pathogen.
Miles B, Scisci E, Carrion J, Sabino GJ, Genco CA, Cutler CW
Journal of leukocyte biology 2013 Aug;94(2):281-9
Journal of leukocyte biology 2013 Aug;94(2):281-9
CD137 ligand signaling induces human monocyte to dendritic cell differentiation.
Kwajah M M S, Schwarz H
European journal of immunology 2010 Jul;40(7):1938-49
European journal of immunology 2010 Jul;40(7):1938-49
IL-15 trans-presentation promotes human NK cell development and differentiation in vivo.
Huntington ND, Legrand N, Alves NL, Jaron B, Weijer K, Plet A, Corcuff E, Mortier E, Jacques Y, Spits H, Di Santo JP
The Journal of experimental medicine 2009 Jan 16;206(1):25-34
The Journal of experimental medicine 2009 Jan 16;206(1):25-34
Lung dendritic cell expression of maturation molecules increases with worsening chronic obstructive pulmonary disease.
Freeman CM, Martinez FJ, Han MK, Ames TM, Chensue SW, Todt JC, Arenberg DA, Meldrum CA, Getty C, McCloskey L, Curtis JL
American journal of respiratory and critical care medicine 2009 Dec 15;180(12):1179-88
American journal of respiratory and critical care medicine 2009 Dec 15;180(12):1179-88
CD14+ blood monocytes can differentiate into functionally mature CD83+ dendritic cells.
Zhou LJ, Tedder TF
Proceedings of the National Academy of Sciences of the United States of America 1996 Mar 19;93(6):2588-92
Proceedings of the National Academy of Sciences of the United States of America 1996 Mar 19;93(6):2588-92
A distinct pattern of cytokine gene expression by human CD83+ blood dendritic cells.
Zhou LJ, Tedder TF
Blood 1995 Nov 1;86(9):3295-301
Blood 1995 Nov 1;86(9):3295-301
Human blood dendritic cells selectively express CD83, a member of the immunoglobulin superfamily.
Zhou LJ, Tedder TF
Journal of immunology (Baltimore, Md. : 1950) 1995 Apr 15;154(8):3821-35
Journal of immunology (Baltimore, Md. : 1950) 1995 Apr 15;154(8):3821-35
No comments: Submit comment
Supportive validation
- Submitted by
- Invitrogen Antibodies (provider)
- Main image

- Experimental details
- 4 PDDCs are immature, but accessory molecule expression can be induced. PDDCs were generated at 24 h and measured by flow cytometry for the accessory molecules CD83, CD86, CD40, and HLA-DR. (A) mfa-1 + PDDCs (Pg381, DPG-3) displayed a low, natural expression of accessory molecules. mfa1 - PDDCs had significantly higher levels of CD83, whereas all PDDC groups had significantly elevated CD40 surface expression. (B) When PDDCs were subsequently matured, CD83 and CD86 surface expression was significantly lower in all of the infected groups compared with mature MoDCs. All PDDC groups had significantly elevated CD40 surface expression after maturation compared with MoDCs. P P

- Submitted by
- Invitrogen Antibodies (provider)
- Main image
- Experimental details
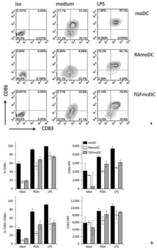
- Fig. 3 Expression of maturation and activation marker CD83 and CD86 by the three DC types. a Isotype control staining (left column), followed by surface marker staining of non-stimulated (medium, shown in the middle) or LPS-stimulated (right column) moDCs (top), RAmoDCs (middle) and TGFmoDCs (bottom) are displayed. b Mean percentage, MFI and standard error are shown of 4 different donors after 48 h of incubation with medium or bacterial ligands. c p values of t test between DC subsets after activation with bacterial ligands. Statistical differences between DC subtypes are shown (t test). Similar results (not shown) were obtained with DCs stimulated for 24 h from 3 independent donors.

- Submitted by
- Invitrogen Antibodies (provider)
- Main image
- Experimental details
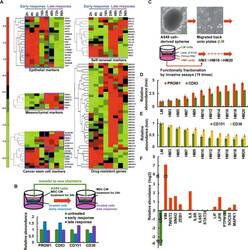
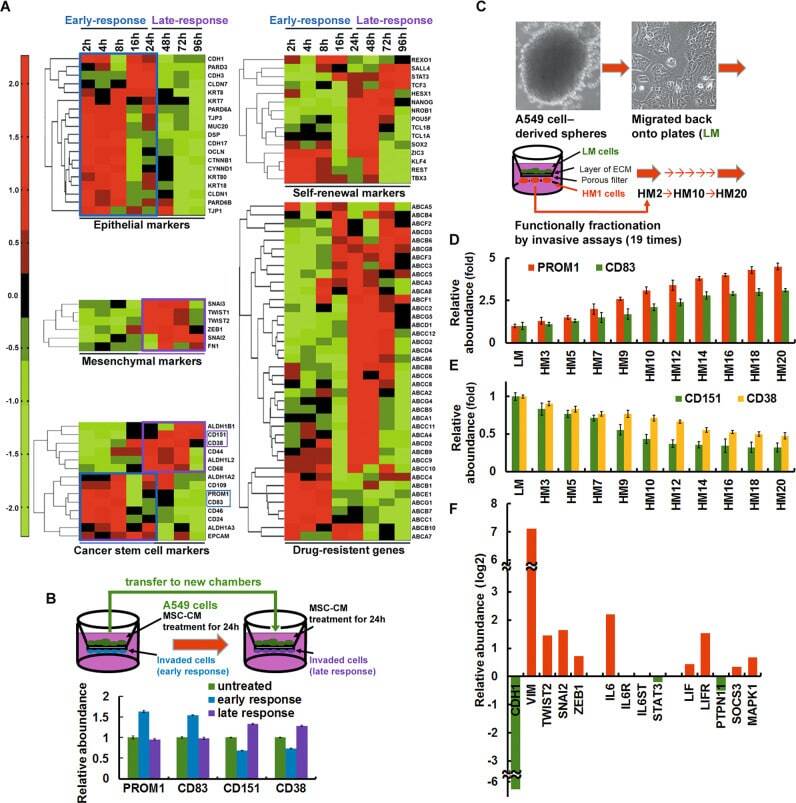
- Fig. 1 Identification of a gene expression signature linked to early dissemination. A Microarray time-series data analysis was performed on cells after treatment with BM-MSC-CM at 9 time points, from 0 to 96 h. Representative clusters of the indicated genes are shown as heatmaps, with red indicating increased expression and green indicating decreased expression, as indicated by the color intensity scale shown below each heatmap. B Functional fractionation of A549 cells via invasion assays. The percentage of cells expressing surface markers was determined by flow cytometry (CD133 + /CD83 + for early-response cells; CD151 + /CD38 + for late-response cells). C - E Functional fractionation of cancer cells via serial invasion assays. Cells were serially selected through 5 (HM5), 10 (HM10), or 20 (HM20) Matrigel invasion assays. The percentage of cells expressing surface markers was determined by QPCR (CD133 + /CD83 + in D ; CD151 + /CD38 + in E ). F QPCR showing the mRNA expression levels of STAT3 signaling-related genes. HM20 cells are compared to LM cells.
- Submitted by
- Invitrogen Antibodies (provider)
- Main image
- Experimental details
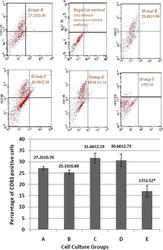
- Figure 3 Effect of E. purpurea on CD83 expression in various cell cultures. (A): Flow cytometry showing the expression of CD83. Monocyte-derived DCs were generated in presence or absence of E. purpurea . (Group A) control group; (Group B) E. purpurea (500 mug/ml) on day 7; (Group C) TNF-alpha (10 ng/ml) on day 7 + E. purpurea (500 mug/ml) on day 8; (Group D) E. purpurea (500 mug/ml) on day 7 + TNF-alpha (10 ng/ml) on day 8; (Group E) E. purpurea (500 mug/ml) on day 0 + TNF-alpha (10 ng/ml) on day 7. (B): Percentage of DCs expressing CD83 in different groups. Expression of CD83 cell marker is measured by BD FACSCalibur(r). Each value is the mean of 3 experiments +- SE. * P < 0.05.

- Submitted by
- Invitrogen Antibodies (provider)
- Main image
- Experimental details
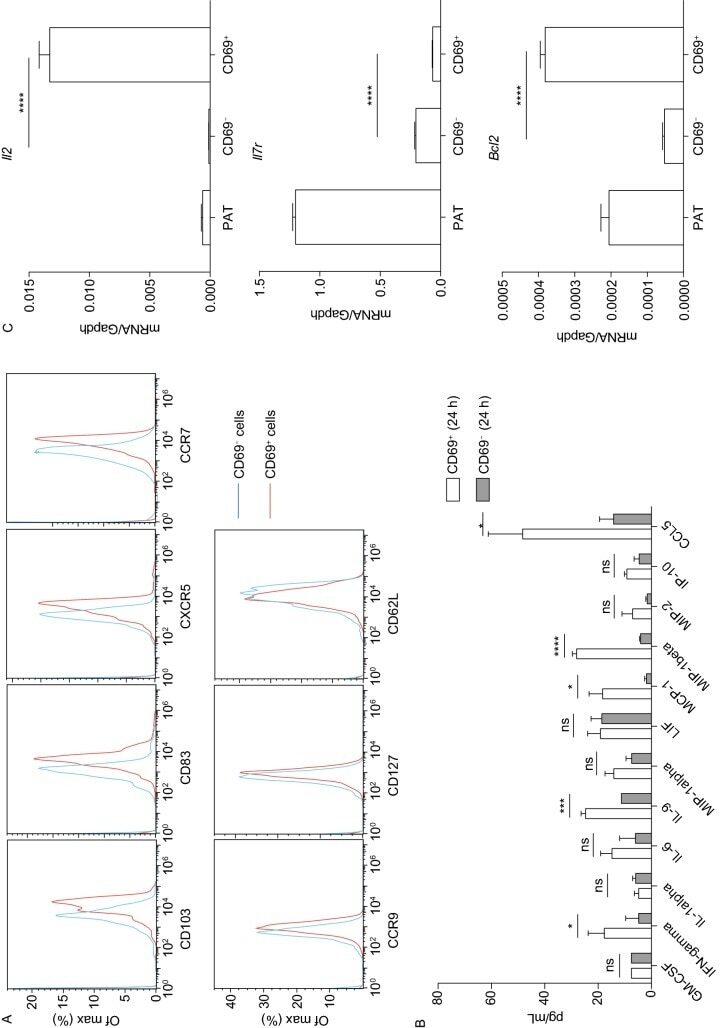
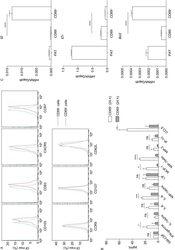
- Figure 2 PA T encounter with DCs results in limited activation involving upregulation of Il2 and Bcl2 . (A) PA T cells were co-cultured with DC1940 for 24 h, then CD4 + populations were gated into CD69 + and CD69 - cells by FACS. The expression of CD103, CXCR5, CD62L, CCR9, CCR7, CD127 and CD83 between CD69 + and CD69 - cells were compared. Three replicates in each group ( n = 3), and results are representative of three independent experiments ( N = 3). (B) CD69 + and CD69 - cells cultured in complete RPMI for 24 h without additional treatment, then the cytokines released to the supernatant were measured by ELISA. Pooled data from three independent experiments are shown. (C) Gene expression of Il7r , Il2 and Bcl2 was determined by QPCR in PA T cells or in CD69 positive or negative populations purified by FACS sorting. Three replicates in each group ( n = 3), and results are representative of three independent experiments ( N = 3). GAPDH was used for normalization