Explore
 Validate
 Learn
Learn Flow cytometry
Antibody data
- Antibody Data
- Antigen structure
- References [1]
- Comments [0]
- Validations
- Flow cytometry [1]
- Other assay [1]
Submit
Validation data
Reference
Comment
Report error
- Product number
- 62-0839-42 - Provider product page

- Provider
- Invitrogen Antibodies
- Product name
- CD83 Monoclonal Antibody (HB15e), Super Bright™ 436, eBioscience™
- Antibody type
- Monoclonal
- Antigen
- Other
- Description
- Description: The HB15e monoclonal antibody reacts with human CD83, a 45 kDa transmembrane glycoprotein. CD83, a member of the Ig superfamily, is expressed on cultured dendritic cells, interdigitating, follicular, and circulating dendritic cells as well as some proliferating lymphocytes, and human cell lines express this antigen. While the function of CD83 is unclear, it can serve as a useful marker for mature human blood dendritic cells.
- Antibody clone number
- HB15e
- Concentration
- 5 µL/Test
Submitted references STAT3 phosphorylation at Ser727 and Tyr705 differentially regulates the EMT-MET switch and cancer metastasis.
Lin WH, Chang YW, Hong MX, Hsu TC, Lee KC, Lin C, Lee JL
Oncogene 2021 Jan;40(4):791-805
Oncogene 2021 Jan;40(4):791-805
No comments: Submit comment
Supportive validation
- Submitted by
- Invitrogen Antibodies (provider)
- Main image
- Experimental details
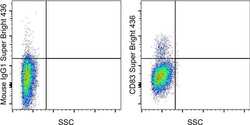
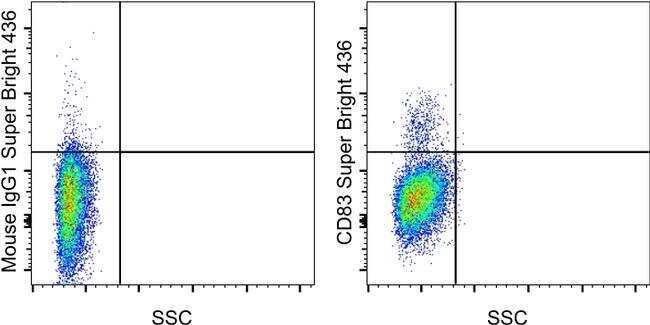
- Staining of 1-day PHA-stimulated normal human peripheral blood cells with Mouse IgG1 K Isotype Control Super Bright 436 (Product # 62-4714-82) (left) or Anti-Human CD83 Super Bright 436 (right). Total viable cells were used for analysis.
Supportive validation
- Submitted by
- Invitrogen Antibodies (provider)
- Main image
- Experimental details
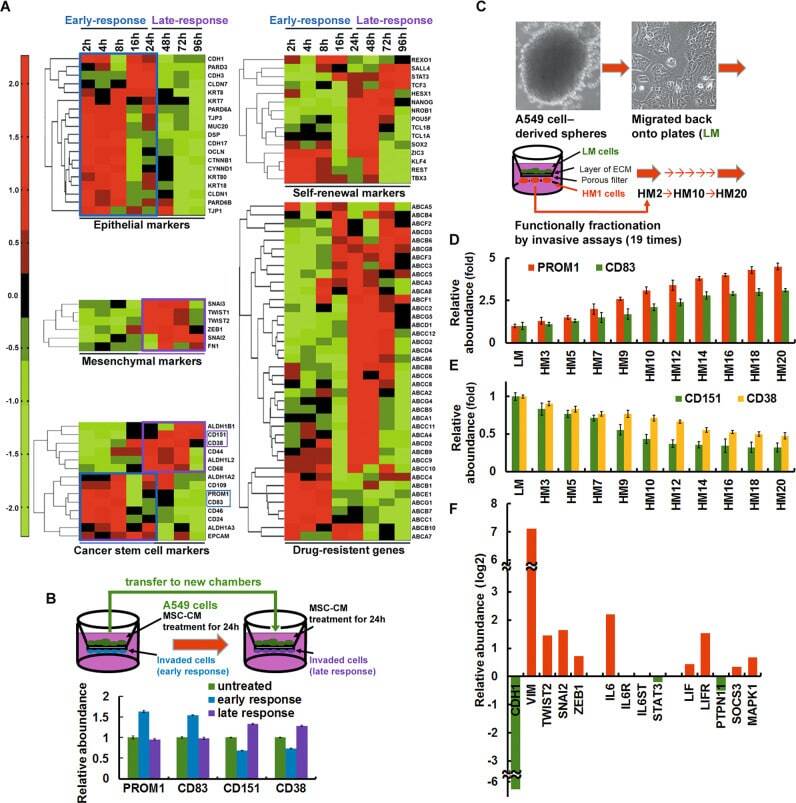
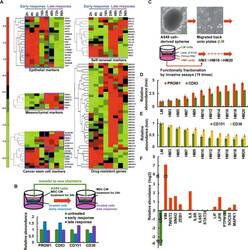
- Fig. 1 Identification of a gene expression signature linked to early dissemination. A Microarray time-series data analysis was performed on cells after treatment with BM-MSC-CM at 9 time points, from 0 to 96 h. Representative clusters of the indicated genes are shown as heatmaps, with red indicating increased expression and green indicating decreased expression, as indicated by the color intensity scale shown below each heatmap. B Functional fractionation of A549 cells via invasion assays. The percentage of cells expressing surface markers was determined by flow cytometry (CD133 + /CD83 + for early-response cells; CD151 + /CD38 + for late-response cells). C - E Functional fractionation of cancer cells via serial invasion assays. Cells were serially selected through 5 (HM5), 10 (HM10), or 20 (HM20) Matrigel invasion assays. The percentage of cells expressing surface markers was determined by QPCR (CD133 + /CD83 + in D ; CD151 + /CD38 + in E ). F QPCR showing the mRNA expression levels of STAT3 signaling-related genes. HM20 cells are compared to LM cells.