Explore
 Validate
 Learn
Learn Western blot
 ELISA
ELISA Immunohistochemistry
Antibody data
- Antibody Data
- Antigen structure
- References [5]
- Comments [0]
- Validations
- Immunohistochemistry [2]
- Flow cytometry [2]
- Other assay [3]
Submit
Validation data
Reference
Comment
Report error
- Product number
- MA5-17171 - Provider product page

- Provider
- Invitrogen Antibodies
- Product name
- PAI1 Monoclonal Antibody (1D5)
- Antibody type
- Monoclonal
- Antigen
- Purifed from natural sources
- Description
- MA5-17171 targets SERPINE1 in FACS, IHC, indirect ELISA, and WB applications and shows reactivity with Human samples. The MA5-17171 immunogen is purified recombinant fragment of human SERPINE1 expressed in E. Coli. MA5-17171 detects SERPINE1 which has a predicted molecular weight of approximately 45kDa.
- Reactivity
- Human, Mouse
- Host
- Mouse
- Isotype
- IgG
- Antibody clone number
- 1D5
- Vial size
- 100 μg
- Concentration
- 1 mg/mL
- Storage
- Store at 4°C short term. For long term storage, store at -20°C, avoiding freeze/thaw cycles.
Submitted references Fat-1 Transgenic Mice With Augmented n3-Polyunsaturated Fatty Acids Are Protected From Liver Injury Caused by Acute-On-Chronic Ethanol Administration.
MAPKAP Kinase-2 Drives Expression of Angiogenic Factors by Tumor-Associated Macrophages in a Model of Inflammation-Induced Colon Cancer.
Various stress stimuli rewire the profile of liver secretome in a p53-dependent manner.
Endogenous transcripts control miRNA levels and activity in mammalian cells by target-directed miRNA degradation.
Association of autotaxin and lysophosphatidic acid receptor 3 with aggressiveness of human breast carcinoma.
Warner J, Hardesty J, Song Y, Sun R, Deng Z, Xu R, Yin X, Zhang X, McClain C, Warner D, Kirpich I
Frontiers in pharmacology 2021;12:711590
Frontiers in pharmacology 2021;12:711590
MAPKAP Kinase-2 Drives Expression of Angiogenic Factors by Tumor-Associated Macrophages in a Model of Inflammation-Induced Colon Cancer.
Suarez-Lopez L, Kong YW, Sriram G, Patterson JC, Rosenberg S, Morandell S, Haigis KM, Yaffe MB
Frontiers in immunology 2020;11:607891
Frontiers in immunology 2020;11:607891
Various stress stimuli rewire the profile of liver secretome in a p53-dependent manner.
Charni-Natan M, Solomon H, Molchadsky A, Jacob-Berger A, Goldfinger N, Rotter V
Cell death & disease 2018 May 29;9(6):647
Cell death & disease 2018 May 29;9(6):647
Endogenous transcripts control miRNA levels and activity in mammalian cells by target-directed miRNA degradation.
Ghini F, Rubolino C, Climent M, Simeone I, Marzi MJ, Nicassio F
Nature communications 2018 Aug 7;9(1):3119
Nature communications 2018 Aug 7;9(1):3119
Association of autotaxin and lysophosphatidic acid receptor 3 with aggressiveness of human breast carcinoma.
Popnikolov NK, Dalwadi BH, Thomas JD, Johannes GJ, Imagawa WT
Tumour biology : the journal of the International Society for Oncodevelopmental Biology and Medicine 2012 Dec;33(6):2237-43
Tumour biology : the journal of the International Society for Oncodevelopmental Biology and Medicine 2012 Dec;33(6):2237-43
No comments: Submit comment
Supportive validation
- Submitted by
- Invitrogen Antibodies (provider)
- Main image
- Experimental details
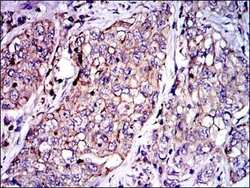
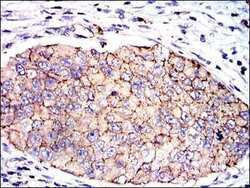
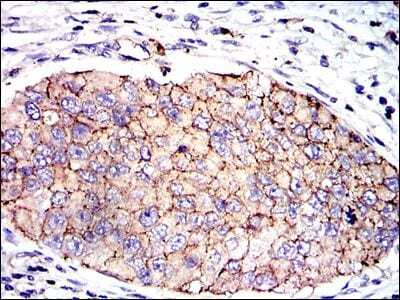
- Immunohistochemical analysis of paraffin-embedded lung cancer tissues using SERPINE1 monoclonal antibody (Product # MA5-17171) followed with DAB staining.
- Submitted by
- Invitrogen Antibodies (provider)
- Main image
- Experimental details
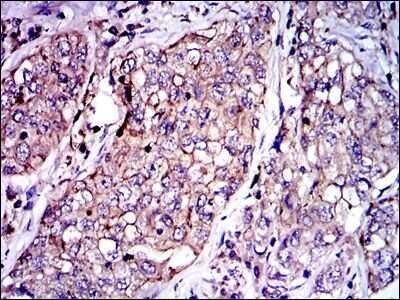
- Immunohistochemical analysis of paraffin-embedded kidney cancer tissues using SERPINE1 monoclonal antibody (Product # MA5-17171) followed with DAB staining.
Supportive validation
- Submitted by
- Invitrogen Antibodies (provider)
- Main image

- Experimental details
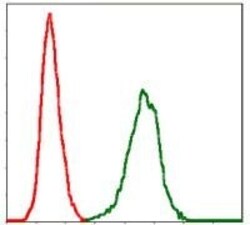
- Flow cytometric analysis of NIH/3T3 cells using SERPINE1 monoclonal antibody (Product # MA5-17171) (green) and negative control (red).

- Submitted by
- Invitrogen Antibodies (provider)
- Main image
- Experimental details
- Flow cytometric analysis of NIH/3T3 cells using SERPINE1 monoclonal antibody (Product # MA5-17171) (green) and negative control (red).

Supportive validation
- Submitted by
- Invitrogen Antibodies (provider)
- Main image
- Experimental details
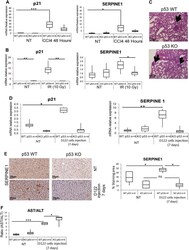
- Fig. 3 Mice bearing lung tumors exhibit elevated expression levels of p53 target genes in their livers. a WTp53 and p53 KO mice were intraperitoneally injected with CCl 4 or with sterile corn oil as a control (NT). After 48 h, mice livers were extracted, total RNA was isolated from the livers, and mRNA levels of p21 and SERPINE1 were measured by qRT-PCR. The analyzed mRNA levels are represented in box plot. Average (horizontal line), standard deviation (box), and highest and lowest reads (error bars) are shown. Unpaired t -test, * P < 0.05, *** P < 0.001. WTp53 NT n = 8 mice, p53 KO NT n = 5 mice, WTp53 treated n = 8 mice, p53 KO treated n = 4 mice). b WTp53 and p53 KO mice were irradiated (IR, 10 Gy) or left non-treated as a control (NT). After 24 h, mice livers were extracted, total RNA was isolated from mice livers, and mRNA levels of p21 and SERPINE1 were measured by qRT-PCR. The analyzed mRNA levels are represented in box plot. Average (horizontal line), standard deviation (box), and highest and lowest reads (error bars) are shown. (Unpaired t -test, * P < 0.05, ** P < 0.01. WTp53 NT n = 8 mice, p53 KO NT n = 5 mice, WTp53 treated n = 4 mice, p53 KO treated n = 6 mice). c - f WTp53 and p53 KO mice were intravenously injected with D122 cancer cells (10 6 cells) or with PBS alone as a control (NT). After 7 days, lung tumors were generated and mice were sacrificed. n = 4 mice. c Representative lung histological sections stained by H&E of D122 cell-derived tumors. Arrows ind

- Submitted by
- Invitrogen Antibodies (provider)
- Main image
- Experimental details
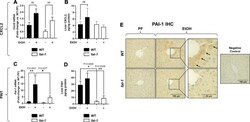
- FIGURE 4 Hepatic Expression of Cxcl2 and Pai-1. (A) Expression of Cxcl2 mRNA and (B) CXCL2 protein in liver. (C) Expression of Pai-1 mRNA and (D) PAI-1 protein in liver. (E) Liver immunohistochemistry for PAI-1 protein, 400X magnification. Arrows indicate PAI-1+ hepatocytes. *, p < 0.05, ** p < 0.01, one-way ANOVA (comparisons not significant if unlabeled). WT PF ( n = 14), fat-1 PF ( n = 9), WT EtOH ( n = 8), fat-1 EtOH ( n = 10).

- Submitted by
- Invitrogen Antibodies (provider)
- Main image
- Experimental details
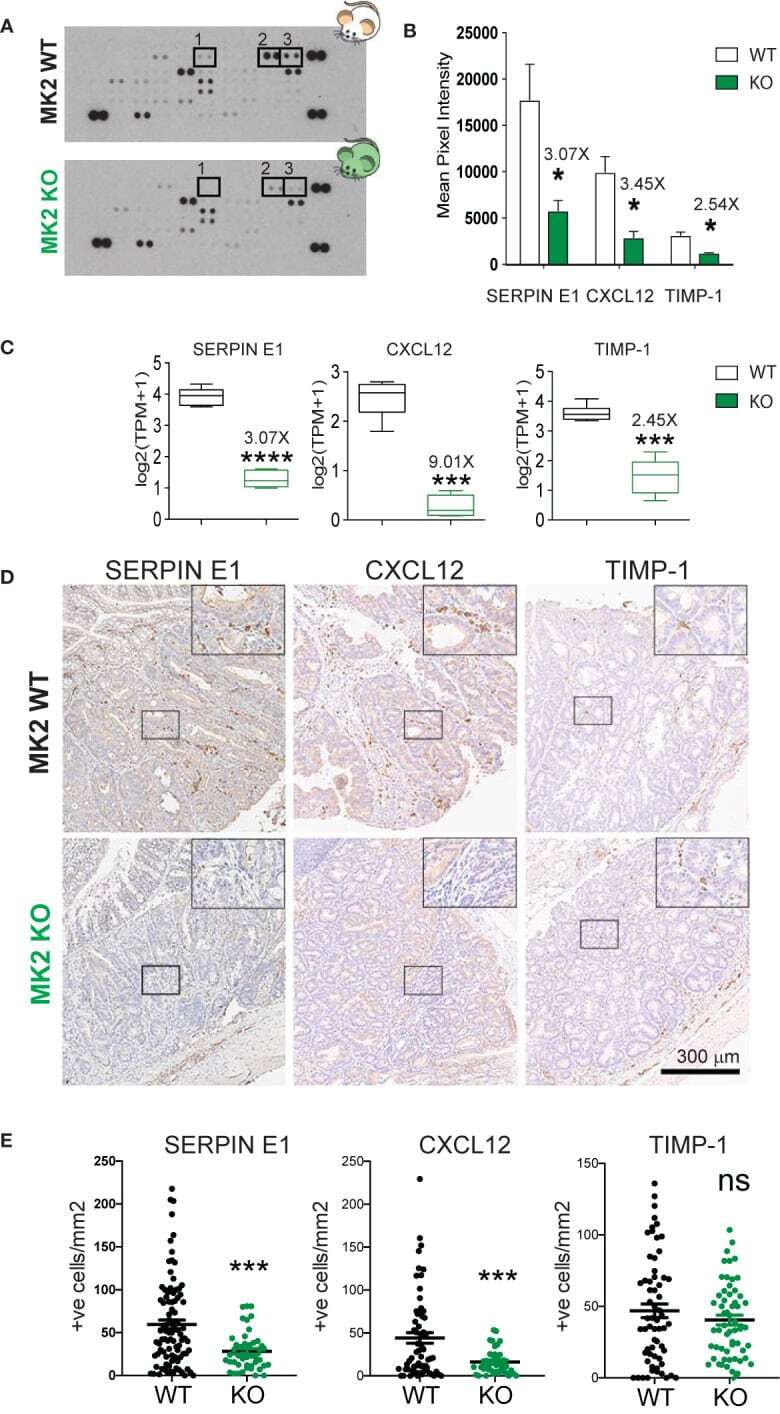
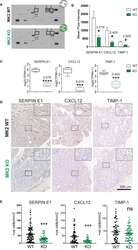
- Figure 2 MK2 deficiency halts the production and secretion of pro-angiogenic factors. (A) Representative images of Mouse Angiogenesis Protein Array (R&D) membranes. Squares highlight the spots corresponding to Timp-1 (1), Serpin-E1 (2) and Cxcl-12 (3). (B) Protein quantification of Timp-1, Serpin-E1, and Cxcl-12 in macrophage culture supernatants from M2-polarized MK2-WT or KO macrophages. Spot intensity was quantified in ImageJ. Data corresponds to three membranes per genotype, where culture supernatants from three independent biological replicates were tested. (C) RNA quantification of Timp-1, Serpin-E1, and Cxcl-12 from M2-polarized MK2-WT or KO macrophages from the experiments shown Figure 1 . Box and whisker plots display median (line), 25 th to 75 th percentiles (boxes) and min and maximum (whiskers) RNA expression levels from 6 biological replicates each of MK2-WT and KO macrophages. (D) Representative pictures of angiogenic factors detected by immunohistochemistry in MK2 WT (upper panel, 10 mice) and MK2 KO (lower panel, 5 mice) colon tumors. (E) Stained slides from serial sections of Swiss-rolled entire colons were scanned and quantified in an automated manner using the positive nuclei algorithm in ImageScope and normalized by area analyzed in mm 2 . Each data point corresponds to a single tumor area, and all tumors from all mice with the same genotype [MK2 WT (10 mice) and MK2 KO (5 mice)] are shown. Scale bar 300 um. In panels (B, C, E) statistical significance was