 Explore
 Validate
 Learn
Learn Western blot
 ELISA
ELISAAntibody data
- Antibody Data
- Antigen structure
- References [3]
- Comments [0]
- Validations
- Western blot [1]
- Immunocytochemistry [1]
- Immunohistochemistry [1]
- Flow cytometry [2]
- Other assay [1]
Submit
Validation data
Reference
Comment
Report error
- Product number
- MA5-15609 - Provider product page

- Provider
- Invitrogen Antibodies
- Product name
- ETS1 Monoclonal Antibody (8A8)
- Antibody type
- Monoclonal
- Antigen
- Purifed from natural sources
- Description
- MA5-15609 targets ETS1 in indirect ELISA, FACS, IF, IHC, and WB applications and shows reactivity with Human samples. The MA5-15609 immunogen is purified recombinant fragment of human ETS1 expressed in E. Coli.. MA5-15609 detects ETS1 which has a predicted molecular weight of approximately 50.4kDa.
- Reactivity
- Human
- Host
- Mouse
- Isotype
- IgG
- Antibody clone number
- 8A8
- Vial size
- 100 μL
- Concentration
- Conc. Not Determined
- Storage
- Store at 4°C short term. For long term storage, store at -20°C, avoiding freeze/thaw cycles.
Submitted references iPSC-derived cranial neural crest-like cells can replicate dental pulp tissue with the aid of angiogenic hydrogel.
Cooperative Enhancer Activation by TLX1 and STAT5 Drives Development of NUP214-ABL1/TLX1-Positive T Cell Acute Lymphoblastic Leukemia.
Priming of transcriptional memory responses via the chromatin accessibility landscape in T cells.
Kobayashi Y, Nouet J, Baljinnyam E, Siddiqui Z, Fine DH, Fraidenraich D, Kumar VA, Shimizu E
Bioactive materials 2022 Aug;14:290-301
Bioactive materials 2022 Aug;14:290-301
Cooperative Enhancer Activation by TLX1 and STAT5 Drives Development of NUP214-ABL1/TLX1-Positive T Cell Acute Lymphoblastic Leukemia.
Vanden Bempt M, Demeyer S, Broux M, De Bie J, Bornschein S, Mentens N, Vandepoel R, Geerdens E, Radaelli E, Bornhauser BC, Kulozik AE, Meijerink JP, Bourquin JP, de Bock CE, Cools J
Cancer cell 2018 Aug 13;34(2):271-285.e7
Cancer cell 2018 Aug 13;34(2):271-285.e7
Priming of transcriptional memory responses via the chromatin accessibility landscape in T cells.
Tu WJ, Hardy K, Sutton CR, McCuaig R, Li J, Dunn J, Tan A, Brezar V, Morris M, Denyer G, Lee SK, Turner SJ, Seddiki N, Smith C, Khanna R, Rao S
Scientific reports 2017 Mar 20;7:44825
Scientific reports 2017 Mar 20;7:44825
No comments: Submit comment
Supportive validation
- Submitted by
- Invitrogen Antibodies (provider)
- Main image

- Experimental details
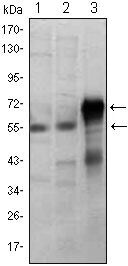
- Western blot analysis of ETS1 using ETS1 monoclonal antibody (Product # MA5-15609) in Jurkat (1), HepG2 (2) and ETS1-human IgG Fc transfected HEK293 (3) cell lysate.
Supportive validation
- Submitted by
- Invitrogen Antibodies (provider)
- Main image

- Experimental details
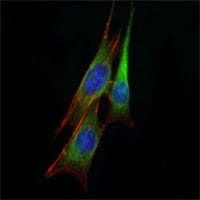
- Immunofluorescence analysis of NIH/3T3 cells using ETS1 monoclonal antibody (Product # MA5-15609) (Green). Blue: DRAQ5 fluorescent DNA dye.
Supportive validation
- Submitted by
- Invitrogen Antibodies (provider)
- Main image
- Experimental details
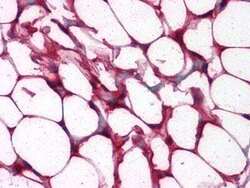
- Immunohistochemical analysis of paraffin-embedded human colon, adipocytes tissues using ETS1 monoclonal antibody (Product # MA5-15609).

Supportive validation
- Submitted by
- Invitrogen Antibodies (provider)
- Main image

- Experimental details
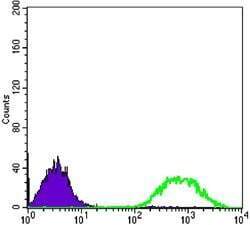
- Flow cytometric analysis of Jurkat cells using ETS1 monoclonal antibody (Product # MA5-15609) (green) and negative control (purple).

- Submitted by
- Invitrogen Antibodies (provider)
- Main image
- Experimental details
- Flow cytometric analysis of Jurkat cells using ETS1 monoclonal antibody (Product # MA5-15609) (green) and negative control (purple).

Supportive validation
- Submitted by
- Invitrogen Antibodies (provider)
- Main image
- Experimental details
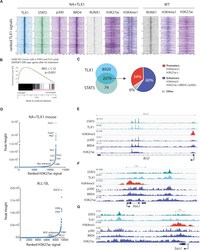
- Figure 3 STAT5 and TLX1 Co-bind Regulatory Regions throughout the Genome (A) Centered read density heatmaps of ChIPmentation ChIP-seq signals for the binding of TLX1, STAT5, p300, BRD4, ETS1, RUNX1, and the histone marks H3K27ac and H3K4me1. Heatmaps centered and ranked on TLX1 signal strength in leukemic NA + TLX1 and WT mouse cells. (B) GSEA comparing genes bound by both STAT5 and TLX1 and differentially expressed genes after treatment with imatinib in ALL-SIL cells. (C) Venn diagram showing the total amount of TLX1 and STAT5 peaks that fall within the 90,804 H3K27ac peaks for NA + TLX1 leukemic cells (left). Pie chart (right) showing ChIP-seq peak co-occurrence of STAT5 and TLX1 in mouse NA + TLX1 leukemic cells in relation to promoter regions (H3K4me3 + /H3K27ac + ) and enhancer regions (H3K27ac + /BRD4 + /p300 + /H3K4me3 - ). (D) Enhancer regions ranked on H3K27ac signal for NA + TLX1 leukemic cells and ALL-SIL. Only H3K27ac clusters with overlapping TLX1 peaks are shown. Gene labels are distance-based if not intragenic. (E-G) Representative ChIP-seq tracks for canonical STAT5 target genes Bcl2 (E), Pim1 (F), and Socs1 (G) showing STAT5, TLX1, H3K4me3, p300, BRD4, and H3K27ac binding in NA + TLX1 leukemic mouse cells.
