Explore
 Validate
 Learn
Learn14-6715-63
antibody from Invitrogen Antibodies
Targeting: CDKN1A
CAP20, CDKN1, CIP1, P21, p21CIP1, p21Cip1/Waf1, SDI1, WAF1
 Western blot
 Immunoprecipitation
Antibody data
- Antibody Data
- Antigen structure
- References [7]
- Comments [0]
- Validations
- Western blot [1]
- Immunocytochemistry [1]
- Other assay [11]
Submit
Validation data
Reference
Comment
Report error
- Product number
- 14-6715-63 - Provider product page

- Provider
- Invitrogen Antibodies
- Product name
- p21 (WAF1, Cip1) Polyclonal Antibody, eBioscience™
- Antibody type
- Polyclonal
- Antigen
- Other
- Description
- Description: The polyclonal antibody reacts with mouse, rat, and human p21; the antibody was raised against a peptide mapping to the carboxy terminus of human p21. The progression through the cell cycle is regulated by cyclins and their cognate Cdks by promoting cell cycle transitions (1,2,3). This orderly progression can be inhibited by a family of proteins known as CDK inhibitors (CDIs) that bind to cyclin/Cdk complexes and halt cell division (3). p21 (also designated WAF1/Cip1) is one has been shown to inhibit the activity of each member of the cyclin/Cdk family and over expression of this protein inhibits the proliferation of mammalian cells (5). The expression of p21 is inducible by a wide range of stress stimuli and its transcription can be enhanced by p53 (6). Another member of the CDIs is p27 (also known as Kip1), which also sees up regulation in response to antimitogenic stimuli (7). The increased protein expression of p27 results in cellular arrest by binding to cyclin/Cdk complexes, like cyclin D1/Cdk4 (4,8). An additional CDI has been found to bind Cdk4 and Cdk6, p16 (INK4A), and when such complexes are formed, the progression of the cell cycle is halted (9). It has become increasingly clear that p16 is a very important tumor suppressor gene whose frequent loss occurs early in many human cancers. p16 is a major target in carcinogenesis that is rivaled in frequency only by p53 (10). Applications Reported: Purified anti-mo/hu/rat p21 (WAF1/Cip1) poly has been reported for use in immunoprecipitation, immunoblotting (WB), and immunohistochemical staining. Applications Tested: Purified anti-mo/hu/rat p21 (WAF1/Cip1) poly has been tested by immunoblotting (WB) (1:200 starting dilution). Purity: Greater than 90%, as determined by SDS-PAGE. Aggregation: Less than 10%, as determined by HPLC. Filtration: 0.2 µm post-manufacturing filtered.
- Reactivity
- Human, Mouse, Rat
- Host
- Rabbit
- Isotype
- IgG
- Vial size
- 10 µg
- Concentration
- 0.2 mg/mL
- Storage
- 4° C
Submitted references Sympathetic Denervation Ameliorates Renal Fibrosis via Inhibition of Cellular Senescence.
Bisphenol A Induces Accelerated Cell Aging in Murine Endothelium.
Upregulation of Chemoresistance by Mg(2+) Deficiency through Elevation of ATP Binding Cassette Subfamily B Member 1 Expression in Human Lung Adenocarcinoma A549 Cells.
Indispensable role of Galectin-3 in promoting quiescence of hematopoietic stem cells.
CRISPR/Cas9 treatment causes extended TP53-dependent cell cycle arrest in human cells.
Delayed effects of acute whole body lethal radiation exposure in mice pre-treated with BBT-059.
An antioxidant extract of tropical lichen, Parmotrema reticulatum, induces cell cycle arrest and apoptosis in breast carcinoma cell line MCF-7.
Li Q, Deng Y, Liu L, Zhang C, Cai Y, Zhang T, Han M, Xu G
Frontiers in immunology 2021;12:823935
Frontiers in immunology 2021;12:823935
Bisphenol A Induces Accelerated Cell Aging in Murine Endothelium.
Moreno-Gómez-Toledano R, Sánchez-Esteban S, Cook A, Mínguez-Moratinos M, Ramírez-Carracedo R, Reventún P, Delgado-Marín M, Bosch RJ, Saura M
Biomolecules 2021 Sep 29;11(10)
Biomolecules 2021 Sep 29;11(10)
Upregulation of Chemoresistance by Mg(2+) Deficiency through Elevation of ATP Binding Cassette Subfamily B Member 1 Expression in Human Lung Adenocarcinoma A549 Cells.
Onuma S, Manabe A, Yoshino Y, Matsunaga T, Asai T, Ikari A
Cells 2021 May 12;10(5)
Cells 2021 May 12;10(5)
Indispensable role of Galectin-3 in promoting quiescence of hematopoietic stem cells.
Jia W, Kong L, Kidoya H, Naito H, Muramatsu F, Hayashi Y, Hsieh HY, Yamakawa D, Hsu DK, Liu FT, Takakura N
Nature communications 2021 Apr 9;12(1):2118
Nature communications 2021 Apr 9;12(1):2118
CRISPR/Cas9 treatment causes extended TP53-dependent cell cycle arrest in human cells.
Geisinger JM, Stearns T
Nucleic acids research 2020 Sep 18;48(16):9067-9081
Nucleic acids research 2020 Sep 18;48(16):9067-9081
Delayed effects of acute whole body lethal radiation exposure in mice pre-treated with BBT-059.
Sharma NK, Holmes-Hampton GP, Kumar VP, Biswas S, Wuddie K, Stone S, Aschenake Z, Wilkins WL, Fam CM, Cox GN, Ghosh SP
Scientific reports 2020 Apr 22;10(1):6825
Scientific reports 2020 Apr 22;10(1):6825
An antioxidant extract of tropical lichen, Parmotrema reticulatum, induces cell cycle arrest and apoptosis in breast carcinoma cell line MCF-7.
Ghate NB, Chaudhuri D, Sarkar R, Sajem AL, Panja S, Rout J, Mandal N
PloS one 2013;8(12):e82293
PloS one 2013;8(12):e82293
No comments: Submit comment
Supportive validation
- Submitted by
- Invitrogen Antibodies (provider)
- Main image

- Experimental details
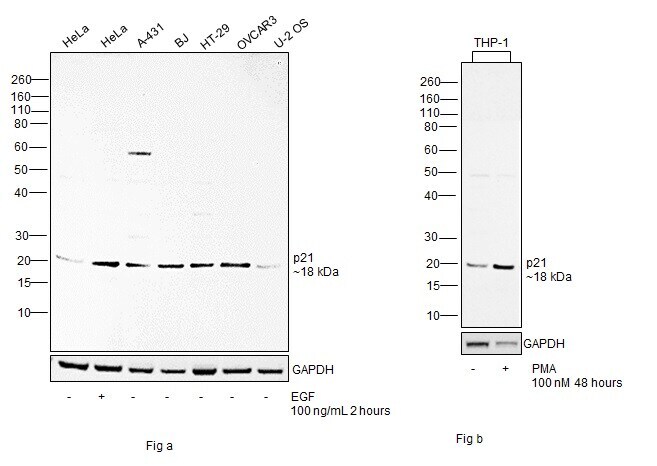
- Western blot was performed using Anti-p21 (WAF1, Cip1) Polyclonal Antibody, eBioscience™ (Product # 14-6715-81) and an 18 kDa band corresponding to Cyclin-dependent kinase inhibitor 1 was observed across cell lines tested. Also an increase in p21 expression upon EGF treatment (100 ng/mL 2 hours) in HeLa cells (Fig a) and PMA treatment (100 nM 48 hours) in THP-1 cells (Fig b) can be observed. Fig a: Whole cell extracts (30 µg lysate) of HeLa (Lane 1), HeLa treated with EGF (Lane 2), A-431 (Lane 3), BJ (Lane 4), HT-29 (Lane 5), OVCAR3 (Lane 6) and U-2 OS (Lane 7) were electrophoresed using NuPAGE™ 12% Bis-Tris Protein Gel (Product # NP0341BOX). Fig b: Whole cell extracts (30 µg lysate) of THP-1 (Lane 1) and THP-1 treated with PMA (Lane 2) were electrophoresed using NuPAGE™ 12% Bis-Tris Protein Gel (Product # NP0341BOX). Resolved proteins (Fig a and b) were then transferred onto a Nitrocellulose membrane (Product # IB23001) by iBlot® 2 Dry Blotting System (Product # IB21001). The blots were probed with the primary antibody (1:200 dilution) and detected by chemiluminescence with Goat anti-Rabbit IgG (H+L) Superclonal™ Recombinant Secondary Antibody, HRP (Product # A27036, 1:4000 dilution) using the iBright FL 1000 (Product # A32752). Chemiluminescent detection was performed using Novex® ECL Chemiluminescent Substrate Reagent Kit (Product # WP20005).
Supportive validation
- Submitted by
- Invitrogen Antibodies (provider)
- Main image

- Experimental details
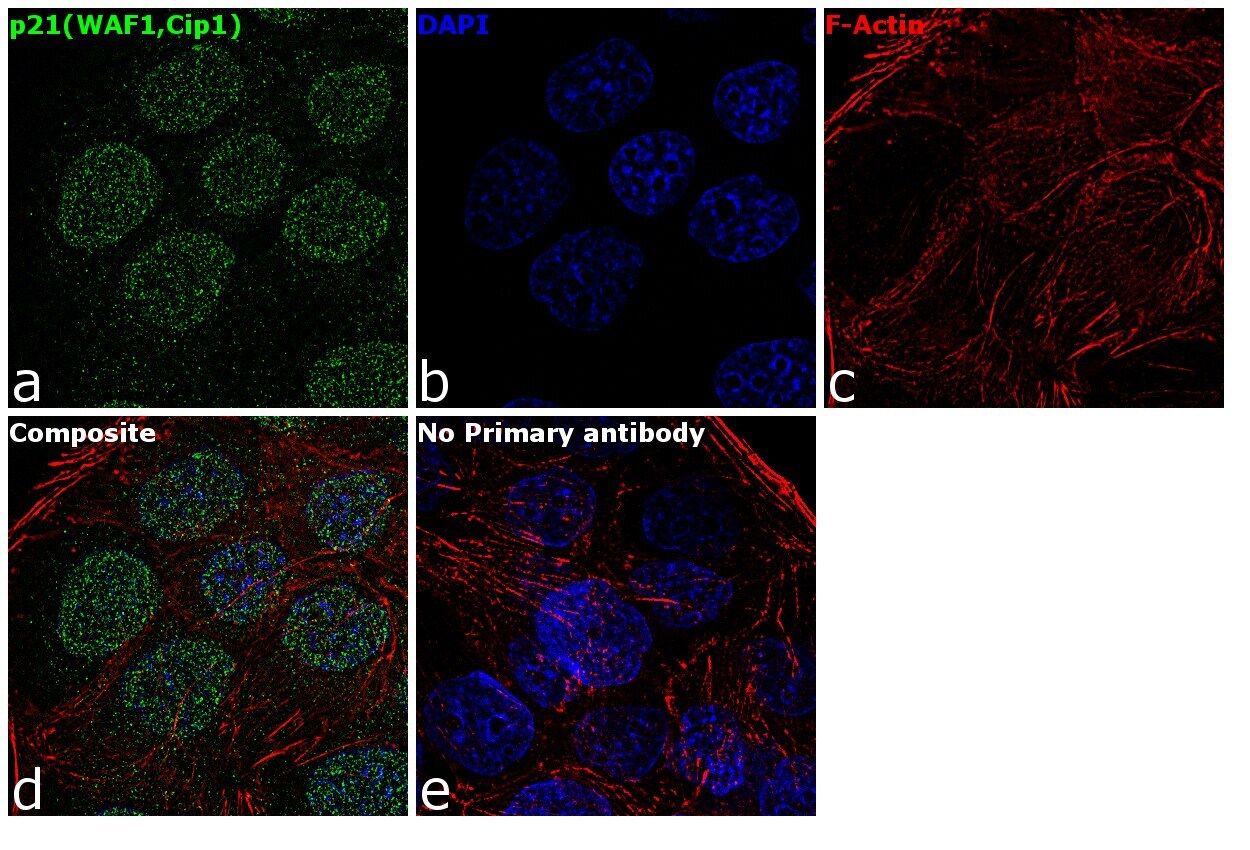
- Immunofluorescence analysis of p21 (WAF1,Cip1) was performed using 70% confluent log phase A-431 cells. The cells were fixed with 4% paraformaldehyde for 10 minutes, permeabilized with 0.1% Triton™ X-100 for 15 minutes, and blocked with 1% BSA for 1 hour at room temperature. The cells were labeled with p21 (WAF1,Cip1) Rabbit Polyclonal Antibody (Product # 14-6715-81) at 5 microgram/mL in 0.1% BSA, incubated at 4 degree Celsius overnight and then labeled with Goat anti-Rabbit IgG (H+L) Superclonal™ Secondary Antibody, Alexa Fluor® 488 conjugate (Product # A27034) at a dilution of 1:2000 for 45 minutes at room temperature (Panel a: green). Nuclei (Panel b: blue) were stained with SlowFade® Gold Antifade Mountant with DAPI (Product # S36938). F-actin (Panel c: red) was stained with Rhodamine Phalloidin (Product # R415, 1:300). Panel d represents the merged image showing Nucleus and cytoplasmic localization. Panel e represents control cells with no primary antibody to assess background. The images were captured at 60X magnification.
Supportive validation
- Submitted by
- Invitrogen Antibodies (provider)
- Main image
- Experimental details
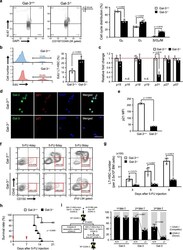
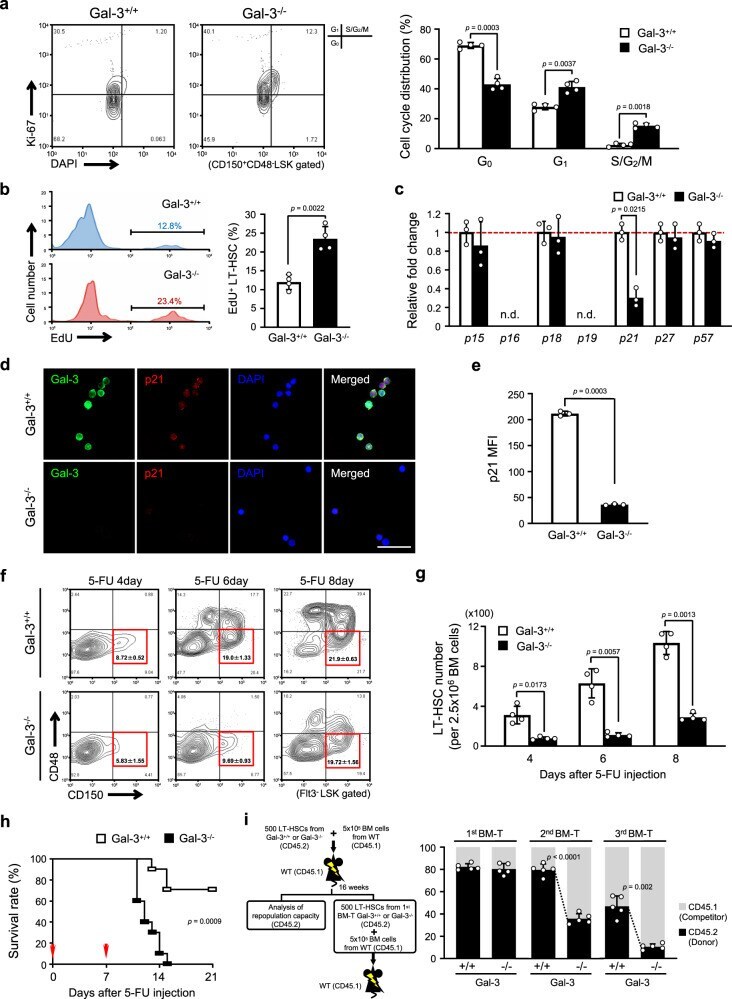
- Fig. 3 Defect in the maintenance of LT-HSC quiescence in Gal-3 -/- mice. a (Left) Representative flow cytometric analysis showing the cell-cycle status of Gal-3 +/+ or Gal-3 -/- LT-HSCs (CD150 + CD48 - LSK) using Ki-67 and DAPI staining. (Right) Bar graph showing the percentage of cells in G 0 , G 1 , and S/G 2 /M phases of the cell cycle ( n = 4 biological replicates per genotype, compared by two-sided t test). Data are presented as mean values +- S.D. b (Left) Representative flow cytometry histograms for frequencies of EdU-positive LT-HSC (CD150 + CD48 - Flt3 - LSK) in the BM of Gal-3 +/+ or Gal-3 -/- mice. (Right) Bar graph showing the percentage of EdU-positive cells ( n = 4 biological replicates per genotype, compared by two-sided t test). Data are presented as mean values +- S.D. c Relative expression level of mRNA for p16 and p21 family members in BM LT-HSCs (CD150 + CD48 - Flt3 - LSK) from Gal-3 +/+ or Gal-3 -/- mice ( n = 3 biological replicates per genotype, compared by two-sided t test). Data are presented as mean values +- S.D. and n.d. not determined. d Representative immunofluorescence images of LT-HSCs (CD150 + CD48 - Flt3 - LSK) labeled by Gal-3 (green) and p21 (red) in BM of Gal-3 +/+ or Gal-3 -/- mice ( n = 3 biological replicates per genotype). DAPI (blue) was used to detect nuclei. Scale bar, 50 mum. e Bar graph showing the mean fluorescence intensity (MFI) of p21 in LT-HSCs (CD150 + CD48 - Flt3 - LSK) in BM of Gal-3 +/+ or Gal-3 -/- mice. The MFI was quan
- Submitted by
- Invitrogen Antibodies (provider)
- Main image

- Experimental details
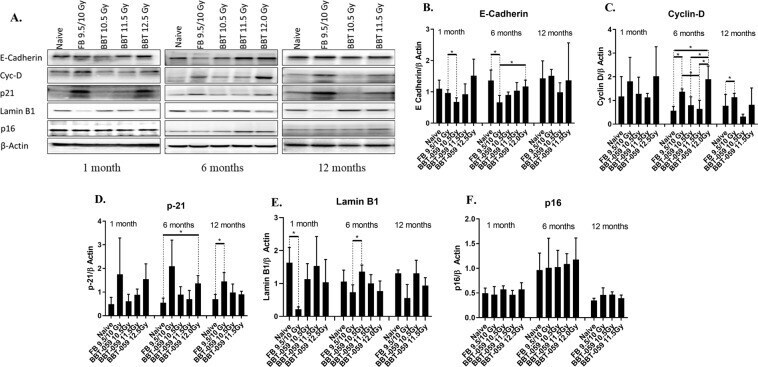
- Figure 8 Western blot analysis: ( A ) Expression of E-cadherin, Cyc D, P21, Lamin B1 and p16 expression spleens collected at 1, 6 and 12 month from all groups B - F ) Quantification from three independent western blots and the bar graph shows the quantification of the ratio of protein of interest and its respective beta-Actin control.
- Submitted by
- Invitrogen Antibodies (provider)
- Main image
- Experimental details
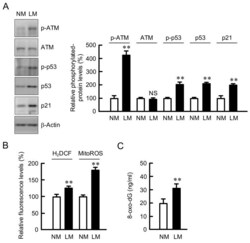
- Figure 2 Effects of LM on cell cycle regulators, ROS production, and oxidative-DNA damage. A549 cells were continuously cultured in the media containing NM or LM. ( A ) Western blotting was performed using anti-p-ATM, anti-ATM, anti-p-p53, anti-p53, anti-p21, and anti-beta-actin antibodies. The expression levels of these proteins were corrected by beta-actin and are represented in percentage to NM. ( B ) The cells were incubated with Hoechst33342 plus H 2 DCFAM or MitoROS for 30 min. The relative fluorescence intensities of H 2 DCF and MitoROS were represented as percentage of NM. ( C ) The content of 8-oxo-dG was examined using DNA damage (8-oxo-dG) ELISA kit and calculated using calibration curve. n = 3-8. ** p < 0.01 compared with NM. NS, p > 0.05.

- Submitted by
- Invitrogen Antibodies (provider)
- Main image
- Experimental details
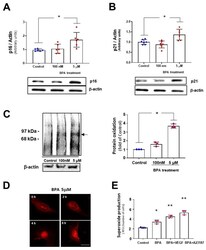
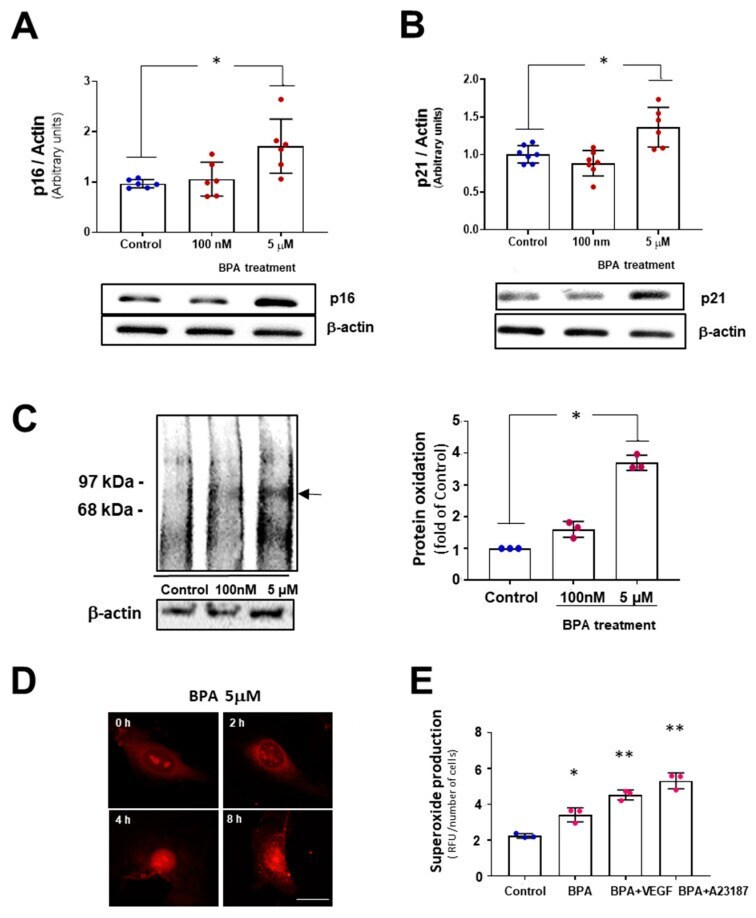
- Figure 2 BPA induces senescent protein markers p21 and p16 and increases oxidative stress. Western blotting analysis of MAEC treated with 100 nM and 5 uM BPA for five days using antibodies against ( A ) p21 and ( B ) p16. beta-actin was used as a loading control. (n = 6). Results are given as mean +- SD, p was determined by a Kruskal-Wallis test for the comparison between control and BPA-treated cells. * p < 0.05 ); ( C ) The levels of reactive oxygen species induced in MAEC by BPA were analyzed by oxyblot assay in 100 nM and 5 uM BPA-treated MAEC for 24 h to detect carbonyl groups in proteins as a marker of protein oxidation. The densities of the proteins between 97 and 68 KDa were normalized using the expression of beta-actin. (n = 3 with duplicate for each condition). * p < 0.001 using Kruskal-Wallis test for the comparison between control and BPA-treated cells; ( D ) Immunofluorescence (IF) of superoxide production in MAEC in response to 5 uM BPA for 0-8 h, using the fluorescence probe dihydroetidium (DHE). After 4 h, fluorescence can be observed at the cell nucleus. Scale bar: 10 um; ( E ) Quantification of superoxide in MAEC upon 5 uM BPA treatment for 24 h, BPA+VEGF and BPA+ A23187 and vehicle (control). (n = 3, per duplicate). Results are given as mean +- SD, p was determined by a Kruskal-Wallis test, * p < 0.001 vs. Control and ** p < 0.001 vs. BPA.
- Submitted by
- Invitrogen Antibodies (provider)
- Main image
- Experimental details
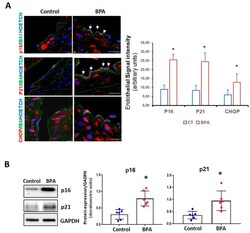
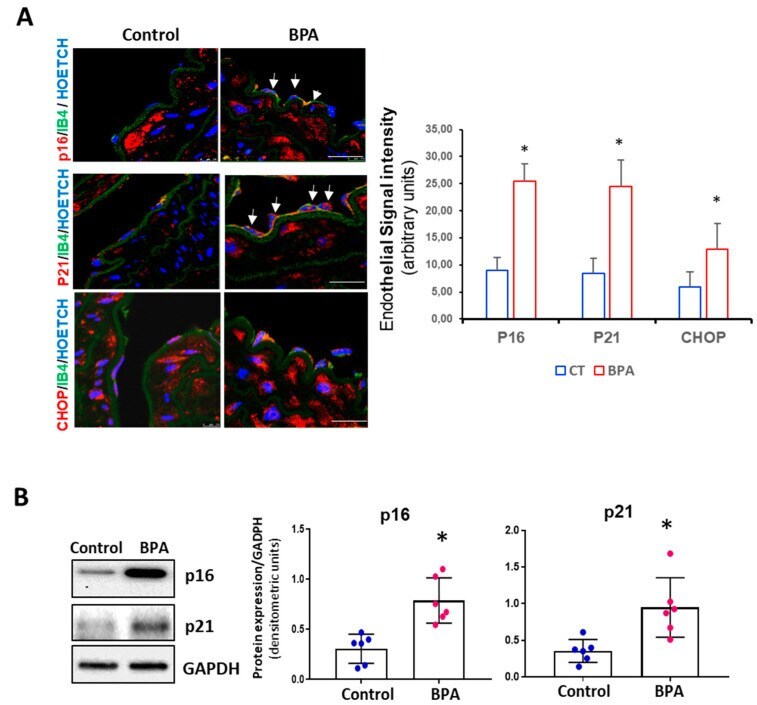
- Figure 4 Senescence proteins (p16 and p21) and CHOP expression in BPA-treated-mice aort. Treatment with BPA in drinking water induced notable increases in expression of both the p16, p21, and CHOP proteins. ( A ) Representative confocal images from aorta sections of control and 8-weeks-treated BPA mice followed by immunostaining for p16 (upper panel), p21 (middle panel), and CHOP (lower panel) (red). Endothelium was marked in green with isolectin B4-FITC. Nuclei were labeled with hoechst in blue (n = 8 mice per condition). Scale bar = 60 uM. ( B ) Immunoblot detection of p16 and p21, in total aorta lysates from CT and 8 weeks BPA-treated mice. GAPDH was used as a loading control. A representative immunoblot is shown. The densitometric analysis is shown below (data are mean +- SD, n = 6 mice per condition) * p < 0.001 vs. CT.
- Submitted by
- Invitrogen Antibodies (provider)
- Main image
- Experimental details
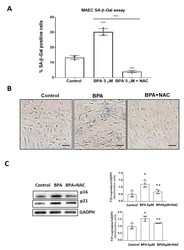
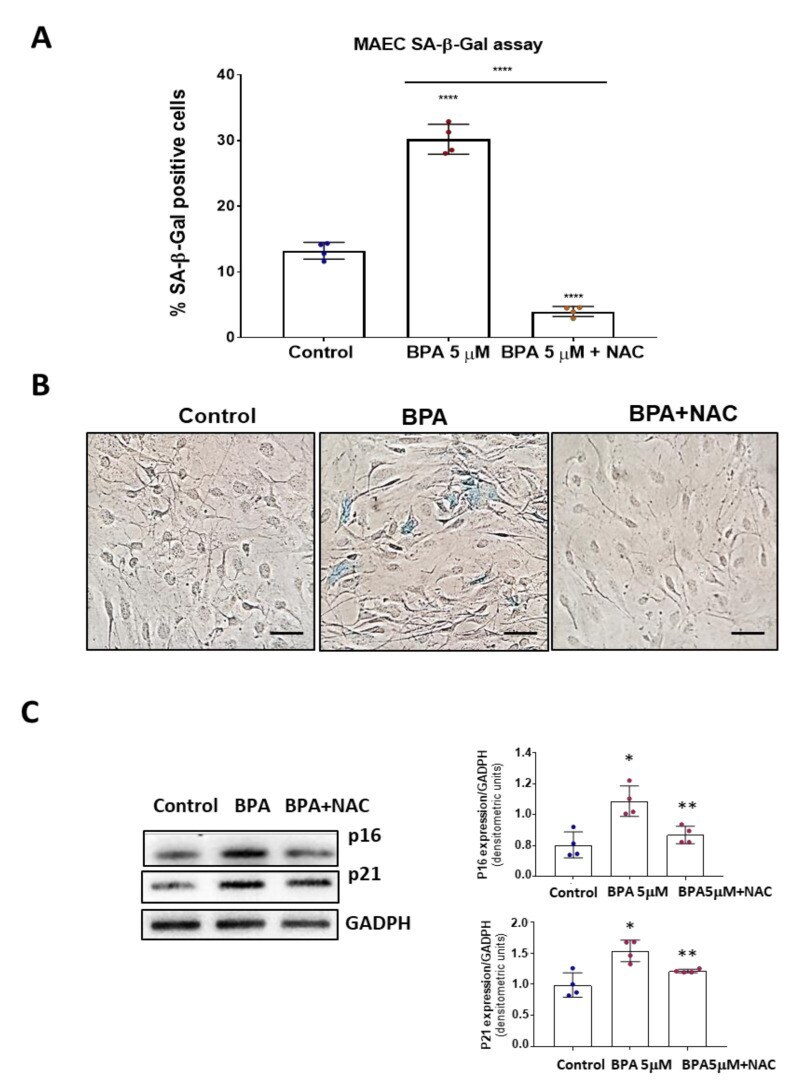
- Figure 5 N-Acetylcistein decreases senescence-associated beta-Gal assay in MAEC treated with BPA 5 days. ( A ) Senescence-associated beta-Gal assay in MAEC treated with BPA 5 days at 5 uM and BPA 5 uM + NAC 5 mM. Note that pretreatment with NAC in BPA-treated cells reduced the percentage of senescent cells even below the control group. Results represented are means +- SD. (n = 4, each performed in triplicate). **** p < 0.0001 using Kruskal-Wallis test. ( B ) Representative microphotographs of the senescence assay made at x40 magnification. ( C ) Western blot analysis of MAEC treated as in A , using antibodies to p21 and p16. Data are the means +- SD of four different experiments, each performed in duplicate. * p < 0.05 using Kruskal-Wallis test for the comparison between control and BPA-treated cells; ** p < 0.001 using Kruskal-Wallis test for the comparison between BPA 5 uM and BPA 5 uM + NAC 5 mM.
- Submitted by
- Invitrogen Antibodies (provider)
- Main image
- Experimental details
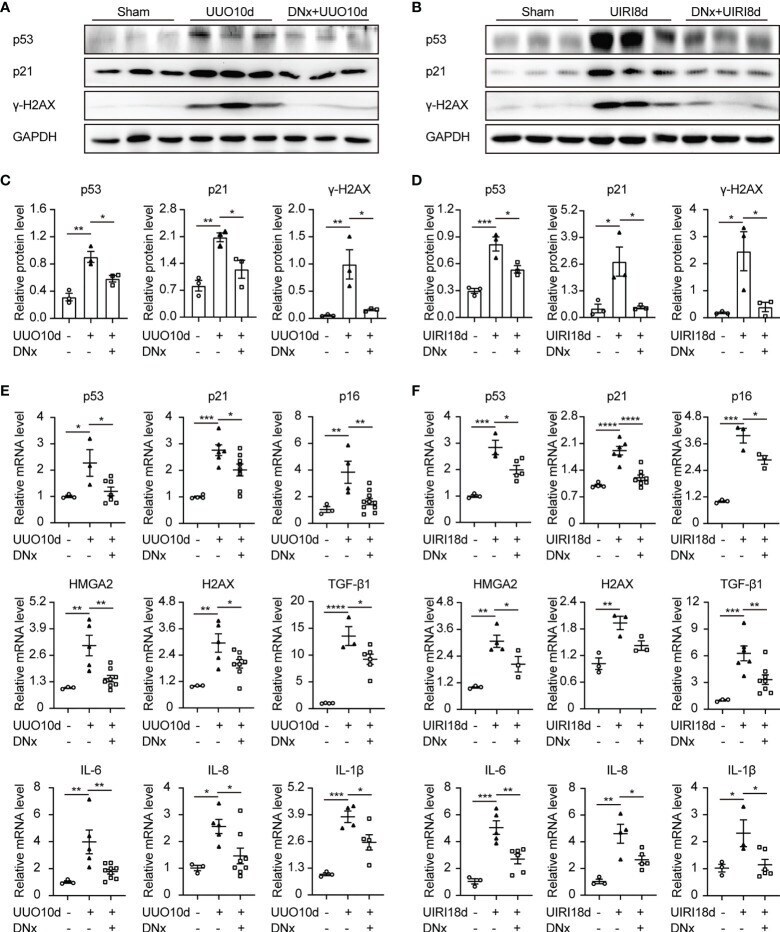
- Figure 2 Renal denervation reduces renal senescence and the expression of proinflammatory cytokines after kidney injury. Renal denervation (DNx) or sham operation was performed 2 days before the UUO or UIRI model in the left kidneys of mice. (A, B) Representative Western blot of senescence-related proteins p53, p21, and gamma-H2AX in sham-operated, UUO/UIRI, and DNx+UUO/UIRI kidneys with densitometry analysis (C, D) . (E, F) mRNA expressions of senescence-related markers p53, p21, p16, HMGA2, H2AX, and senescence-associated secretory phenotype (SASP) TGF-beta1, IL-6, IL-8, and IL-1beta in the kidney tissue of sham-operated, UUO/UIRI mice, and DNx+UUO/UIRI mice as shown by qRT-PCR analysis. n=3-10 in each group. *P < 0.05, **P < 0.01, ***P < 0.001, ****P < 0.0001. Bars represented means +- SEM.
- Submitted by
- Invitrogen Antibodies (provider)
- Main image
- Experimental details
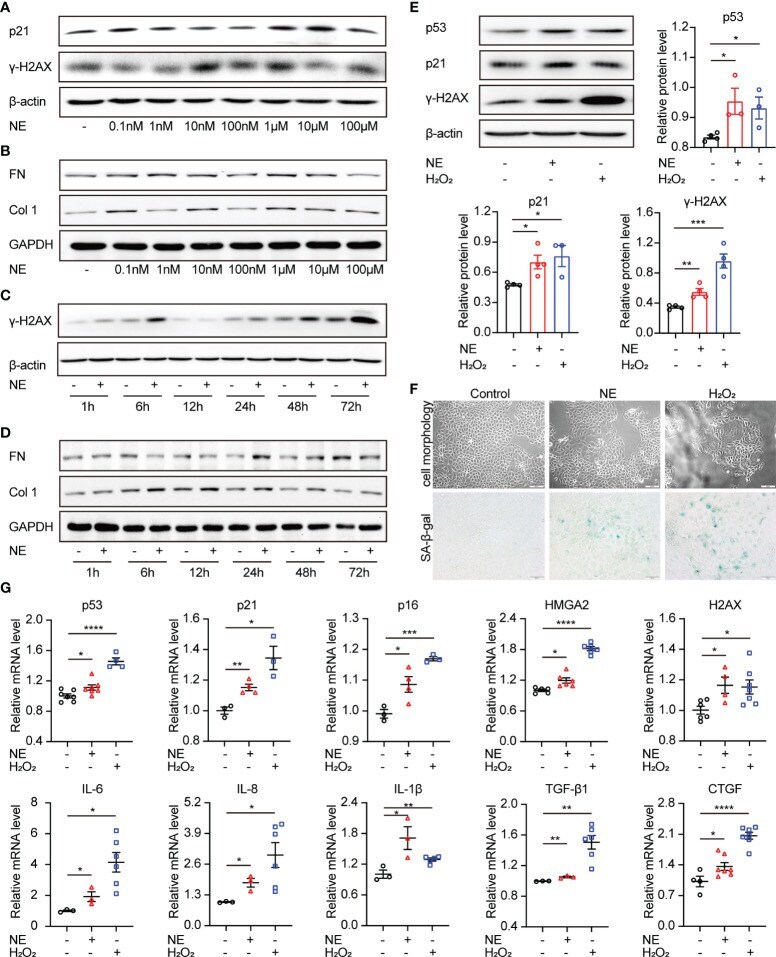
- Figure 3 Norepinephrine contributes to cellular senescence and upregulates profibrogenic and proinflammatory cytokines in renal tubular cells. (A, B) Representative Western blot of p21, gamma-H2AX or FN, Col 1 in TKPTS cells cultured with PBS (control) or different concentrations of NE (0.1 nM, 1 nM, 10 nM, 100 nM, 1 muM, 10 muM, and 100 muM) (n=3 in each group). (C, D) Representative Western blot of gamma-H2AX or FN, Col 1 in TKPTS cells incubated with PBS (control) or NE at a final concentration of 10 nM for the indicated periods (1, 6, 12, 24, 48, and 72 hours) (n=3 in each group). (E-G) TKPTS cells were incubated with NE (10 nM) or H 2 O 2 (100 muM) for 48 hours and were then harvested. (E) Representative Western blot of p53, p21, and gamma-H2AX in TKPTS cells treated with PBS, NE, or H 2 O 2 with densitometry analysis (n=3-5 in each group). (F) Representative images of cell morphology and SA-beta-gal staining of TKPTS cells treated with PBS, NE, or H 2 O 2 using a microscope (n=3 in each group). Scale bar=50 mum. (G) mRNA levels of senescence-related proteins (p53, p21, p16, HMGA2, H2AX), SASP components (IL-6, IL-8, IL-1beta), and profibrotic cytokines (TGF-beta1, CTGF) in each group were detected by qRT-PCR analysis (n=3-7 in each group). *P < 0.05, **P < 0.01, ***P < 0.001, ****P < 0.0001. Bars represented means +- SEM.
- Submitted by
- Invitrogen Antibodies (provider)
- Main image
- Experimental details
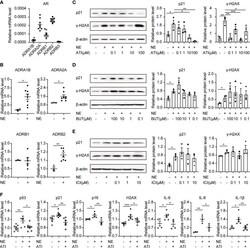
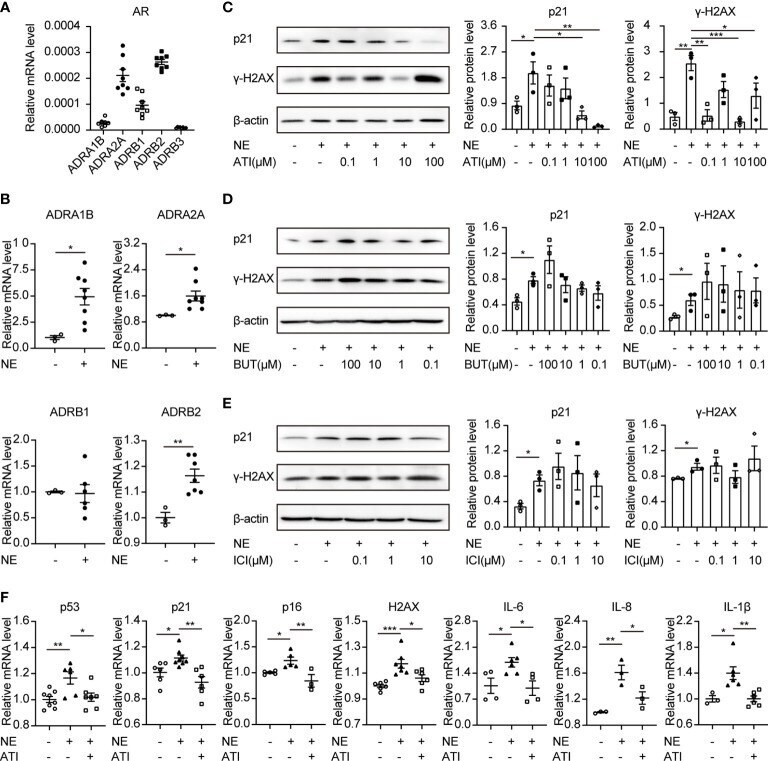
- Figure 4 Atipamezole (alpha 2 -adrenergic antagonist) reverses cellular senescence induced by NE in renal tubular cells. TKPTS cells were incubated with NE (10 nM) for 48 hours after pretreatment with adrenergic antagonists or PBS for an hour. (A, B) mRNA expressions of ADRA1B, ADRA2A, ADRB1, ADRB2, and ADRB3 in PBS (control) or NE-treated TKPTS cells as shown by qRT-PCR analysis (n=3-8 in each group). (C) Representative Western blotting of p21 and gamma-H2AX in TKPTS cells treated with PBS, NE, and NE+ATI (Atipamezole, 100 nM, 1 muM, 10 muM, and 100 muM) with densitometry analysis (n=3 in each group). (D, E) Representative Western blotting of p21 and gamma-H2AX in TKPTS cells incubated with PBS, NE, and NE+BUT (Butoxamine)/ICI (ICI118551) (two beta 2 -adrenergic antagonists, 100 muM, 10 muM, 1 muM, and 100 nM) with densitometry analysis, respectively (n=3 in each group). (F) mRNA expressions of p53, p21, p16, H2AX, IL-6, IL-8, and IL-1beta in TKPTS cells cultured with PBS, NE, and NE+ATI (10 muM) as displayed by qRT-PCR analysis (n=3-8 in each group). *P < 0.05, **P < 0.01, ***P < 0.001. Bars represented means +- SEM.
- Submitted by
- Invitrogen Antibodies (provider)
- Main image
- Experimental details
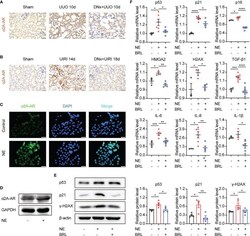
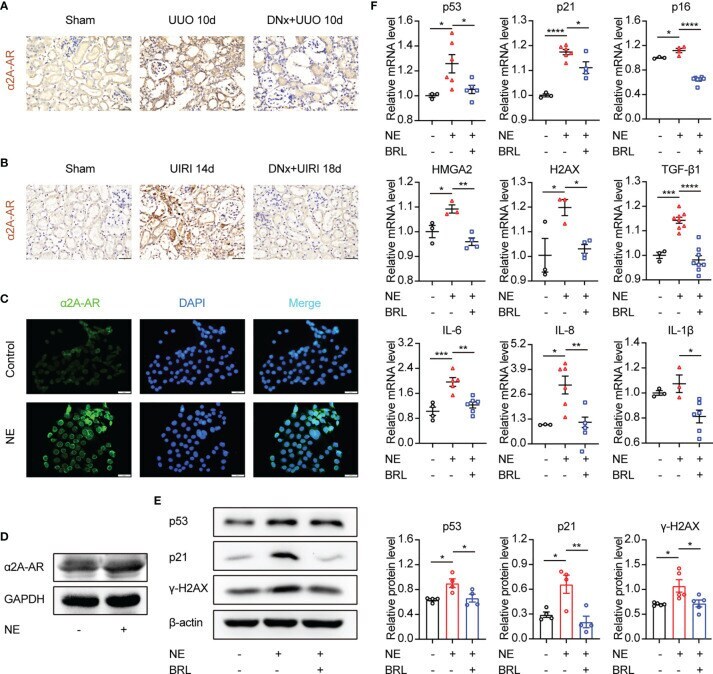
- Figure 5 The alpha 2A -adrenergic receptor is responsible for NE-induced tubular epithelial cell senescence. (A, B) Renal denervation (DNx) or sham operation was performed 2 days before UUO or UIRI in the left kidneys of mice. Representative images of immunohistochemistry for alpha 2A -adrenergic receptors (alpha 2A -AR) in sham-operated, UUO/UIRI, mice and DNx+UUO/UIRI mice. Scale bar, 20mum. (C, D) After starving for 8 hours, TKPTS cells were cultured with PBS or NE (10 nM) for 48 hours. alpha 2A -AR expressions were tested by immunofluorescence (C) (Scale bar, 20 mum) and Western Blot (D) (n=3 in each group). (E, F) After pretreatment with PBS or alpha 2A -adrenergic antagonist (BRL4408, BRL, 10 muM) for 1 hour, TKPTS cells were incubated with NE (10 nM) for 48 hours. (E) Representative Western blotting of p53, p21, and gamma-H2AX in each group with densitometry analysis (n=4-5). (F) mRNA expressions of p53, p21, p16, HMGA2, H2AX, TGF-beta1, IL-6, IL-8, and IL-1beta were analyzed using qRT-PCR analysis (n=3-8 in each group). *P < 0.05, **P < 0.01, ***P < 0.001, ****P < 0.0001. Bars represented means +- SEM.
- Submitted by
- Invitrogen Antibodies (provider)
- Main image

- Experimental details
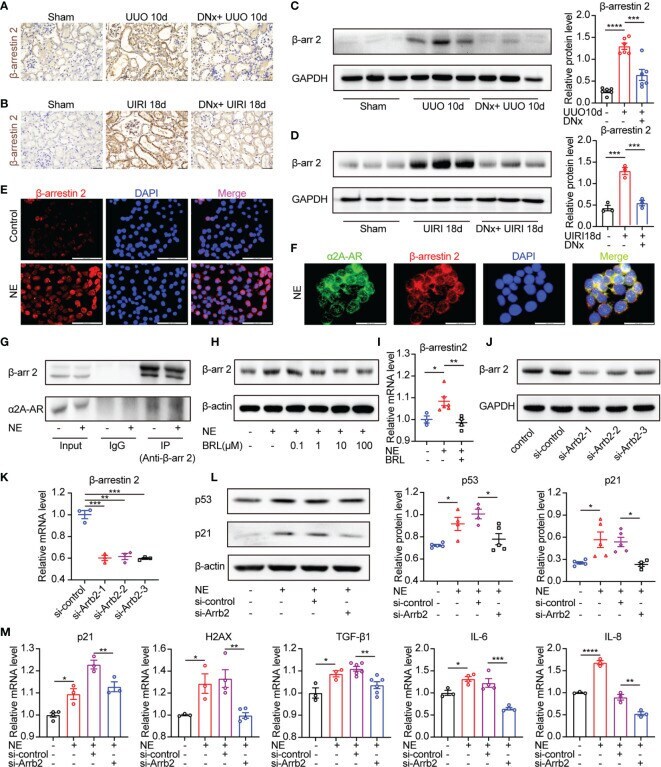
- Figure 6 beta-arrestin2 is a target of alpha 2A -AR and knockdown of beta-arrestin2 ameliorates NE-induced tubular cellular senescence. (A, B) Renal denervation (DNx) or sham operation was performed 2 days before UUO or UIRI in the left kidneys of mice. Representative images of immunohistochemistry for beta-arrestin2 in sham-operated, UUO/UIRI mice, and DNx+UUO/UIRI mice. Scale bar, 20 mum. (C, D) Representative Western blotting of beta-arrestin2 (beta-arr2) in sham-operated, UUO/UIRI, and DNx+UUO/UIRI kidneys with densitometry analysis (n=3-6 in each group). (E-G) TKPTS cells were cultured with PBS or NE (10 nM) for 48 hours. (E) Representative images of immunofluorescence for beta-arrestin2 in each group. Scale bar, 20mum. (F) Cells were double-labeled with alpha 2A -AR (green) and beta-arrestin2 (red), and cell nuclei were enhanced by staining with DAPI (blue). Colocalization of alpha 2A -AR (green), and beta-arrestin2 (red) was visualized as yellow in merged images. Scale bar, 20mum. (G) Interactions between beta-arrestin2 and alpha 2A -AR were examined by immunoprecipitation (IP) with an anti-beta-arrestin2 antibody, followed by immunoblotting (IB) with anti-alpha 2A -AR antibodies. (H, I) After an hour of pretreatment with PBS or BRL4408, TKPTS cells were stimulated with NE (10 nM) for 48 hours. (H) Representative Western blotting of beta-arrestin2 (beta-arr2) in TKPTS cells treated with PBS, NE, and NE+BRL (100 nM, 1 muM, 10 muM, and 100 muM) (n=3 in each group). (I) m